Chatbots and 3D Maps: Evaluating Information
Retrieval Across Multiple Mediums
by
Kimberly A. Leon
B.S. Computer Science and Engineering
Massachusetts Institute of Technology, 2017
Submitted to the Department of Electrical Engineering and Computer
Science
in partial fulfillment of the requirements for the degree of
Master of Engineering in Computer Science and Engineering
at the
MASSACHUSETTS INSTITUTE OF TECHNOLOGY
September 2017
c Massachusetts Institute of Technology 2017. All rights reserved.
Author . . . .
Department of Electrical Engineering and Computer Science
August 16, 2017
Certified by. . . .
Federico Casalegno
Associate Professor of the Practice
Thesis Supervisor
Accepted by . . . .
Christopher J. Terman
Chairman, Masters of Engineering Thesis Committee
Chatbots and 3D Maps: Evaluating Information Retrieval
Across Multiple Mediums
by
Kimberly A. Leon
Submitted to the Department of Electrical Engineering and Computer Science on August 16, 2017, in partial fulfillment of the
requirements for the degree of
Master of Engineering in Computer Science and Engineering
Abstract
In this thesis, we present data retrieval accomplished through two extremes of af-fordance. First, a natural language understanding (NLU) driven chatbot, which has minimal affordance — the only visual cue users are given is an empty text box, an ini-tial greeting message, and a list of general topics the chatbot can respond to. Second, a table-mounted tactile / digital map display (tangible map), the proposed antithesis to the chatbot, which has maximal affordance — users can see everything available to them through the combination of a three-dimensional map atop interactive touch-screens and a native iPad app.
The two mediums described above were both implemented as pieces of a single larger project: the MIT Atlas Service Center, and are meant to showcase the talent and research that happens in each of the 5 schools of MIT.
As the author’s time was not spent equally between the two mediums during the design and implementation phases, the main focus of this thesis up until Chapter 5, User Studies, will be the chatbot, and the length and detail of the chatbot-related sections will reflect this.
In this thesis, we describe the motivation behind both projects, as well as their design and technical development. We then describe the evaluation of both mediums, which involves user studies with the goal of evaluating information retrieval across multiple mediums (the chatbot, the tangible map, and existing, public information retrieval services, i.e. Google Search). Finally, We describe the conclusions we arrive at as a result of the collected user study data.
Our primary contributions are the implemented chatbot and tangible map, as well as the insights learned due to the user studies performed with both mediums. Thesis Supervisor: Federico Casalegno
Acknowledgments
First, I would like to thank my advisor Federico Casalegno for giving me the freedom to steer this project in the direction I thought was best and allowing me to spend time on other projects within the Design Lab that interested me.
There were many other people involved in the project, especially during the design and development of the tangible map. Will Walker, Hyungie Sung (who introduced me to this project) and CK Ong developed and built the tangible map and brought me up to speed when I joined the lab to such a degree that I was able to write this thesis.
I would also like to thank Curtis, for encouraging me to find a project more aligned with my area of interest early in my MEng, and for providing daily support during my last year at MIT.
I am also very grateful to my friends for all the amazing memories during my time at MIT: Wen, Maya, Aneesh, Leo, Jason, JT, Jessie, Stacy, and everyone on Burton One. And of course, Mom, Dad, and Steph for their unwavering love and support.
Contents
1 Introduction 13
1.1 The Larger Project: MIT Atlas Service Center . . . 14
1.2 Motivation for a Natural Language Conversational Agent . . . 15
1.2.1 Existing Chatbot Services . . . 16
1.2.2 Existing Chatbot Construction Tools . . . 18
1.2.3 Additional Challenges in the Conversational Agent Space . . . 18
1.3 Motivation for a Tangible Map . . . 19
1.4 Thesis Roadmap . . . 20
2 Overview 21 2.1 Project Audience . . . 21
2.2 Database Collections . . . 22
3 Chatbot Development 25 3.1 Natural Language Processing (NLP) Overview . . . 25
3.1.1 Entity Recognition . . . 26
3.1.2 Multi-Turn Conversations . . . 27
3.2 Concept and Design . . . 27
3.2.1 Intended Use Cases . . . 29
3.2.2 Design Goals . . . 30
3.3 Implementation . . . 31
3.3.1 Software Stack . . . 31
4 Tangible Map Development 35
4.1 Previous Work . . . 35
4.2 Concept and Design . . . 36
4.2.1 Intended Use Cases . . . 36
4.2.2 Design Goals . . . 37 4.3 Implementation . . . 37 4.3.1 Physical Layout . . . 38 4.3.2 Software Layout . . . 38 5 User Studies 41 5.1 Methodology . . . 41 5.2 Evaluation Techniques . . . 42 5.3 Results . . . 43 5.3.1 Chatbot Results . . . 43
5.3.2 Tangible Map Results . . . 46
5.4 Discussion . . . 47 6 Conclusion 53 6.1 Key Findings . . . 53 6.1.1 Design Process . . . 53 6.1.2 Implementation . . . 54 6.1.3 User Studies . . . 54 6.2 Contributions . . . 54
List of Figures
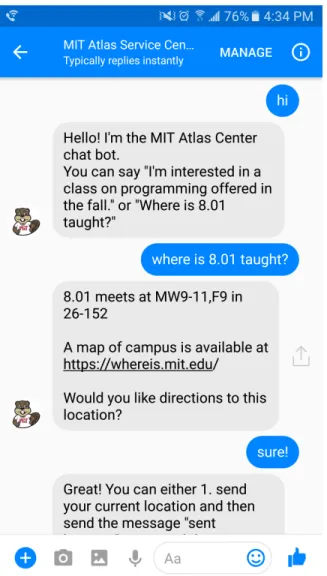
1-1 An example interaction used to illustrate what the user sees when messaging the chatbot. . . 15 1-2 left: The tangible map in its final installation site, the MIT Atlas
Center. right: A building is illuminated and information is displayed on the dynamic touch screen as a user selects a building to explore. . 19 3-1 An example of entity recognition displaying three entity types and their
values. . . 26 3-2 An example of a chatbot that forces users to choose from a list of
prompts, rather than having users construct their own messages. This kind of chatbot uses a decision tree structure in the back-end, rather than NLU. . . 28 3-3 Various components of a domain-specific chatbot. The hosted
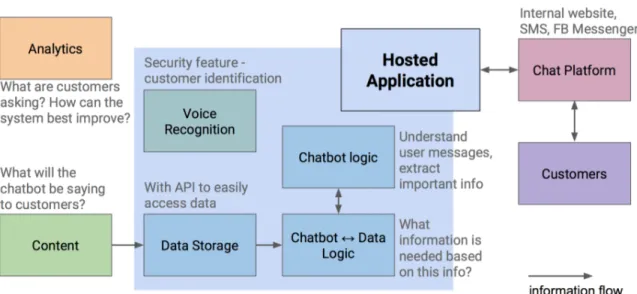
appli-cation and its sub-components are shown at the center, with voice recognition being an optional sub-component. The remainder of the figure shows how information enters and leaves the system, as well as the importance of analyzing conversations. . . 29 3-4 Examples of the Atlas chatbot conversing with a user. left: The Atlas
chatbot lists classes related to machine learning that are offered during the fall term. middle: The Atlas chatbot provides walking directions to the user from their current location to their building of interest. right: The Atlas chatbot lists events happening on campus in the near future. 30
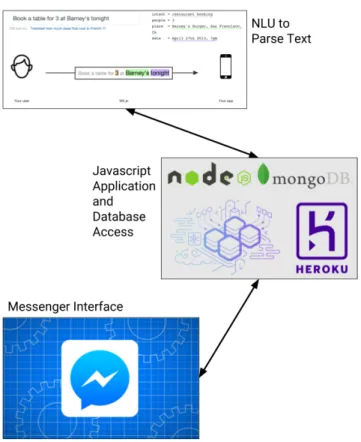
3-5 The Atlas chatbot’s software stack. top: wit.ai takes in the user’s message and determines which of a list of actions to take in response, sending the appropriate action back to the Node.js app. middle: The Node/Heroku/MongoDB application relays information from the user to wit.ai and queries the MongoDB database for the appropriate in-formation to send as a response. bottom: The user interacts with the chatbot via Facebook Messenger, with all messages going to / coming from the underlying Node.js application. . . 32 4-1 Layout of the tangible map, including both the physical and software
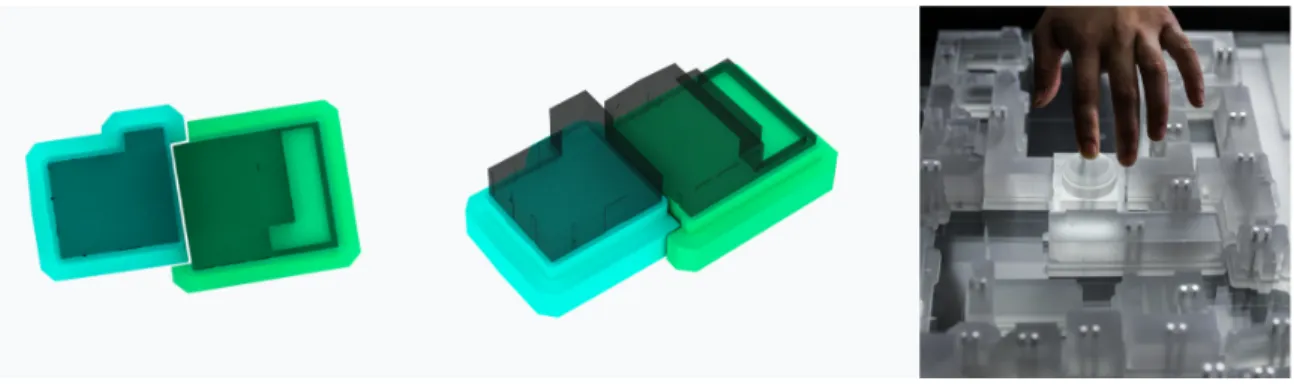
components. . . 38 4-2 left: Schematic diagram of 3D printed structures designed to support
overhangs. Full building structure is represented in gray and support structures are highlighted in green. center: Full building with support structures in place. right: Final 3D printed building created using support structures. . . 39
List of Tables
5.1 Chatbot timed tasks results. All times in Minute:Second.millisecond format. Both the average times and standard deviations are shown for each task, with these statistics excluding runs where the chatbot answered the user’s query incorrectly. As the chatbot’s NLU was not perfect at the time of testing, the last column displays what percentage of questions were answered incorrectly for each task. . . 44 5.2 Chatbot survey results. Users answered these survey questions after
completing the tasks listed in Table 5.1. . . 45 5.3 Tangible map timed tasks results. All times in Minute:Second.millisecond
format. Both the average times and standard deviations are shown for each task. . . 46 5.4 Tangible map survey results. Users answered these survey questions
Chapter 1
Introduction
In today’s data driven world, there is often more information available than consumers realize exists. In order to ensure that the intended audience accesses the best subset of the available information, the medium in which this information is presented plays the most crucial of roles. The medium selected contributes greatly to the audience’s satisfaction with the data they have retrieved, the audience’s engagement with the platform used to retrieve the data, the amount of data exploration done, and the efficiency with which the audience obtains the sought out data.
In this thesis, we present data retrieval accomplished through two extremes of affordance. First, a natural language understanding (NLU) driven chatbot, which has minimal affordance — the only visual cue users are given is an empty text box, an initial greeting message, and a list of general topics the chatbot can respond to. Second, a table-mounted tactile / digital map display (tangible map), the proposed antithesis to the chatbot, which has maximal affordance — users can see everything available to them through the combination of a three-dimensional map atop interac-tive touchscreens and a nainterac-tive iPad app.
These two mediums were built as pieces of a single larger project: the MIT Atlas Service Center1, which opened in March 2017 in building E17. As the author’s time
was not spent equally between the two mediums during the design and implementation phases, the main focus of this thesis up until Chapter 5, User Studies, will be the
chatbot, and the length and detail of the chatbot-related sections will reflect this. In this chapter, we first describe the purpose of the MIT Atlas Service Center. Then, we go on to detail the motivation behind each of the above listed mediums within the Atlas Center. Finally, we provide a roadmap for the remainder of this thesis.
1.1 The Larger Project: MIT Atlas Service Center
The MIT Atlas Service Center is an administrative center, which students and faculty can visit for an array of administrative purposes. The Atlas Service Center is meant to provide a physical supplement to the internal MIT Atlas website, which is a portal to all administrative tools within MIT. The services offered at the Atlas Center include printing ID cards and taking passport photos, an IT walk-in center and computer repair services, and new employee orientation. In order to create a welcoming and entertaining environment, the Atlas Center partnered with the MIT Design Lab2 to
design an educational and interesting space for an office that performs classically routine organizational tasks.
In addition to designing an open layout for the Atlas Center and modernizing the space and user experience with digital kiosks and app-integration, the Design Lab endeavored to showcase the talent and research that happens in each of the 5 schools of MIT. With this goal in mind, the Design Lab envisioned two mediums that would showcase this information and provide an enjoyable experience during and after a visit to the Atlas Center:
1. A chatbot that would allow visitors to take the information offered by the Atlas Center to-go. The chatbot would allow visitors to obtain information via a conversational interface.
2. A tangible, interactive map that offered the same information in a 3D map format. The tangible map would allow visitors to explore MIT’s physical layout
and encourage tactile interactions.
Both mediums are described further in this thesis and their motivations are out-lined in the sections below.
1.2 Motivation for a Natural Language
Conversa-tional Agent
Figure 1-1: An example interaction used to illustrate what the user sees when mes-saging the chatbot.
Over recent years, there has been an upsurge in natural language based assistants such as Siri, Google Assistant, and Cortana. These systems are able to provide information for multiple tasks and domains including making appointments, sending text messages, providing weather or transportation information, or searching the web. The conversational agents at the face of these systems are known as chatbots, and provide an efficient way for users to access a range of information in a friendly, natural way. Our aim in developing a chatbot for the MIT Atlas Center was to provide a friendly digital assistant for retrieving information related to a variety of domains within the MIT campus. We had hoped that the Atlas chatbot’s friendly conversational interface would increase user engagement, which would in turn lead to an increase in the amount of data retrieved from the system.
Our first iteration of the Atlas chatbot was meant to be a rapid prototype that relays publicly available campus-related information to the users it communicates with. Further iterations would include protected personal information, which could only be accessed through a security wall. If a member of the MIT community had access privileges (much like the access privileges required to visit the Atlas website), they would be able to use certain additional skills that the chatbot would perform only for members of the MIT community, not available to the general public. For example, we envisioned a version of the Atlas chatbot that could tell a user how much TechCASH3 they currently have in their account.
In order to expedite deployment of the first iteration of the bot, as well as provide an interface our target audience would find natural to interact with, we deployed the Atlas chatbot as a Facebook Messenger bot. See Figure 1-1 for a simple example of a conversation between a user and the Atlas chatbot.
1.2.1 Existing Chatbot Services
While chatbots produced and maintained by large tech companies (e.g. Siri, Google Assistant, Cortana, Amazon Alexa) perform adequately in most cases and have pro-tocol in place for tasks they cannot perform (i.e. the bot telling the user that they’re
sorry, but they cannot perform the task asked of them), chatbots without the support of a top-ten tech company behind them will almost certainly respond incorrectly or simply not respond at all some portion of the time [13]. In the case of Higashinaka et al., the percentage of breakdowns even increased after informed revisions were made, with the percentage of breakdowns rising from 20% to 25.5%, averaged over two annotators.
This liability to error is especially strong when a user makes out-of-domain queries [10]. Out-of-domain queries are messages from a user on a topic outside the chat-bot’s domain of knowledge. Out-of-domain queries that contain a syntactic structure similar to in-domain queries will often elicit an off-topic response from the chatbot. In addition, if the chatbot is not setup to handle queries it cannot answer, it may breakdown completely.
The various models that can be used to process user messages and decide whether or not the chatbot can accurately respond to these messages is discussed in more detail in Section 3.1. Without going into detail, it is standard for the above-mentioned models to provide a confidence rating on their interpretation of the user’s message. When creating a chatbot, one must decide on a confidence threshold for the bot — such that the bot only responds when it has a certain degree of confidence in its interpretation of the user’s message — that must be high enough to minimize incorrect responses from the bot but low enough so that the chatbot can intelligently respond to the user without requiring 100% confidence that its response is the correct one, as this would greatly limit the number of responses from the chatbot.
Chatbot response error and breakdown negatively affect the user experience and diminish the reputation of the very organization the chatbot was created to benefit. We went into the development of the Atlas chatbot with these known trade-offs well in mind.
1.2.2 Existing Chatbot Construction Tools
A number of platforms have recently been established for creating chatbots4, but there
remain difficulties since each chatbot must be built for the specific tasks at hand and requires a large amount of domain-specific data for development and training.
These difficulties aside, there are several examples of chatbots used for specific domains on a smaller scale than those offered by large tech companies. These include examples in the fields of healthcare [4, 9], weather forecast [17], tutoring [14], and tourism [15, 20].
However, to our knowledge there is no existing chatbot which provides access to information about a particular university’s breadth of information. Our chatbot was built with the design and implementation lessons learned from the domain-specific chatbot examples listed above in mind. We went into the design process knowing that our chatbot would not perfectly answer every question asked of it, but set out to build an engaging and positive user experience nonetheless.
1.2.3 Additional Challenges in the Conversational Agent Space
As mentioned in Section 1.2.2, a large amount of domain-specific data is needed for the development and training of a chatbot. Domain-specific data collection can be costly to generate, as it requires multiple people and tools to produce all possible syntactic variations of a message that all convey the same meaning.
Even if an existing system is in place to provide the needed data — for exam-ple, transcriptions of telephone calls to a customer service center that is to be sup-plemented by a customer service chatbot — the same collection difficulties present themselves when an expansion of the bot’s domain of knowledge is required. Before deciding to build a chatbot (unless users are only allowed to choose from a list of pre-written responses, rather than constructing their own messages), the tasks meant for the bot must allow room for error because the chatbot will not respond perfectly to every message. This means plans to build chatbots in the domains of sensitive
subjects, for example: the movement of large quantities of money or a provider of medical advice, should be given a second thought before being built. As an alterna-tive, the chatbot should be presented with a disclaimer freeing the organization that created the chatbot of legal responsibilities based on the actions taken or advice given by the bot.
1.3 Motivation for a Tangible Map
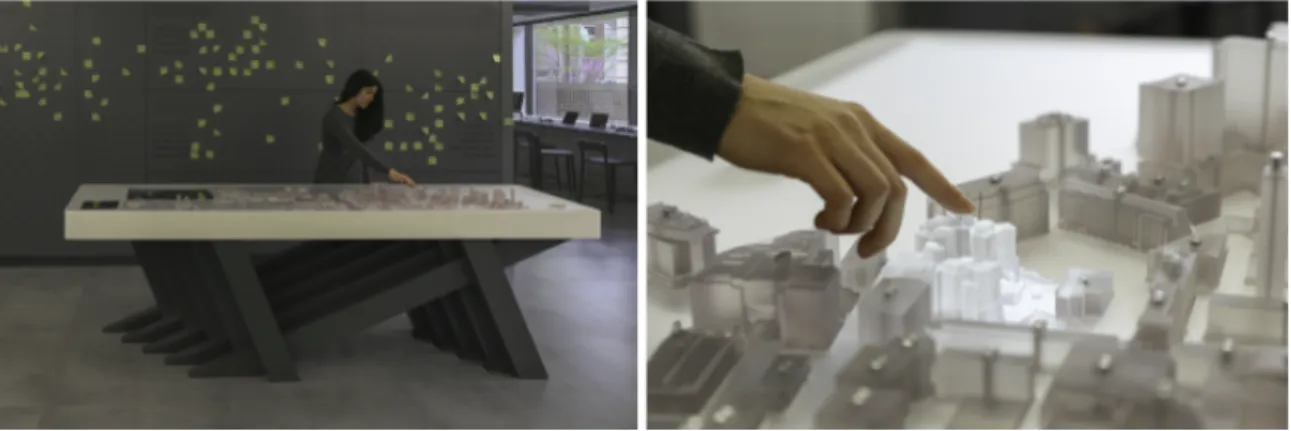
Figure 1-2: left: The tangible map in its final installation site, the MIT Atlas Center. right: A building is illuminated and information is displayed on the dynamic touch screen as a user selects a building to explore.
Even with technology’s many advancements in the space of automated directions and map interfaces over the past few decades, the standard representation of a region remains two-dimensional. This 2D representation uses abstract map symbols, which can make the map a challenge to parse due to the disconnect between flat displays and spatial information. Our aim in creating a tangible map for the Atlas Center was to address this problem by creating a bridge between abstract campus data and the physical spaces the data represents. Our hope was that the interactive 3D map would encourage exploration and a higher level of engagement compared to existing information sources, due to the increase in information that can be displayed at once and the dynamic touch screens under the buildings, which respond to building selec-tions, among other things. Figure 1-2 shows the tangible map in it’s final installation site, the MIT Atlas Center.
Further discussion of previous work in the tangible map space and the design goals of the tangible map can be found in Chapter 4.
1.4 Thesis Roadmap
The rest of the thesis is organized as follows:
Chapter 2 provides an overview of the MIT Atlas Center, gives a thorough de-scription of the intended audience of both the chatbot and tangible map, and provides details on the shared database queried by both the chatbot and tangible map.
Chapters 3 and 4 go into the details of the chatbot development and implemen-tation and tangible map development and implemenimplemen-tation, respectively. Chapter 5 describes the user studies performed as an evaluation of both mediums and presents the results of the two user studies, as well as a discussion of these results.
Chapter 2
Overview
In this chapter, we further discusses the MIT Atlas Service Center and the audience the Atlas chatbot and tangible map were created for. We then go on to describe the database used by both mediums, how the collections within the database are populated and maintained, and provide an overview of the contents of each collection.
2.1 Project Audience
As our audience consists of everyone who visits the MIT Atlas Service Center, our audience extends across MIT faculty and students, as well as visitors that need to find their way around campus. Since the majority of visitors to the MIT Atlas Center are there to have administrative or technical tasks done on their behalf, or are new members of the MIT community attending new employee orientation, we envisioned the tangible map as an entertaining and educational way for visitors to learn about the MIT campus and the various departments and people within the campus. The chatbot was meant to accompany the tangible map as a mobile system that can relay the same information as the tangible map. Visitors could explore the tangible map while they wait to be called for their appointments, and then take the information they were exploring in the map with them post-appointment, through the Atlas chatbot.
The majority of our intended chatbot users have some experience with a chatbot. Whether this be Siri, Google, Alexa, or a smaller bot, we found that our intended
audience has some (if minimal) experience interacting with a natural language in-terface. In contrast, we identified that most of the users of the tangible map will have never encountered a similar installation in the past. With this novelty factor, we envisioned users being interested in being able to explore the map and having an organic experience in understanding their surroundings.
2.2 Database Collections
Both the chatbot and tangible map draw their information from the same database, which contains a variety of information related to the MIT campus and community.
Various scripts are used to obtain data through either API calls or the scraping of relevant university websites. This data is stored in a MongoDB database and queried using Mongoose1, a schema-based solution to model data in a Node.js application.
The collections within this database are listed below, each accompanied by a short description of its contents:
Arts— Art installations on MIT’s campus, with each entry containing the piece’s title, artist, year, description, coordinates, and an image of the piece.
Bikeracks — Provided by MIT and hard-coded into our database is the latitude and longitude of all bikeracks on campus.
Buildings — The MIT Places API provides the coordinates, name, number, street and mailing addresses, architect, contents (offices and venues), and departments within each building.
Classes — From the MIT Course Catalog, we are able to obtain the number, name, instructor, class description, meeting times and location, and terms offered for each class.
Departments — The MIT Places API provides the number and name of each department, as well as a list of buildings in which each department inhabits.
Directions — A mapping from building numbers to an OpenStreetMaps2 url,
1http://mongoosejs.com/
which provides step-by-step directions from A to B (where A and B are MIT build-ing numbers). OpenStreetMaps was chosen because it provides walkbuild-ing and bikbuild-ing directions that, in addition to allowing transportation on traditional streets, also uses non-street paths through campus not otherwise shown in more popular navigational applications.
Events — The MIT Calendars API provides the event start and end times, lo-cation of the event, title and description, main lecturer if applicable, which subset of individuals the event is open to, and contact information for the event’s coordinator. News — The MIT News API provides the entirety of each news article on the university’s news page, the article’s author and publication date, and a url to the specific article.
People — The MIT Data Warehouse provides the name, title, and departments of every person in the MIT employee directory. We then perform a Google image search in order to obtain an image of each employee.
Shuttle routes— The MIT Shuttles API, which is a layer on top of the NextBus API, provides the routes of the various shuttle lines that run through campus. This includes the path segments and days and times when each shuttle runs.
In our user studies detailed in Chapter 5, we focus on the classes, directions, events, and people collections within this database, and evaluate our two mediums against a baseline of the existing applications our participants currently use to obtain this information. Since the subset of collections selected for our user studies require no security measures and all contain publicly available information, the most common applications we found users using as their baselines were search engines and if needed, well-known MIT websites accessed through search engine results. If these studies were performed on a database less publicly available — either because of security needs or a lesser prominence of the institution / organization at the center of the database — we believe our results would differ greatly.
Chapter 3
Chatbot Development
In this chapter, we describe the relevant natural language processing (NLP) concepts used in chatbot development. Then, we describe our specific concept and design strategies for the Atlas chatbot. Finally, we detail the implementation process of the Atlas chatbot and go through the bot’s software stack.
3.1 Natural Language Processing (NLP) Overview
NLP is a sub-field of Artificial Intelligence (AI), concerned with the understanding (natural language understanding, or NLU) and generation (natural language gen-eration, or NLG) of text-based language. The creation of conversational agents is just one of numerous applications of NLP. Some other popular applications of NLP include sentiment analysis, part-of-speech tagging, and relationship extraction. Dif-ferent chatbots use varying aspects of NLP to interact with users. We will discuss a few of these aspects in this section.
Most chatbots in production today use entity recognition, as described in Section 3.1.1, to interpret messages from users. More advanced chatbots with a larger training corpora and more general knowledge space may instead use deep learning, using neural networks to interpret meaning from various pieces of text. As our Atlas chatbot does not use deep learning, we will refrain from delving into further details.
is sent back to the user. As our Atlas chatbot responds to a select number of queries, the bot’s responses are pre-structured, and thus the response process does not involve NLG. Instead, the Altas chatbot queries our database based on its interpretation of the user’s most recent message or past few messages, and inserts the resulting queried value into a pre-specified position in a pre-written response.
The two NLP concepts we concerned ourselves with most when creating the Atlas chatbot are entity recognition and the challenges of multi-turn conversations. Each of these concepts will be discussed further the subsections that follow.
3.1.1 Entity Recognition
events
campus
robotics
Are there any
happening on
involving
?
location
db collection
topic of interest
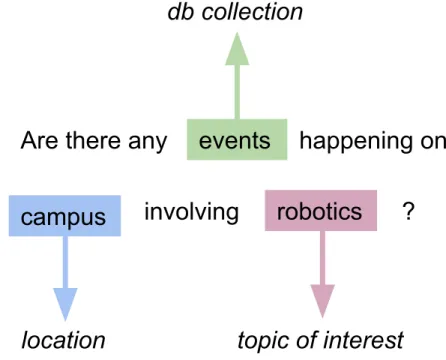
Figure 3-1: An example of entity recognition displaying three entity types and their values.
Most chatbots use entity recognition to parse the messages received by the bot. Entity recognition is a sub-task of information extraction. It is the location and classification of named entities within a piece of text into predefined categories such as the names of people, organizations, locations, dates, etc. An example of entity
recognition can be seen in Figure 3-1. Entity recognition relies on training examples in order to learn where in a sentence and in what format a certain entity is most likely to appear.
A great challenge in entity recognition, and therefore one of the bigger challenges for the chatbot’s understanding of human generated text, is the amount of annotated data needed to train the bot properly [21]. In order for the system to understand what a specific entity is, it needs to process many examples of that entity to be used as prior knowledge.
3.1.2 Multi-Turn Conversations
More complex chatbots also face the difficulty of multi-turn conversations, where the chatbot must keep track of context from previous messages in order to understand the most recent message [23]. This task is especially difficult when the end of one conversation and the start of the next is not easily distinguishable. Just as in entity recognition, a chatbot’s ability to perform multi-turn conversations increases with an increase in training data. To remedy the low-data problem almost all chatbot systems face, crowd-sourcing initiatives to collect and annotate human-chatbot interactions have been developed [16, 19].
3.2 Concept and Design
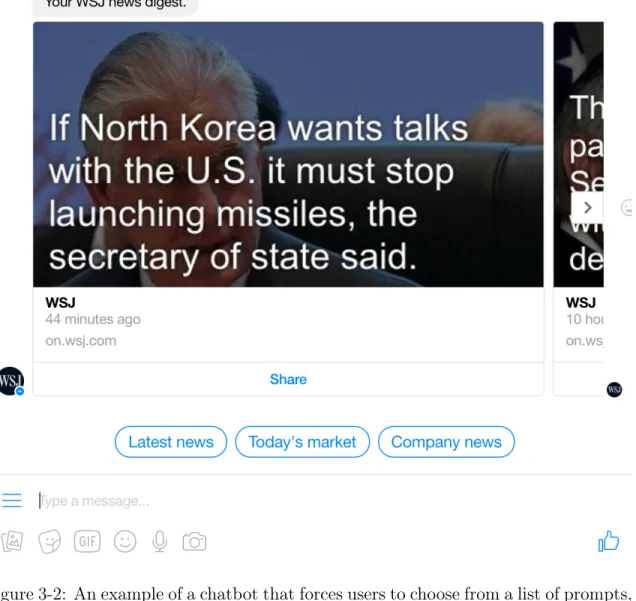
With the Atlas chatbot, we wanted to build a conversational agent that would be able to respond to a variety of queries, rather than offering unsolicited information or giving the user a list of prompts to choose from. Most chatbots available for public interaction use this prompt selection style of interaction, rather than allowing users to send their own messages. Figure 3-2 shows an example of this kind of chatbot, created for the Wall Street Journal. This kind of chatbot uses a decision tree structure in the back-end, rather than NLU. This structure removes the risk of chatbot response error described in Section 1.2.1 by maintaining complete control over the possible chatbot-user interactions.
Figure 3-2: An example of a chatbot that forces users to choose from a list of prompts, rather than having users construct their own messages. This kind of chatbot uses a decision tree structure in the back-end, rather than NLU.
Although our decision to make the Atlas chatbot a NLU-based bot rather than a decision tree bot increased the number of errors the bot would inevitably make, we felt it was worth the increased number of errors given the how greatly it would increase the number of queries users could make. Building a NLU-based chatbot also allows the bot to be accommodating of new information added to the database collections.
However, NLU-based chatbots require training data. We did not have an existing corpora of training data, so in order to produce a working chatbot in a timely manner
General Components for a Domain-Specific Chatbot
Figure 3-3: Various components of a domain-specific chatbot. The hosted application and its sub-components are shown at the center, with voice recognition being an optional sub-component. The remainder of the figure shows how information enters and leaves the system, as well as the importance of analyzing conversations.
(we also did not have months to acquire new data or the funds to pay people to generate this data), we turned to existing tools made by AI focused companies. The tool we eventually chose also allows for multi-turn conversations, described in more detail in Section 3.1.2.
3.2.1 Intended Use Cases
The following are examples of intended use cases we envisioned for the Atlas chatbot: New Student: A new student may be searching for classes to take, and rather than scrolling through the class listings page, wants to quickly get an idea of what classes MIT offers on a certain topic. The new student may ask the Atlas chatbot: "what are some classes on machine learning offered in the fall?"
New Employee: A new employee may have a meeting scheduled later in the day, but is unfamiliar with the layout of MIT’s campus. The new employee may ask the Atlas chatbot for: "directions to brain and cognitive science"
Visitor: A visitor on campus may have some free time during their stay in Cam-bridge and is wondering if there are any events at MIT that might occupy their time.
The visitor may ask the Atlas chatbot for: "events happening in the next 3 days" We implemented the Atlas chatbot such that the above questions, as well as related queries, could be answered quickly and correctly. The bot’s responses to the above three queries are shown in Figure 3-4.
Figure 3-4: Examples of the Atlas chatbot conversing with a user. left: The Atlas chatbot lists classes related to machine learning that are offered during the fall term. middle: The Atlas chatbot provides walking directions to the user from their current location to their building of interest. right: The Atlas chatbot lists events happening on campus in the near future.
3.2.2 Design Goals
The chatbot was designed to provide a friendly digital assistant for retrieving infor-mation related to a variety of domains within the MIT campus. We had hoped that the chatbot’s friendly conversational interface would increase user engagement, which would in turn lead to an increase in data exploration.
3.3 Implementation
In this section, we detail the chatbot’s software components and the reasoning behind each component choice. Then, we discuss the trade-offs faced during the later stages of implementation.
3.3.1 Software Stack
A number of factors influence the best way to go about designing a chatbot. These include the training corpus involved (corpus of phrases users might send to the chatbot and the corresponding correct actions for the system to take in response), application, and pattern matching technique [1]. For our particular use case, the training corpus was non-existent, the application was a Q&A chatbot with the intended audience of MIT students and affiliates, and the most appropriate pattern matching technique was entity recognition.
Since we had no training corpus, using an existing, more general NLU system was a way to have something that worked immediately (although to varying degrees of correctness) and allowed us to collect data that we could eventually use in a more customized, domain-specific implementation. Chatbot building platforms such as wit.ai1, API.ai2, and LUIS3 offer similar entity recognition services. We explored
each of these systems, and for ease of implementation, we chose wit.ai for the Atlas chatbot. Figure 3-5 shows the three main components of the Atlas chatbot and which components communicate with each other.
wit.ai handles the chatbot’s NLU component — i.e. turning users’ messages into actionable data through entity recognition. This actionable data is connected to an application we built using Node.js as the app framework and MongoDB as the data source. Within the Node.js app, there is a function written to handle each type of question the chatbot is able to detect and answer. Each of these functions uses the data provided by wit.ai to query the database, then formats the database results into
1https://wit.ai/ 2https://api.ai/
Figure 3-5: The Atlas chatbot’s software stack. top: wit.ai takes in the user’s message and determines which of a list of actions to take in response, sending the appropriate action back to the Node.js app. middle: The Node/Heroku/MongoDB application relays information from the user to wit.ai and queries the MongoDB database for the appropriate information to send as a response. bottom: The user interacts with the chatbot via Facebook Messenger, with all messages going to / coming from the underlying Node.js application.
an appropriate response to send back to wit.ai. The chatbot application is hosted on a Heroku dyno, and the main deployment of the chatbot is on Facebook Messenger. The bot has also been deployed on Slack and can be easily deployed on a number of other platforms, but Messenger was the most universally familiar for the intended audience4.
4The code for the Facebook Messenger implementation can be found at
https://github.mit.edu/kimleon/atlas-chatbot-fb, and code for the Slack implementation at https://github.mit.edu/kimleon/atlas-chatbot-slack
3.3.2 Trade-offs
As we developed the Atlas chatbot, we continuously added training data by having a number of people informally test the bot. When these users would ask the bot the same questions in various ways, we were able to collect the various phrases one could use to make a specific query, and train the bot on these phrases. As more phrases were added to the chatbot’s training set, it was able to correctly respond to more and more queries.
In implementing the chatbot, we started by focusing on questions that required a single database collection — arbitrarily chosen to be the classes collection. As we added more collections to the bot’s repository, more questions were added, and as a result, more computation was necessary to determine which question the user was asking. This led to a slower response time from the chatbot. In addition, users would phrase questions about one collection in a similar manner to questions about another collection. As a result, with every additional collection, the chatbot became more and more prone to errors. In summary, the chatbot performed best when responding to questions about a single collection and after the compilation of training data for questions pertaining to this collection. As the possible actions being requested began to multiply (when new collections were added), both response speed and accuracy of response declined.
We started to observe the drawbacks of adding new collections and new answerable questions to the chatbot’s repertoire when four collections (classes, people, directions, events) had been implemented.
Chapter 4
Tangible Map Development
In this chapter, we describe previous work done in the tangible map space, going into detail on a small number of projects that are closely related to the Atlas tangible map. Then, we describe our specific concept and design strategies for the Atlas tangible map. Finally, we detail the implementation of both the map’s hardware and software components.
4.1 Previous Work
Technological advances in the recent past have made affordable hardware technologies that used to be available only to a select few. High resolution touch screens and 3D printed objects are a few such technologies whose newly found attainability have fos-tered the development of several new interfaces and applications, including interfaces with tangible interactions. Tangible interaction elements have been shown to attract attention towards a display, provoke curiosity, and encourage engagement of nearby bystanders [7]. Tangible interaction elements have been implemented in the form of tabletops [18], objects atop digital displays [5], and 3D mapped tangible objects [22]. One example of a tangible interaction is Architales, an interactive story table, developed as an experiment in physical / digital co-design. Consisting of an interactive table for shared story engagement, the co-design principles behind this experiment proved successful for this interactive and tangible tabletop [18].
The T4 (transparent and translucent tangibles on tabletops) design enables direct touch of objects underneath the translucent tangibles, allowing for a stronger con-nection between the tangible and the screen, as well as more efficient usage of screen space [5].
3D mapped tangible objects have been created by adapting two dimensional in-formation into z-axis height or textures. 3D printed maps have been created to act as tangible layers by adapting 2D map data into a printable overlay [22].
Our tangible map builds off these existing design concepts in order to create an interactive tangible display that allows for more exploratory user interactions and provides access to live data gathered from multiple sources.
4.2 Concept and Design
In this section, we first describe a few example use cases for the Atlas tangible map. Then, we detail the design goals for the map.
4.2.1 Intended Use Cases
The following are examples of intended use cases we envisioned for the Atlas tangible map:
New Student: A new student may be visiting the Atlas Service Center in order to add TechCASH to their student ID. The student is planning on meeting a friend to work on a homework assignment after leaving the Atlas Center, but is unfamiliar with the layout of campus and uses the tangible map to find building 3. The question the tangible map is answering in this case is: "Where is building 3?"
New Employee: A new employee has just attended their new employee orienta-tion in the Atlas Center and stops by the tangible map out of curiosity. The employee touches the building they work in and scrolls through the list of employees that pop-ulates the information panel on the map. The question the tangible map is answering in this case is: "Who are the other employees that work in my building?"
up with a friend who works at MIT. The visitor sees the tangible map and figures it could lead them to the correct location. The visitor touches a few buildings until the building name Stratton Student Center is seen, which was the visitor’s intended destination. The visitor clicks the directions button on the screen and heads out. The question the tangible map is answering in this case is: "How can I get from my current location to the student center?"
Both the physical and software layout choices we made in the implementation of the tangible map were chosen to support the above needs and many others like them.
4.2.2 Design Goals
The tangible map was designed to encourage exploration. We suspected the great amount of information that can be displayed at once on the two large screens and the clarity of the spacial arrangements of the given information both on the screens and inherent in the printed 3D buildings would result in data exploration. We wanted users to be able to clearly understand the dynamic reactions to their interactions with the map, which we hoped would encourage further exploration.
4.3 Implementation
The tangible map consists of a touch-sensitive display surface, 3D printed buildings atop this surface, and an adjacent tablet. Users can either select a building directly and interact with the information that then displays on the touch-sensitive display surface, or search the tablet interface for specific information. The display surface consists of a section on which the map’s 3D printed buildings sit atop and a section that is exposed, which forms the information panel. The information panel displays information about buildings that have been selected from the map as well as search results that have been selected from the tablet application. Figure 4-1 shows the entire layout of the map.
The physical and software layouts for all components involved are described in more detail in the following sections.
Figure 4-1: Layout of the tangible map, including both the physical and software components.
4.3.1 Physical Layout
The tangible map’s touch-sensitive display surface consists of two LCD displays over-laid with a single capacitive touch input layer. 3D printed campus buildings sit atop this touch screen. Each building is fitted with a touch point containing dual 3mm diameter aluminum rods connected to a 6mm circular piece of aluminum foil. When touched, the rods trigger a change in capacitive charge that registers as a finger press on the capacitive touch input layer.
A support structure [11] is necessary in the process of 3D printing structures that include overhangs. We created a variation of the level-set method [6] in response to this need. For downward facing surfaces below a failure angle, we force the surface downward and inward towards an averaged near point intersection of the original 3D printed structure. This results in a structure appropriate for 3D printing which requires no external scaffolding or post-printing machining and cleanup, as seen in Figure 4-2.
4.3.2 Software Layout
The software for the tangible map’s screen is built using JavaScript for the interactive touch screen site, and Swift for the tablet application. The main website is a Node.js app with MongoDB as the data source.
Figure 4-2: left: Schematic diagram of 3D printed structures designed to support overhangs. Full building structure is represented in gray and support structures are highlighted in green. center: Full building with support structures in place. right: Final 3D printed building created using support structures.
to direct user attention to the appropriate locations in the installation. Directing user attention is an important but difficult task [8, 12], and we use animations to indicate to the user when information is changing and where on the tangible map to find relevant information. Pulses of light sweep across the display in order to provide visual feedback immediately after the user selects a component on the screen and to redirect the user’s line of vision to the portion of the screen displaying information about the selected component.
Chapter 5
User Studies
In this chapter, we discuss the two user studies carried out to evaluate the effectiveness and efficiency of the Atlas chatbot and tangible map. We first give an overview of the methodology and motivations of each user study, followed by an explanation of the evaluation techniques we use for each specific medium. We then give the results of each study and provide an in-depth discussion of these results.
5.1 Methodology
We conducted one user study per medium, with 7 participants in the chatbot study and 11 participants in the tangible map study. All but one of the participants were current MIT students ranging across departments and years of study, with the final participant being an MIT lab affiliate. This group is largely consistent with that of the projected user population of both mediums.
For each session, a moderator introduced the participant to the chatbot or tangible map for the first time, giving a short description of its purpose. The moderator then asked the participant to complete a few tasks involving either the medium of study or the participant’s currently favored form of information retrieval. The time it took for each participant to complete the task was recorded for efficiency analysis. After completing all tasks, the participant was asked to fill out a survey about the chatbot or tangible map based on their experience.
The tasks for both mediums rely on the classes, directions, events, and people collections within the database described in Section 2.2. We evaluate our two mediums against a baseline of the existing applications our participants currently use to obtain this information.
The tasks chosen for the chatbot user study were selected to include the four collections listed above, with specific tasks chosen for the sake of covering a spectrum of tasks representative of what users would use the chatbot for post-launch. We kept the prompts for each task simple and short, in order to refrain from instructing the user on the exact wording to use in their message to the chatbot as much as possible. This allows us to test the NLU back-end of the bot. Once the specific tasks were chosen (tasks listed in Table 5.1), we split these tasks between mobile and desktop, as the chatbot is accessible through either device type. Using both mobile and desktop in the user study allows us to test whether the chatbot is efficient across both, one, or neither device types.
The majority of tasks chosen for the tangible map user study were selected to take advantage of the map’s 3D structure (tasks listed in Table 5.3). The collections used in the tangible map user study are the same as those used in the chatbot user study, with the addition of the shuttle collection for the purpose of testing whether users could easily identify how to use the 3D map in conjunction with the information panel.
5.2 Evaluation Techniques
For chatbot evaluation, Abushawar and Atwell [2] propose evaluating human—computer dialogue systems based on three criteria:
1. Whether the system achieved the task 2. The time taken to achieve the task 3. User satisfaction
(1) and (2) are evaluated through our reports on answer correctness and response times shown in Table 5.1. (3) is evaluated through user survey responses, shown in Table 5.2.
Alt, et al. provide a set of guidelines for evaluating public displays [3]. They state that in HCI, controlled lab studies are often carried out, which remove many of the real-world factors present in a public display. For this reason, we conducted our tangible map user study in the map’s final installation site. The participants carried out the tasks asked of them while dozens of other MIT affiliates walked and talked around them, as would be the case if the participant were interacting with the map outside of the user study. Performing this study in real-world conditions results in insights applicable to an authentic public display.
5.3 Results
In this section, we present both the chatbot user study results, as well as the tangible map user study results. Short discussions of the results of both studies will be included in the relevant subsections, with an overall discussion comparing the results of the two studies in Section 5.4.
5.3.1 Chatbot Results
In the chatbot study, the participants were asked to use an other means (not the chatbot) of completing each of the five given tasks (tasks listed in Table 5.1). The medium the majority of participants chose to complete each task was their browser’s default search engine (consistent across the 7 participants, this search engine was Google). From there, the participants would either see the answer immediately or explore relevant links until the answer was found. One exception was a participant who, for the three mobile tasks, asked Google Voice for each of the answers rather than typing their query into the search engine.
Table 5.1 shows the results of the chatbot user study’s timed tasks in the form of average times and standard deviation of these times for each medium. The chatbot’s
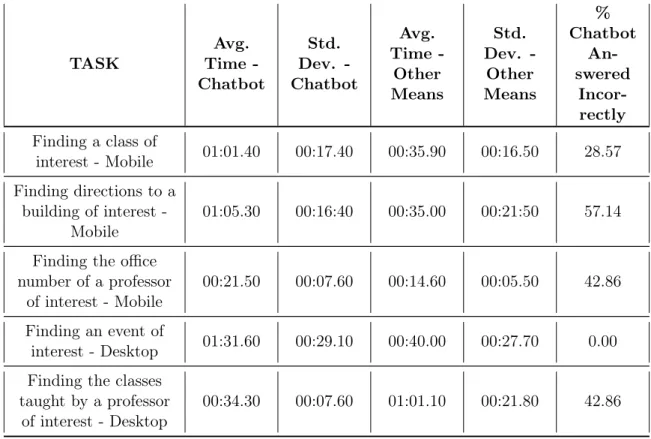
Table 5.1: Chatbot timed tasks results. All times in Minute:Second.millisecond for-mat. Both the average times and standard deviations are shown for each task, with these statistics excluding runs where the chatbot answered the user’s query incor-rectly. As the chatbot’s NLU was not perfect at the time of testing, the last column displays what percentage of questions were answered incorrectly for each task.
TASK Avg. Time -Chatbot Std. Dev. -Chatbot Avg. Time -Other Means Std. Dev. -Other Means % Chatbot An-swered Incor-rectly Finding a class of interest - Mobile 01:01.40 00:17.40 00:35.90 00:16.50 28.57 Finding directions to a building of interest -Mobile 01:05.30 00:16:40 00:35.00 00:21:50 57.14
Finding the office number of a professor
of interest - Mobile 00:21.50 00:07.60 00:14.60 00:05.50 42.86
Finding an event of
interest - Desktop 01:31.60 00:29.10 00:40.00 00:27.70 0.00
Finding the classes taught by a professor
of interest - Desktop 00:34.30 00:07.60 01:01.10 00:21.80 42.86
NLU was not perfect at the time of testing, which resulted in a number of off-topic or incorrect answers. The last column in Table 5.1 displays what percentage of questions were answered incorrectly for each task. Incorrect answers were excluded from the average and standard deviation columns in Table 5.1.
As we can see, the average time to complete all mobile tasks via the chatbot took about twice as much time as they did via the participants’ default search engines. Finding an event on desktop took about 2.25 x the time using the chatbot. Finding a class taught by a professor of interest took about half as much time via the chatbot. Users responded unanimously that speed affected their experience with the chat-bot, as seen in the survey responses in Table 5.2. Participants were happiest with their chatbot experience during tasks that required only quick, simple conversations,
Table 5.2: Chatbot survey results. Users answered these survey questions after com-pleting the tasks listed in Table 5.1.
STATEMENT % Strongly Agree / Agree % Indif-ferent % Strongly Disagree / Disagree The chatbot’s speed negatively affected my
experience. 71.43 28.57 0.00
Without the chatbot, I can easily discover
classes of interest to me. 85.71 14.29 0.00
I would use the chatbot for classes were it
publicly available. 42.86 57.14 0.00
Without the chatbot, I can easily discover
relevant events on campus. 71.43 14.29 14.29
I would use the chatbot for events were it
publicly available. 71.43 14.29 14.29
Without the chatbot, I can easily find useful
directions to places on campus. 85.71 0.00 14.29
I would use the chatbot for directions were it
publicly available. 0.00 28.57 71.43
I would use the chatbot for information on
staff were it publicly available. 57.14 42.86 0.00
rather than engaging in a back-and-forth, multi-turn conversation with the chatbot. This reflects the participants’ survey responses in Table 5.2, where they were more likely to use the chatbot for information on staff (single question-answer conversa-tion in the tasks) than for direcconversa-tions (after locating where the participant wanted to go, the chatbot asks them to either send their current location and a confirmation message, or the number of the building they are currently in/closest to).
While the times in Table 5.1 in general tell us that the chatbot cannot relay the participants’ answers as quickly as a search engine, these results are highly dependent on the tasks they correspond to. One could imagine a more complicated task that would require visits to multiple different websites and would be expedited by a chatbot
Table 5.3: Tangible map timed tasks results. All times in Minute:Second.millisecond format. Both the average times and standard deviations are shown for each task.
TASK (MM:SS.ms)AVG TIME (MM:SS.ms)STD DEV
Select a Building 00:05.556 00:02.744
Find a Shuttle 00:26.000 00:36.120
Find a Person of Interest 00:11.625 00:07.836
Get Directions on Phone via Tangible Map 01:07.000 00:36.313 Get Directions on Phone via existing Map App 00:33.000 00:16.416
conversation. In addition, as discussed in Section 3.3, as additional collections and questions were added to the chatbot system, response time greatly increased. With additional computational power, which could be achieved by using a different existing platform for our NLU needs or building a system from scratch, the chatbot’s response time would decrease, decreasing the time for participants to complete the given tasks. Often, when the chatbot would relay an answer, and sometimes even if that an-swer was incorrect, the participant would ask if they could try out a few other phrases on the bot. Since the chatbot was a novel interface for retrieving MIT-related infor-mation, participants were curious about the bot’s abilities, and eager to figure out what questions the chatbot could or could not answer. Participants seemed to enjoy interacting with the chatbot, although this initial patience and exploration would likely turn to frustration if the bot were to be deployed and continued answering a subset of questions incorrectly after weeks of communication with a user.
5.3.2 Tangible Map Results
Table 5.3 shows the results of the tangible map user study’s timed tasks in the form of average times for each task. As we can see in the last two rows, getting directions onto a phone via the tangible map took twice as long as getting directions onto a phone via the participant’s existing map application. Still, completing this task via the tangible map took only about a minute on average, and the other tangible map
tasks on average each took fewer than 30 seconds to complete.
Retrieving directions via the tangible map took so much more time largely due to the fact that the tangible map produces a QR code and a url to direct the participant to the correct directions, but entering this information in the forms given is a time-intensive task. Since no participants had a QR code scanning app, they had to manually type in the url into their phones’ browsers. Given a shorter url to enter or another means of sending the information to their phone, the participants would have undoubtedly completed this task in a fraction of the time.
When participants were left to explore the map without specific tasks to complete, they interacted with the map at a much higher rate (i.e. more touches to the buildings or screens per minute). Participants touched buildings they were not familiar with in order to learn basic information such as the building’s name, and also touched buildings they were very familiar with (i.e. their dorms, the main buildings for their departments) in order to verify information they already knew.
We can see in Table 5.4 that on all accounts, there is an increase in the ease with which participants can find information when using the tangible map compared to existing mediums. This shows the benefits of a 3D, tangible map, although it is difficult to say with confidence what component(s) of the tangible map contributed most to this positive feedback.
When asked in a free-response survey question what participants liked about the map, responding participants all mentioned the tangible aspect of the display. Partic-ipants responded so favorably to the existing interactive tangible components of the map that a few explored the map so extensively that they began to expect responsive features where they did not exist.
5.4 Discussion
In this section, we discuss a few seemingly conflicting responses in the time and survey tables for both mediums. We then compare the chatbot user study results to the tangible map user study results, and discuss the consequences of these comparisons
All interactions with the Atlas chatbot took longer to complete than the partici-pants’ other means with the exception of finding the classes taught by a professor of interest. However, even with the delayed response times of the chatbot in the events and classes tasks, 71.43% of participants responded that they would use the chatbot for events and 42.86% said they would use the chatbot for classes were it publicly available. In addition, 71.43% of participants said the chatbot’s speed negatively af-fected their experience and the chatbot answered incorrectly in 34.286% of all tasks. These two pieces of information together tell us that although participants did not appreciate the bot’s slow response time and the bot would not answer correctly about a third of the time, participants were still interested in the bot enough to say that they would use the bot were it publicly available.
This means that although the Atlas chatbot performed poorly on evaluation cri-teria (1) and (2) from Section 5.2: whether the system achieved the task (frequency of response errors) and the time taken to achieve the task, the bot still managed to perform relatively well on criterion (3): user satisfaction. This positive performance in criterion (3) despite negative performance in criteria (1) and (2) may be a result of the convenience of having a single location to query multiple collections of data, even when that data arrives slowly and sometimes incorrectly. It could also be a result of the novelty of retrieving information through a natural language interface. Further studies must be done before we can say with certainty what trait or combination of traits leads to this result.
The tangible map took twice as long as existing map applications for the get directions on your phone task. But, as discussed in Section 5.3.2, this is largely due to the choice of QR code implentation and participants having to manually type in a url on their mobile devices. The slow time is not the result of a lag in the map’s response time, nor the result of a software error.
The user survey results show that the percentage of participants who found finding information on a building, making use of the shuttle system, and discovering events an easy task increased by 27.27%, 18.18%, and 9.09% respectively when first asked about the ease of each task without the tangible map and then the ease of each task with
the tangible map. From the survey results, we can see that the tangible map makes these tasks easier, if only by a marginal amount. However, the map is stationary and can only be accessed in E17, which means it cannot provide this benefit to students and faculty most hours of their normal work week.
Two additional interesting survey results are the 81.82% of participants who agreed or strongly agreed that It is easier to find a building by touch that by looking at a 2D map and the 72.72% of participants who agreed or strongly agreed that Visualizations of art / bike racks are useful for locating resources they might not have been aware of. These two survey questions address the additional features the tangible map possesses that differentiate it from a static 2D map.
Based on our user studies, it appears that the Atlas chatbot is more helpful in exploring domains users already know a good amount about. Users can go more in-depth on what classes are available and information on these classes or find events on different topics of interest with multiple similar queries sent to the bot. Contrast-ingly, it also seems as though the tangible map is more helpful in exploring domains users might not give much thought to, but are present in their daily lives on campus nonetheless. Users can increase their breadth of knowledge on the campus by finding bike racks that not many people know about or learning about the art installations that they see every day but have not taken the time to stop and appreciate.
Since the Atlas chatbot was slower than Google for almost every task, for future implementations, it might be beneficial to instead make quick-responding, specialized bots that are limited in the number of collections queried. The Atlas chatbot would also be more useful to users if the chatbot’s information was not so easily found through public search engines. Perhaps a chatbot that places private info behind a security wall or a chatbot that accesses information for an organization not as public as MIT (or a small subset of data within MIT that would otherwise be hard to find) would further increase user satisfaction.
The tangible map led to a significant amount of user engagement. Users responded well to the animations beneath the buildings, and an increase in animations that appear in response to user interaction would likely further increase engagement, as
users would sometimes not see that their actions caused a change on the information panel.
Table 5.4: Tangible map survey results. Users answered these survey questions after completing the tasks listed in Table 5.3.
STATEMENT % Strongly Agree / Agree % Indif-ferent % Strongly Disagree / Disagree It is simple to find information about a
building on campus (without the Tangible
Map). 54.55 18.18 27.27
It is simple to find information about a
building on the map. 81.82 18.18 0.00
It was easier to find a building by touch than
by looking at a two-dimensional map. 81.82 9.09 9.09
I can easily make use of the shuttle system
(without the Tangible Map). 27.27 36.36 36.36
Using the Tangible Map, I can more easily
make use of the shuttle system. 45.45 45.45 9.09
I can easily discover relevant events on
campus (without the Tangible Map). 54.55 18.18 27.27
Using the Tangible Map, I can more easily
discover relevant events on campus. 63.64 18.18 18.18
It was easy to find and use the visualizations
of Art/Bike Racks on campus. 63.64 27.27 9.09
Visualizations of Art/Bike Racks are useful for locating resources I might not have been
aware of. 72.73 18.18 9.09
Chapter 6
Conclusion
From our specific study, we have determined that in the domain of MIT campus-wide information, it is best to move forward by adding on to what makes the tangible map stand out in terms of user engagement. This includes additional visual information, new interactive touchpoints, and more animations. We have also decided to stop work on the Atlas chatbot. A chatbot may be better suited for a more niche MIT sub-domain that allows greater personalization for each user.
6.1 Key Findings
The key findings from each stage of our study (design, implementation, and user studies) are outlined in this section.
6.1.1 Design Process
Our initial design goals for both mediums were vague in nature. For example, we wanted to increase exploration, but did not specify how we would measure this goal. Exploration could be measured in how many different domains users retrieved infor-mation from, how deep into one aspect of data users delved, how many times users touched the tangible map, or how many messages they sent to the chatbot. Our main insight from the design stage is that in order to properly evaluate your goals, start
the design process with an extremely specific design goal in mind.
6.1.2 Implementation
As discussed at the end of Section 3.3, we only started to observe the drawbacks of adding new collections and answerable questions to the chatbot’s repetoire when four collections had been implemented. This late realization occurred because we did not user test the chatbot after each new collection was added. If we had caught onto this occurrence sooner, we would have been able to course correct, and the chatbot’s response time during user tests would have been much faster. Thus, our main insight from the implementation stage is that at every step of implementation, it is wise to add some form of user testing (even informal user testing with just one or two testers helps immensely) in order to understand what is working and what is not without committing too much energy to an idea that has not yet been proven viable by users.
6.1.3 User Studies
A very specific insight we gained from our user studies was that Q&A chatbots are best for domains where the information being requested is not easily accessible via a search engine. When people can already easily obtain the information your chatbot is offering, the chatbot conversation becomes functionally redundant.
6.2 Contributions
In this thesis, we:
1. Designed a NLU based chatbot for a specific domain, as well as laid out a general structure for building future chatbots of the same nature.
2. Designed a tangible map, a unique tactile / digital representation of an urban setting with interactive touch-points.
4. Evaluated the chatbot’s and tangible map’s ability to perform information re-trieval tasks in a campus environment using both timed tasks and user surveys. 5. Shared insights learned from the design and implementation of the two mediums, as well as insights from our two user studies on the chatbot and tangible map. We also discuss the larger implications of our evaluation in the space of human-computer interaction.
We conclude that a chatbot is not suited to the task presented in this thesis and that it is more appropriate for use in domains in which the user cannot easily access the information provided by the bot, or in domains that require personalization. In addition, we conclude that a tangible map increases user engagement with the data described in this thesis, and is suited to the tasks we presented in Section 5.3.2.
Bibliography
[1] Sameera A. and Dr. John. Survey on chatbot design techniques in speech con-versation systems. International Journal of Advanced Computer Science and Applications, 6(7), 2015.
[2] Bayan AbuShawar and Eric Atwell. Usefulness, localizability, humanness, and language-benefit: additional evaluation criteria for natural language dialogue systems. International Journal of Speech Technology, 19(2):373–383, jan 2016. [3] Florian Alt, Stefan Schneegaß, Albrecht Schmidt, Jörg Müller, and Nemanja
Memarovic. How to evaluate public displays. In Proceedings of the 2012 Inter-national Symposium on Pervasive Displays, PerDis ’12, pages 17:1–17:6, New York, NY, USA, 2012. ACM.
[4] Martin Beveridge and John Fox. Automatic generation of spoken dialogue from medical plans and ontologies. Journal of Biomedical Informatics, 39(5):482–499, oct 2006.
[5] Wolfgang Büschel, Ulrike Kister, Mathias Frisch, and Raimund Dachselt. T4 -transparent and translucent tangibles on tabletops. In Proceedings of the 2014 International Working Conference on Advanced Visual Interfaces, AVI ’14, pages 81–88, New York, NY, USA, 2014. ACM.
[6] Simone Cacace, Emiliano Cristiani, and Leonardo Rocchi. A level set based method for fixing overhangs in 3d printing, 2014.
[7] Sandy Claes and Andrew Vande Moere. The role of tangible interaction in exploring information on public visualization displays. In Proceedings of the 4th International Symposium on Pervasive Displays, PerDis ’15. ACM Press, 2015. [8] Jorgos Coenen, Niels Wouters, and Andrew Vande Moere. Synchronized
wayfind-ing on multiple consecutively situated public displays. In Proceedwayfind-ings of the 5th ACM International Symposium on Pervasive Displays, PerDis ’16, pages 182– 196, New York, NY, USA, 2016. ACM.
[9] David DeVault, Ron Artstein, Grace Benn, Teresa Dey, Ed Fast, Alesia Gainer, Kallirroi Georgila, Jon Gratch, Arno Hartholt, Margaux Lhommet, Gale Lucas, Stacy Marsella, Fabrizio Morbini, Angela Nazarian, Stefan Scherer, Giota Stra-tou, Apar Suri, David Traum, Rachel Wood, Yuyu Xu, Albert Rizzo, and Louis-Philippe Morency. Simsensei kiosk: A virtual human interviewer for healthcare