Characterizing the Landscape of Aminoacyl-tRNA Synthetase Protein
Production in Bacillus subtilis
By
Darren John Parker B.S. Biochemistry
University of Illinois, Urbana-Champaign, 2014 Submitted to the Department of Biology
In partial fulfillment of the requirements for the degree of DOCTOR OF PHILOSOPHY IN BIOLOGY
at the
MASSACHUSETTS INSTITUTE OF TECHNOLOGY September 2020
2020 Darren John Parker. All rights reserved.
The author hereby grants MIT permission to reproduce and to distribute publicly paper and electronic copies of this thesis document in whole or in part in any medium known or hereafter
created.
Signature of the Author: __________________________________________________________ Darren J. Parker Department of Biology June 19, 2020
Certified by: ___________________________________________________________________ Gene-Wei Li Associate Professor of Biology Thesis Supervisor
Accepted by: ___________________________________________________________________ Stephen Bell Uncas and Helen Whitaker Professor of Biology Investigator, Howard Hughes Medical Institute Co-Director, Biology Graduate Committee
Characterizing the Landscape of Aminoacyl-tRNA Synthetase Protein
Production in Bacillus subtilis
By
Darren John Parker
Submitted to the Department of Biology on June 19, 2020
in partial fulfillment of the requirements for the Degree of Doctor of Philosophy in Biology
Abstract
The phenotype of a cell is a consequence of both the identity of the genes in the genome and the magnitude of their expression into proteins. While the biochemical function of many proteins has been uncovered, for most it is unclear how important native protein abundances are for cell fitness. Furthermore, linking changes in abundances with downstream effects on enzymatic output, pathway function, and ultimately cell fitness is unexplored in nearly all cases. Here I use a model enzyme family, the aminoacyl tRNA synthetases (aaRS), to explore how sensitive Bacillus subtilis are to changes in aaRS production from the molecular to phenotypic level. This culmination of protein levels, functional output, and fitness, leads to a complete “fitness
landscape” for the aaRS proteins and provides a framework for future study in quantitative biology.
In Chapter I, I outline the conceptual questions explored in this thesis, review the current understandings of bacterial translation and aaRS function, and note the various regulatory
strategies bacteria utilize to adapt to perturbations. In Chapter II, I find that the aaRS proteins are produced to optimize the growth rate of cells despite the presence of uncharged tRNAs. These native levels are positioned near a ‘fitness cliff’ as the underlying molecular processes of tRNA charging, translation, and regulation, are sensitive to reductions but not increases in synthetase production. In Chapter III, I complete the characterization of the aaRS fitness landscapes by exploring the source of the fitness defects of aaRS overproduction. In Chapter IV, I present a novel protocol for RNA-seq library preparation to reduce the cost and time associated with generating transcriptomic datasets. In Chapter V, using the aforementioned protocol, I characterize the transcriptomes of over 70 strains within the Escherichia coli single gene knockout collection. With the help of a colleague we find that strong selective pressures to induce genes involved in motility leads to a large amount of transcriptome heterogeneity within the collection. Finally, in Chapter VI, I discuss the results of my work, setting up future
directions within the context of gene expression, bacterial physiology, and beyond.
Thesis Supervisor: Gene-Wei Li Title: Associate Professor of Biology
Acknowledgements
There are many people to thank for my being at this point…the common image of a scientist toiling away in a dark room, annoyed by any minor disturbance could not be farther from the truth.
First and foremost, I have to thank Gene. I have yet to meet someone so intellectually capable yet so completely willing and eager to listen to the opinions of others. I always felt heard and respected, easily the two most important qualities in a mentor. I also admire the calming presence and patience he provides to myself and the lab.
I would also like to majorly thank my undergraduate advisor, Auinash Kalsotra for inspiring me to continue on a scientific path. I was not even anticipating going to graduate school starting my last year of undergrad, but his enthusiasm for science, warm heart, and encouragement led me to aim high and continue to follow what I found interesting.
I was incredibly fortunate to work with a great group of people during my last five years. First, I have to thank my long-time bay-mate and first colleague Jean-Benoît. Easily the smartest and hardest working person I have met at MIT, our numerous conversations, scientific or otherwise, were key in my development. I must also thank other members of the “founding core” of the Li Lab: Aaron, Grace, James, Lydia and Cassandra. Everyone brought a unique perspective to the lab, and I cherish the fact that I always felt comfortable discussing all elements of our work together. We had a lot of fun over the years, whether at Lab retreats, Halloween parties, or just coming up with shenanigans for the next event, and I will greatly miss those moments.
There are many others within the MIT community I would like to acknowledge. Especially important to me was the culture of the 2nd floor of 68. Thanks to the awesome members especially in the Burge and Calo labs, I can safely say the 2nd floor has the best mix of high achieving work, fun people, and good times. I would never have expected to play beer pong against MIT professors mere feet from lab, but that happened and it was awesome. Also, as much as we joke about Bertucci’s I also really enjoyed RNA journal club which was, let’s be honest, another 2nd floor event. I hope that culture persists for years to come.
I also would like to give a big thanks to Alan and members of the Grossman lab. The close interaction both in group meeting and outside was a huge part in setting the Li lab on its current course. I am sure I became annoying at some point, as I was coming up to ask questions at least once a day early on, so thank you all for your help. I also owe Alan my deepest gratitude for his excellent, frank feedback about science, careers, and life in lab.
Life is not just work however, and I have to thank those that were part of the journey. First and foremost are those from my first true “home” 25 Cahvah (RIP) and 79 Putty; Nader, Sam,
Charlie, Leanne and Jason. Whether it was Saturday morning cartoons, scientific discussions (i.e. gossip) or late night political debates, our apartment will forever be near to my heart. Second is my friends and members of various groups including DNA/Ribosome FC, the Ski trip squad, and the Microbios that semi-adopted me.
I was incredibly fortunate to have another group of friends to talk to nearly every day despite being 1,000 miles away. The Mofongo boys; Prath, Colin, Ross, and Ben, and Scott’s Tots; Jaydeep and Tania were all incredibly supportive of my journey and I would have gone crazy without them. To them I say, yes I am finally graduating college!
Finally, I would be nowhere without my loving family. My mom, Jamie, and my dad, John have been extremely supportive throughout the entire process and gave the confidence to do whatever I wanted. My brothers, Adam, Lucas, and Jeremy were essential in recharging on my breaks and I am extremely grateful for all the fun we have had, whether in worlds real or virtual. I would also like to acknowledge and thank my Nanny and Papa for their absolute love and
encouragement over the years. Having the feeling that if things aren’t going well I can turn to a loving and supportive environment is not something to take for granted. They are all equal members in the production of this thesis and completion of my Ph.D.
Table of Contents
Abstract ...3
Acknowledgements ...4
Table of Contents ...6
Figure Index ...8
Chapter I: Introduction ...11
Introduction to Quantitative Biology of Gene Expression ... 12
High Abundance of Translation Machinery... 17
The Translation Cycle... 18
Elongation Kinetics & Codon Usage... 21
Expression Stoichiometry of Translation Machinery ... 24
Consequences of Translation Elongation Rate Reduction ... 25
Aminoacyl-tRNA Synthetase Structure and Function... 27
Biochemistry, Kinetics, and Inhibitors of aaRS Enzymes ... 31
aaRS Gene Regulation ... 34
(p)ppGpp and the Stringent Response ... 37
References ... 43
Chapter II: Growth Optimized Aminoacyl-tRNA Synthetase Levels Prevent
Maximal tRNA Charging ...58
Abstract ... 59
Introduction ... 60
Results ... 62
Discussion ... 77
Supplemental Figures & Legends ... 82
Acknowledgements ... 90
Methods ... 91
References ... 104
Chapter III: Characterizing the Origin of the Fitness Defect due to
Overproduction of the Aminoacyl-tRNA Synthetases in Bacillus Subtilis .111
Abstract ... 112 Introduction ... 113 Results ... 116 Discussion ... 126 Acknowledgements ... 129 Methods ... 130 References ... 133Chapter IV: Development of a Highly-multiplexed RNA-seq Protocol ...136
Abstract ... 137 Introduction ... 138 Results ... 139 Discussion ... 145 Acknowledgements ... 146 Methods ... 147 References ... 153Chapter V: Rapid Accumulation of Motility-Activating Mutations in Resting
Liquid Culture of Escherichia coli ...156
Abstract ... 157 Introduction ... 158 Results ... 160 Discussion ... 174 Acknowledgements ... 178 Methods ... 179 References ... 184
Chapter VI: Conclusion and Future Directions ...187
Summary ... 188
The Future of Fitness Landscapes ... 189
Fitness Landscapes of Translational Machinery ... 190
Future Directions of the Translational Cycle and Regulation... 193
Concluding Remarks ... 196
References ... 197
Figure & Table Index
Chapter 1Figure 1. Theoretical fitness landscapes ... 14
Figure 2. Proteome distribution of model microorganisms ... 18
Figure 3. Model of the translation elongation cycle ... 20
Figure 4. Catalytic mechanism of aminoacylation reaction by aaRS enzymes ... 28
Table 1. Aminoacyl-tRNA synthetase enzyme form & regulation... 31
Figure 5. T box riboswitch regulation in Firmicutes ... 37
Figure 6. Mechanism of stringent response activation... 38
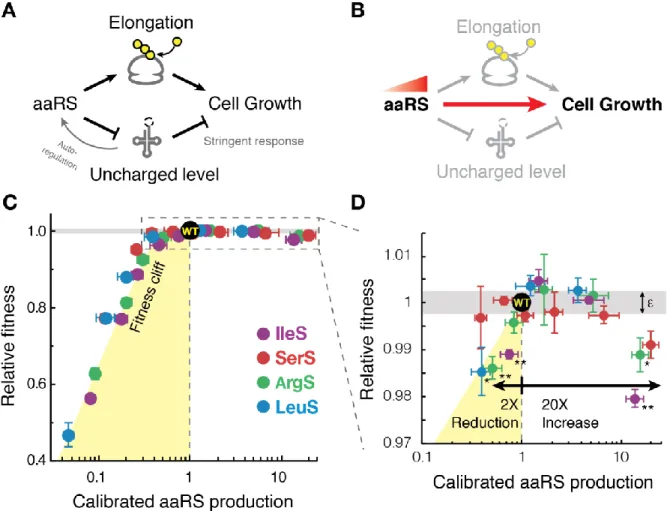
Chapter 2 Figure 1. Fitness landscape of tRNA synthetase production shows growth optimization near a fitness cliff ... 65
Figure 2. aaRS overproduction reduces uncharged tRNA levels ... 67
Figure 3. Translation elongation kinetics change only with aaRS underproduction ... 70
Figure 4. Removal of the stringent response negatively impacts cell growth during aaRS underproduction ... 73
Figure 5. Stoichiometry and kinetics of translation machinery are perturbed without stringent response ... 76
Figure 6. An integrated view of growth optimization for aaRSs ... 79
Figure S1. Determination of the fitness landscape of aaRS production ... 82
Figure S2. T box reporter response to aaRS production changes ... 83
Figure S3. Translation elongation kinetics slowed with underproduction but not increased with overproduction of aaRS ... 84
Figure S4. Confirmation that the stringent response is activated and beneficial during aaRS underproduction ... 86
Figure S5. Stringent response reduces translation defects during aaRS underproduction .... 88
Figure S6. Comparison of aaRS quantification methods ... 89
Chapter 3 Figure 1. Model of the sources leading to fitness defects upon aaRS overproduction ... 115
Figure 2. Schematic of aaRS and fluorescent protein variants created ... 118
Figure 3. Effects on aaRS expression and tRNA charging of variant overproduction ... 121
Figure 4. Effects on fitness of aaRS and FP variant overproduction ... 123
Figure 5. tRNA charging and gene expression changes of aaRS overproduction ... 125
Supplemental Table 1. DNA oligos used in this chapter ... 132
Chapter 4 Figure 1. Comparison of library preparation methods ... 141
Chapter 5
Figure 1. Transcriptome remodeling among Keio strains ... 161
Figure 2. Confirmation of motility gene expression using a GFP reporter driven by the fliC promoter ... 163
Figure 3. Correlation between motility gene activation and swimming phenotype ... 165
Figure 4. Absence of motility activation after P1 transduction of single-gene deletions ... 167
Figure 5. Diverse secondary mutations responsible for motility activation in Keio collection ... 170
Figure 6. Rapid accumulation of motility-activating mutations in resting liquid culture ... 173
Figure 7. Motility gene activation in strains deficient for aerotaxis and chemotaxis ... 176
Chapter I
Introduction to Quantitative Biology of Gene Expression
The control of gene expression is foundational to organismal fitness and adaptability. Although each cell is bounded by the genes encoded in its DNA, it is the differential production of these genes into proteins that allows cells to live and adapt. Even in the simplest bacterial genomes, of the roughly four thousand unique protein coding genes encoded in DNA, not all are expressed into protein at any given time. Furthermore, the amplification steps of transcription and translation leads to protein copy numbers spanning over seven orders of magnitude (Li et al., 2014). The vast combinatorial space of possibilities makes the culmination of all proteins, the proteome, a much more complex entity than a simple genome would suggest, and allows for organisms to adapt to multiple environments and states. However, resources to produce proteins are finite and competition in nature is fierce. Especially within the prokaryotic world, organisms that can better use the resources at hand can grow faster and outcompete their neighbor as all steps of the central dogma have associated costs (Kafri et al., 2016). Therefore, it is important for the cell to make the best use of the resources at hand and only produce genes that are needed within the specific context. As the identity and biochemical function of progressively more proteins is elucidated, a grand challenge in biology remains understanding the driving forces that shape cellular proteomes. This broad problem can be broken down into specific questions at all levels of biology, from molecular to the organism scale. For instance, are there specific design principles between cellular components that leads to optimal resource allocation and an
optimized proteome? For individual proteins, are native levels optimized for growth? What are the effects on fitness and pathway function of deviating from the protein levels observed? Consequently, can studying the impact of fitness on varying individual proteins lead to better understanding of the molecular pathways in which they reside? The aim of my thesis work is to
begin answering these questions and pave the way for new approaches in linking protein expression, function, and organismal fitness.
Attempting to understand the relationship between a quantity of a physiological property, such as the expression level of an individual protein, and its molecular causation on organismal fitness behind the observed value has been a major area of research for at least 30 years
(Diamond and Hammond, 1992). “Quantitative evolutionary design”, was coined as a term for studying how robust biological systems are to changes in system requirements (Diamond, 2002; Salvador and Savageau, 2003). The major quantitative unit assessed within this framework, the “safety factor”, is defined as the ratio of the total capacity of a biological process or enzyme to its need. A classic example is the “safety factor” of leg bones in animals, a metric of how heavy an animal can become before the leg bones can no longer provide support (Alexander, 1984; Biewener, 1982; 1989). This idea can be applied to the study of individual enzymes, where the term is re-defined as the ratio of the maximal reaction rate, a function of the enzymes turnover rate and protein copy number, to the required reaction rate during a given condition. In this framework, a safety factor of 1 indicates that the enzyme is operating at full capacity. This idea has been applied in the study of sugar transporters and metabolic enzymes within human cells (Salvador and Savageau, 2003; Weiss et al., 1998). The inverse of the safety factor, the “capacity utilization”, has also been used to intuitively indicate what fraction of the total enzymatic
capacity a reaction is operating at in a given condition (Davidi and Milo, 2017). Although important, these metrics are incomplete in relating protein expression and cell fitness, since they give no information on the magnitude or consequences of perturbing native expression. A more holistic approach is to determine how cell fitness is affected over the entire range of possible expression. This cumulative metric, which I will herein refer to as a “fitness landscape”, is a
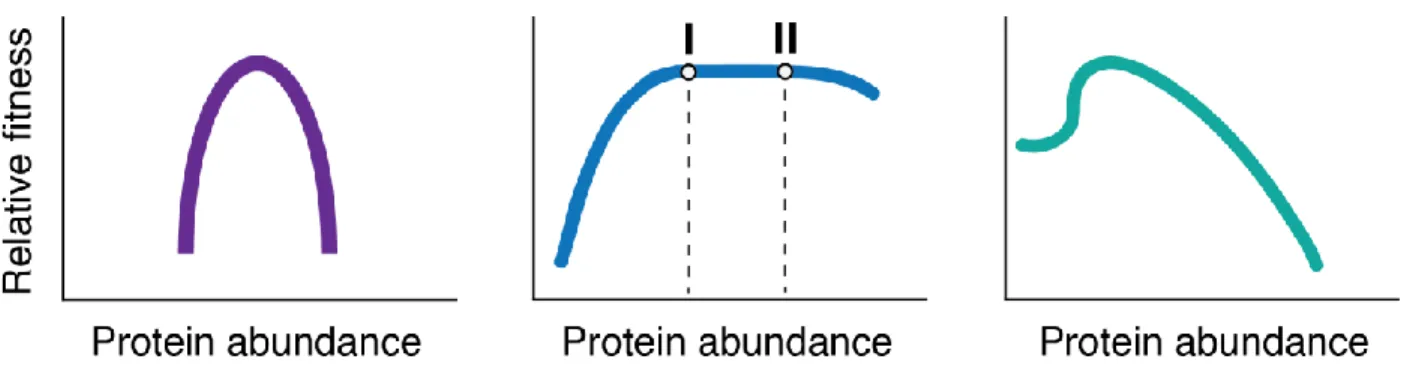
powerful way to visualize and quantify the effect of a proteins production on cellular fitness (Figure 1). Fitness landscapes provide an abundance of important information. For example, by determining the placement of native levels, the safety factor/capacity utilization can easily be visualized and calculated. The landscapes can also inform on potential protein-specific toxicities and limitations on cellular fitness. Finally, they provide an important conceptual framework that provide a jumping off point for further investigation into the underlying molecular mechanisms that unify protein abundance and function with pathway and organism fitness.
Figure 1. Theoretical fitness landscapes. Three potential fitness landscapes for different genes. Fitness landscapes are defined as the relationship between protein abundance and relative fitness. For all landscapes, it is essential to define the location of native protein levels (I vs. II) to
determine production optimality and the safety factor.
Despite the power of the above quantitative metrics, there are only a handful of studies fully mapping out fitness landscapes across any organism. One high-throughput study attempted to map the fitness landscapes for over ~100 genes across a 500-fold range of expression, in Saccharomyces cerevisiae (Keren et al., 2016). As expected, the powerful nature of the
landscapes uncovered multiple insights into the underlying biology. First, it uncovered that the fitness landscapes can take on multiple forms across different classes of genes, from genes that are highly sensitive to any expression changes from native levels to those without any change in fitness across the expression space and everything in between. Second, it was found that native
expression levels are not always perfectly optimized, as levels for enzymes involved in carbon metabolism were optimized for growth in glucose but not galactose. Unsurprisingly, it was also noted that these landscapes are not static and change depending on environment, further adding to their overall complexity. However, due to the high-throughput nature of the study, the molecular underpinnings that causally link protein expression and fitness were not further explored. This kind of detailed mapping fully integrating expression, function, and fitness has rarely been explored. Of the few examples characterized are the lac operon in E. coli (Dekel and Alon, 2005; Perfeito et al., 2011; Stoebel et al., 2009) and the LCB2 gene in yeast (Rest et al., 2013).
That is not to imply that a quantitative understanding of protein levels is otherwise lacking, as numerous other works highlight that many proteins may be expressed over their strict requirement. One high-throughput study using metabolite flux values and protein copy number predicted that most genes in E. coli metabolism operate well under full capacity (safety factor > 1) with a decrease in overall capacity utilization as the carbon source shifts from glucose to galactose (Davidi and Milo, 2017; O'Brien et al., 2016). However, this type of high-throughput approach generally requires knowledge of the catalytic rates of the enzymes being studied unless assumptions are made (Davidi et al., 2016). Given that most reported biochemical studies on enzyme action are generated in vitro, another caveat is whether these in vitro biochemical values should be applied to the in vivo setting. The more direct and straightforward approach, requires fine-tuned manipulation of enzyme levels. Luckily, advances in genetic tools, such as the
introduction of CRISPRi technology, have allowed for expression control at scale (Larson et al., 2013; Qi et al., 2013). Recent work profiling the fitness and phenotypes to CRISPRi
apparent effect on cell fitness for many essential genes (Peters et al., 2016). Given their essential nature, it is potentially surprising that a reduction of these genes does not cause a phenotype, with capacity utilizations less than one. However, given that the expression of many of the targeted genes is autoregulated, it is unclear whether the reported knockdown, measured with a non-regulated reporter, applies to all targets. Another recent study where the production of genes involved in amino acid metabolism was reduced in E. coli confirmed that these genes are in fact produced to a greater degree than their flux requirements (Sander et al., 2019). Overall, these studies seem to point towards enzyme overproduction as an overall strategy to ensure organismal fitness is maintained in the case of perturbation.
It is interesting to note that many of the best characterized examples above are genes that are highly conserved across bacteria and higher organisms. Whether or not enzyme
overproduction is also conserved remains to be uncovered. Recent work profiling proteome compositions in divergent bacterial species has demonstrated an exquisite conservation of in-pathway enzyme production (Lalanne et al., 2018). It would therefore be surprising if both protein levels and overproduction are conserved, as not all bacteria are faced with the same environmental and metabolic needs. Furthermore, protein production has costs, and since
ribosomes are working near saturation in fast growth conditions, for each enzyme produced over its need another could have been made instead (Dong et al., 1995). A strategy of overproduction seems feasible when applied to proteins that are required in relatively low quantities, but may be less so for proteins of high copy number. For example, achieving a safety factor of 2 for a protein required at 50 copies per cell would only require an extra 50 copies. However, a protein at 10,000 copies per cell would need another 10,000 synthesized for a similar benefit. Given work highlighting the stoichiometric production of components in multi-protein complexes within the
same operon it would seem rather unintuitive that the tight control exerted in this context
included excess in expression (Li et al., 2014). Therefore, it may not be the case that all enzymes are overproduced, and elucidating which enzymes or pathways adhere to this principle may depend on their inherent costs or importance to cell fitness.
High Abundance of Translation Machinery
The process of protein synthesis, translation, sits at the center of all life. Given its importance and requirement for cell growth, it is one of the most energy intensive processes in the cell estimating to account for up to ~50% of the energy consumption in fast growing bacteria and 30% in dividing mammalian cells (Buttgereit and Brand, 1995; Russell and Cook, 1995). The complex, three phase cycle, involves over one hundred unique proteins and RNAs that take up a major fraction of the total transcriptome and proteome. Ribosomes, the key
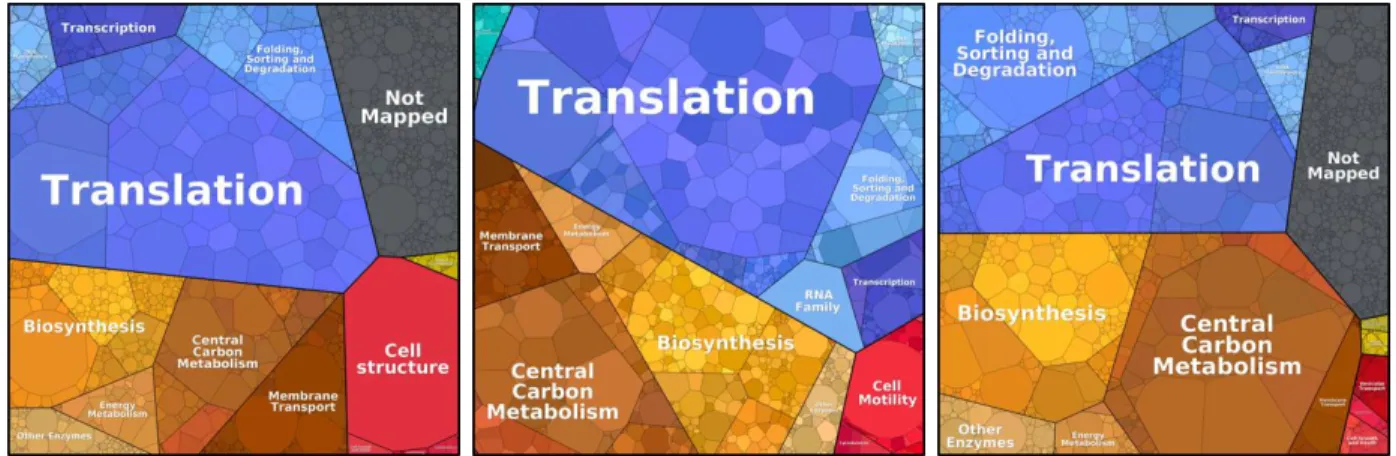
ribonucleoprotein complexes involved, can vary in copy number from the tens of thousands in bacteria to over three million in the average human cell (Gupta and Warner, 2014). The three pieces of RNA constituting the core components of the ribosome, the 5S, 16S, and 23S rRNA account for ~85% of the total steady state level of RNA in rapidly dividing bacterial cells (Bremer and Dennis, 2008). Furthermore, the molecular chaperones of amino acids, tRNAs, account for another ~13%, leaving protein coding mRNA to only ~2% (Bremer and Dennis, 2008). The suite of proteins involved in the full process including ribosomal proteins, initiation, elongation, and release factors, tRNA charging enzymes, modification factors, and others, take up a major fraction of the total proteome, accounting for 33%, 36%, and ~23% in fast growing Escherichia coli, Bacillus subtilis, and Saccharomyces cerevisiae respectively (Figure 2). Although the inner workings of the pathway have been relatively well characterized, and will be
reviewed below, how all the various molecular pieces come together to affect cell fitness is less understood. The large amount of investment into the process making proteins makes translation a prime candidate to study the quantitative questions posed previously. Specifically, what is the fitness landscapes of the factors involved in translation? Is there optimization involved in the production of the multitude of proteins involved? Additionally, what are the rate limiting steps in the process and when does limitation for one factor become rate limiting? Although work has indicated that ribosomes are key limiters of bacterial growth, are other proteins equally important? Finally, given that translation is a highly-controlled process at both the gene and pathway level, how does regulation play into linking perturbation with fitness?
Figure 2. Proteome distribution of model microorganisms. Proteome distribution of fast growing microorganisms. Ribosome profiling data for Escherichia coli, Bacillus subtilis, and Saccharomyces cerevisiae from (Lalanne et al., 2018; Li et al., 2014; Nagaraj et al., 2012) was obtained, processed, and analyzed into Proteomaps (Liebermeister et al., 2014).
The Translation Cycle
The translation of an mRNA into protein consists of three major phases: initiation, elongation, and termination. Although at their core, the three phases remain the same between bacteria and eukaryotes, the exact mechanisms and multitude of players involved differ. Each
step involves a plethora of factors and has unique forms of regulation and sensory systems to maintain proper coordination within and outside of the cycle.
Across life, translation initiation is thought be the most highly regulated and generally rate limiting step of the process (Laursen et al., 2005). In bacteria, canonical translation initiates by initial formation of the 30S preinitiation complex (IF1,2 & 3, the initiator tRNA
fMet-tRNAfmet, and the 30S small subunit) on the mRNA at the site of the initiator AUG start codon (Watson et al., 2014). Conformational changes occur after codon-anticodon binding between the initiator AUG and initiator tRNA, locking the more stable 30S initiation complex into place. Ejection of IF1 and IF3 then leads to the large 50S subunit to be associated with the preinitiation complex. After proper tRNA and ribosome placement, GTP bound to IF2 is hydrolyzed, leading to IF2 release, and final 70S initiation complex formation. With the fMet-tRNAfmet properly placed in the P-site, the ribosome is then ready for the next appropriate tRNA to enter the A-site and the elongation cycle to begin.
The longest phase of the cycle by total time involved is the second step, elongation. Elongation is a complex cycle involving five major steps (Figure 3). In the first step, decoding, the ribosomes have their P-site occupied by a tRNA conjugated with the nascent peptide and an empty A-site. Ternary complexes of aminoacylated tRNA, EF-Tu, and GTP are then sampled in the A-site to find tRNAs that match the presented triplet codon. Successful interactions of the aa-tRNA anti-codon with the mRNA codon leads to GTP hydrolysis by EF-Tu. The release of the free phosphate then triggers a rearrangement of EF-Tu and full accommodation of the aa-tRNA. Local rearrangements in 16S rRNA allow for a final sampling step to occur before EF-Tu release (Rodnina et al., 2017).
Figure 3. Model of the translation elongation cycle. Cartoon diagram of the major steps in the elongation cycle.
Above the site of codon-anticodon pairing, the peptidyl transferase center is ready to conjugate the nascent peptide with the incoming amino acid. The RNA residues in the 23S rRNA position the amino group on the amino acid of the incoming tRNA to perform a nucleophilic attack on the carbonyl carbon of the ester bond on the nascent peptidyl-tRNA covalently linking the nascent peptide to the A-site tRNA. Interestingly, even though the chemical identities of the 20 natural amino acids vary greatly, the ribosome is generally able to perform the peptidyl transfer reaction without limiting the cycle (Wohlgemuth et al., 2008). One exception however, is large stretches of sequential Proline codons (poly-Pro) (Buskirk and Green, 2013; Rajkovic and Ibba, 2017). In this case stalling of the ribosome does occur due to the unfavorable
orientation of proline reactive sites when multiple prolines are encountered in series (Ude et al., 2013). When these sequences are encountered, the stalling is rescued by an auxiliary protein, EF-P, that comes into the ribosome to orient the poly-Proline chain into a catalytically favorable orientation within the peptidyl transferase center (Huter et al., 2017).
Following the covalent linkage between the nascent chain and the incoming aa-tRNA the two ribosome subunits undergo a rotation relative to each other while shifting the positions of the P and A-site tRNA into hybrid states (P/E and A/P respectively) (Frank and Gonzalez, 2010). This process is aided by the translation factor G. Upon binding and hydrolysis of GTP on EF-G, the small subunit body rotates relative to the head maintaining a swiveled state, releasing tRNA anticodon:mRNA binding from the 16S rRNA (Belardinelli et al., 2016). Further
rearrangements of the small subunit allow the tRNAs to adopt new positions within the E and P-sites as EF-G releases the hydrolyzed phosphate. Next, as the small subunit head continues to move, the E-site and P-site tRNA are moved further apart as the E-site tRNA loses base pairing with the mRNA. This disassociation results in a return to the non-rotated state of the ribosome with a single tRNA with the nascent peptide chain attached in the P site, ready to begin the cycle anew.
The cycle of protein synthesis ends with the final step of termination. Briefly, when the ribosome encounters a stop codon instead of binding tRNA, binding of release factors occurs. In bacteria the two release factors RF1 and RF2 recognize UAG/UAA and UGA/UAA codons respectively to begin the process of hydrolyzing the native peptide from the tRNA. A third factor, RF3, is involved in disassociating RF1/2 from the ribosome. Finally, ribosome subunits and still bound P site tRNA are released through a process involving RRF and EF-G called ribosome recycling. The exact mechanisms by which termination and release occurs differs between prokaryotes and eukaryotes and is still an active area of work.
Despite the differences in mechanisms across kingdoms, measurements of the average translation elongation rate using a multitude of different in vitro and in vivo techniques have found to be remarkably constant rate across all organisms. In fast growing bacteria through human cell lines, a rate of 5-20 amino acids incorporated per second has been measured (Dai et al., 2016; Morisaki et al., 2016; Sørensen and Pedersen, 1991; Wang et al., 2016; Wu et al., 2016; Yan et al., 2016). This rate has been shown to be remarkably consistent, albeit with some reduction, across growth rates in bacteria as well, decreasing only two-fold with a 10-fold decrease in growth rate in E. coli (Dai et al., 2016; Dalbow and Young, 1975; Dennis and Bremer, 1974a; Young and Bremer, 1976). Despite these bulk measurements, whether or not the translation rate differs across genes or codons and why is a hotly contested area of current research. On top of this, the exact rate limiting step in the multi-step process of elongation remains to be determined.
A major mechanism by which elongation rates can differ across genes and codons is the differential production and usage of the amino acid supplier to translation, tRNA. In the
universal code, only tryptophan and methionine are decoded by a single codon and tRNA. All other amino acids are encoded by multiple codons generally requiring multiple tRNA species termed tRNA isoacceptors. Furthermore, due to wobble base-pairing at the 5’ most basepair of the tRNA anticodon, tRNA can often decode multiple codons, allowing for organisms to produce less unique tRNA species than codons (<64). The overall degeneracy and crosstalk in the system leads to a complex relationship between tRNA levels and codon usage since in most organisms the usage of codons and expression of tRNAs are not equal within a given amino acid group. The phenomena of ‘codon usage bias’ occurs when an organism has evolved to use some codons more than others. Generally, an increase in usage is correlated with an increase in the cognate
tRNA isoaccpetor, however this is not always the case. Ultimately, the differences in ratios between the supply in tRNA isoacceptors, and demand for translation (codon usage), leads to the possibility of differences in translation rate for different codons and amino acids.
When and where codon usage bias affects translation is a major area of current research. First, the study of codon usage bias potentially brings answers to a long-standing fundamental question about translation, what step in the process limits the cycle? Given that tRNA
isoacceptors concentrations can vary up to ten-fold for the same amino acid, the wait time of the ribosome during the decoding step could also be greatly different between codons (Dong et al., 1996; Kanaya et al., 1999). It has been noted since the first genes were first sequenced that highly expressed genes in bacteria greatly favor codons paired with the most abundant tRNAs (Gouy and Gautier, 1982). Additionally, production of heterologous proteins using bacteria as host platforms are consistently “codon optimized” for their host to maximize production
(Gustafsson et al., 2004; Sharp and Li, 1987). Further studies have attempted to directly measure how the translation rate changes for codons decoded by abundant vs. rare tRNAs finding
proportionality between tRNA abundance and translation speed (Sørensen and Pedersen, 1991; Sørensen et al., 1989). However, these studies are confined to a few specific examples, generally in non-native situations, so the broad applicability of the results are unclear (Yu et al., 2015).
On the other hand, it has been postulated that the rate limiting step in translation is not decoding, but rather one of the additional tRNA-independent steps. The recent development of ribosome profiling, the high-throughput sequencing of ribosome protected mRNA fragments, can provide average wait times of ribosomes across the entire transcriptome (Ingolia et al., 2009). Using this global measurement, multiple works have pointed toward a smaller distribution of wait time among codons, arguing that decoding is not rate limiting step in translation (Li et al.,
2014; Subramaniam et al., 2014). However, continued advances and modifications to the protocol have begun to question this fact, demonstrating slight anti-correlations between tRNA abundance and ribosome wait time (Mohammad et al., 2019; Wu et al., 2019). Additionally, although tRNA abundances may always differ, some studies suggest that translation rate differences may only manifest during starvation of the cognate amino acid, when cells are fully saturated with amino acids (Elf et al., 2003; Subramaniam et al., 2013). Another orthogonal theory postulates that codon usage bias may not directly affect the translation rate, but instead be a global mechanism to maintain sufficient pools of more rare tRNAs (Andersson and Kurland, 1990; Frumkin et al., 2018; Klumpp et al., 2012). Furthermore, some studies speculate that codon usage bias may be important for mRNA secondary structure or decay, further confounding global analysis studies (Kudla et al., 2009; Radhakrishnan et al., 2016). In any case, differences in the translation rate of abundant versus rare codons are generally thought to be small, with overall protein synthesis rates mainly controlled through translation initiation not elongation.
Expression Stoichiometry of Tranlsation Machinery
It is not well understood how the expression of the proteins involved in the elongation cycle come together to set the protein synthesis rate. The aforementioned finding that major cellular pathways have conserved production for their components includes the process of
translation elongation (Lalanne et al., 2018). For example, it was found that the ratio between the major factors in translation elongation: ribosomes, EF-Tu, and tRNA synthetases, is maintained at a constant 1:5:1 across two billion years of evolution. This specific in-pathway stoichiometry up until then had only been observed in the context of changing growth rates in E. coli, as numerous works quantifying translation-related proteins also showed a similar conservation of
expression between faster and slower growth rates (Dennis and Bremer, 1974b; Forchhammer and Lindahl, 1971). Given a maintenance of ratios across time and space, these findings hint that translation as a pathway has a specific, potentially optimized, recipe for expression for maximal function that extends to all bacteria (Ehrenberg and Kurland, 1984). Closely related to this idea, some works have sought to understand the potential proteome allocation to translation within the context of maximizing bacterial growth rates using mathematical models. For example, work attempting to better understand the rate limiting step in translation points towards a near optimal ratio between tRNA affiliated proteins and ribosomes to maintain the elongation rate in the crowded cytoplasm (Klumpp et al., 2013). Others have studied the ratios between ribosomes and tRNA, finding that a near 10:1::tRNA:ribosome ratio keeps the total elongation cycle time at a minimum (Gouy and Grantham, 1980). For the most part however, proteome allocation studies in general treat translation as a monolith, where all proteins are treated as a single large chunk in the overall cellular proteome, and overall experimental evidence is lacking (Scott et al., 2010; 2014). Therefore, much more work is required to understand how each individual component comes together to build the full pathway.
Consequences of Translation Elongation Rate Reduction
Given the well conserved stoichiometry of components and high rate of translation elongation across organisms, it follows that reduction in ribosome speed can have drastic effects on gene expression and cell physiology. For fast growing bacteria, reduction in the elongation rate is directly related to a reduction in cell growth rate due to the “bacterial growth law” (Bremer and Dennis, 2008; Scott and Hwa, 2011). This ‘law’, based on the observation that ribosome content is linearly related to growth rate at medium to fast growth rates, implies that
the ribosomes are working near capacity at steady state, setting the doubling time of the
proteome and thus the growth rate (Schaechter et al., 1958). Reductions in the actual rate of these ribosomes would therefore increase the amount of time required to double the proteome,
decreasing the overall population growth rate. Although the direct consequences of reduced translation speed are less clear in more complex organisms, the requirement to avoid collisions of ribosomes actively engaged in translation is conserved. Perturbations to the rate of translation, whether through errors in gene expression, chemical insults, cis acting elements, or unfavorable codons stretches, can lead to ribosome queuing & collisions (Doma and Parker, 2006). These issues have downstream consequences in a variety of ways including protein misfolding, ribosome sequestration, and mRNA/nascent chain degradation (Doma and Parker, 2006; Ferrin and Subramaniam, 2017; Nedialkova and Leidel, 2015). In eukaryotes, pausing in the internal mRNA is referred to as “no go” and is most well studied in terms of ribosomes that have missed stop codons and begin translating into the poly(A) tail (Harigaya and Parker, 2010). More recent work has begun to uncover the role that misregulation of tRNA can have on translation and novel factors are still being discovered to ameliorate these issues in higher eukaryotes (Ishimura et al., 2014; Kirchner and Ignatova, 2015). These types of translation stalling events are dealt with by the Dom34-Hbs1complex in yeast to degrade the nascent peptide and split the ribosomal subunits for effective recycling (Bengtson and Joazeiro, 2010; Shoemaker et al., 2010). In bacteria it is thought that cleavage of the mRNA at a stall site allows for entry of tmRNA, the major ribosome rescue system of non-stop mRNA (Christensen and Gerdes, 2003; Li et al., 2008). Regardless of mechanism, the end result of these ‘translation abortion’ pathways is the destruction of both mRNA and nascent protein. Given this terminal outcome, it is unclear how and when exactly they are used during transient pausing. In the context of pausing due to amino
acid starvation, the observation of increased ribosome density at starved codons provides evidence that translation abortion pathway does not act instantaneously, and is in competition with canonical translation, misincorporation, and ribosome slippage (Darnell et al., 2018;
Subramaniam et al., 2014). However, the detection of incomplete protein products upon deletion of the genes involved in abortive translation, such as tmRNA in E. coli, provides evidence that abortive translation occurs at some rate during transient pausing (Subramaniam et al., 2014). How cells balance the waiting time for the correct tRNA and potential effects of ribosome queuing against the waste of resources associated with abortive translation remains to be fully elucidated.
Aminoacyl-tRNA Synthetase Function and Structure
The most well studied mechanism of transient translation pausing is amino acid
starvation. Since amino acids are used in a variety of processes other than translation, in order to target amino acid starvation only to the ribosome, it is common to inhibit the first step in the process by which amino acids are given to the ribosome, tRNA aminoacylation. The step of tRNA aminoacylation, or ‘tRNA charging’, is carried out by a universally conserved set of proteins called aminoacyl-tRNA synthetases (aaRS). These ancient proteins, essentially all catalyze the same reaction linking an amino acid to a tRNA (aa-tRNA) by utilizing the energy of ATP hydrolysis (Figure 4). Despite the relatively straightforward chemical reaction, the
evolution of aaRS, their structure, and biochemistry are anything but simple. As enzymes catalyzing reactions foundational to all life they are thought to have predated the root of the universal phylogenetic tree and possibly evolved from ribozymes with the same function (Lee et al., 2000; Woese, 1998). Surprisingly, the 20 canonical aaRS proteins are split between two
structurally unrelated classes of enzymes, Class I and Class II based on their sequence motifs (Eriani et al., 1990). The origin of this divergence, given the common reaction and ligand, is still a source of speculation today, with some postulating that the two classes arose from opposite strands of a single gene (Carter and Duax, 2002; Martinez-Rodriguez et al., 2015; Rodin and Ohno, 1995). Type I synthetases are characterized by their active site containing a Rossmann dinucleotide fold for the binding of ATP (O'Donoghue and Luthey-Schulten, 2003). Included in this fold are two major motifs, an HIGH and a KMSKS motif that are conserved across all Class I aaRS from bacteria to human (Austin and First, 2002). Mutations within either motif has been shown to completely abolish aaRS enzymatic activity (Austin and First, 2002; O'Donoghue and Luthey-Schulten, 2003). On the other hand, class II enzymes build their active sites using an antiparallel -fold unique to aaRS proteins and hold onto ATP in a different conformation. (Arnez and Moras, 1997; Murzin et al., 1995).
Figure 4. Catalytic mechanism of aminoacylation reaction by aaRS enzymes. Catalytic mechanism of tRNA charging. The top row represents the first step, the formation of the aminoacyl adenylate. In the second step, the 2’ or 3’ hydroxyl of the terminal adenosine on the tRNA performs nucleophilic attack on the α-carbonyl of the aminoacyl-adenylate completing the “charging” reaction. Adopted from (Li et al., 2015).
Another key difference between the two enzyme classes lies in how the enzymes bind tRNA. tRNA recognition, the process of aaRSs selecting the correct tRNA, is a difficult problem for the proteins to solve. Correct recognition is critical in maintaining the fidelity of the genetic code as the ribosome is unable to distinguish if the correct amino acid to tRNA pair is formed. As such, it is actually the aaRSs that are establishing the link between nucleotide and protein. Due to this importance, even minor losses in recognition fidelity, whether through losses in recognition or quality control, can have major impacts on organism fitness. Unfortunately for the aaRSs, tRNAs are all highly similar at the sequence and structural level, maintaining the same L-shaped three-leafed clover form across tRNAs for all amino acids. The maintenance of this similar structure is important for both the ribosome and EF-Tu so that both molecules can interact with relatively the same affinity for all aa-tRNA (LaRiviere et al., 2001; Schrader et al., 2011).
Fortunately, there are a few major points of difference that can be used by aaRS to differentiate tRNA. First, the anticodon sequence is the major unique feature of each tRNA and some aaRSs, mainly class I aaRSs, use the anticodon for recognition. However, it is thought that in general the three base pairs of the anticodon do not provide enough binding energy nor differentiation capacity to be the sole points of recognition. aaRS can also recognize tRNA at their discriminator base (N73), D loop, or slight differences among the acceptor stems, near the site of aminoacylation (Ibba and Söll, 2000). Another key difference among tRNAs is the adjustable length and sequence of the variable loops (Lenhard et al., 1999). It has been shown
that the variable loops are used more for recognition by Class II aaRS as their cognate tRNAs generally have larger variable regions. To bind these extended variable regions, tRNA Class II enzymes often have N or C terminal extensions (Cusack et al., 1991). For example, the tRNA synthetase enzyme for serine (SerS) while having contacts with tRNA at multiple locations, primarily recognizes serine tRNA with a large conserved N-terminal coiled-coil (Borel et al., 1994; Cusack et al., 1990). Similarly, the aspartyl-tRNA synthetase in yeast has been shown to use its N-terminal extension to recognize aspartyl tRNA, however in this case binding occurs using both the anticodon and variable loops (Ruff et al., 1991). Another interesting finding of early structural work was the face in which the synthetase bound the tRNA. AspRS, a Class II synthetase, was found to approach the tRNA from the opposite side of the previously solved structure at the time of GlnRS, a class I enzyme. Since the early 1990’s when the first aaRS-tRNA structure pair was solved, all 20 canonical aaRS-aaRS-tRNA structures have been solved across a variety of organisms (Ruff et al., 1991). These additional structures further demonstrated that Class II aaRS bind their cognate tRNA from the side of the variable loop, and make contacts with the minor groove of the acceptor stem while Class I aaRS bind using the minor groove with the variable loop facing out (Ibba and Söll, 2000). These structures nicely complement detailed mutational approaches to fully map out the complex landscape that allows aaRS to successfully distinguish between multiple similar substrates.
The two classes also differ at the quaternary level of structure (Table 1). Most Class I enzymes are relatively large single monomers with only TrpRS and TyrRS functioning as homodimers. Conversely, no Class II enzymes function as monomers, as they exist in solution and catalyze aminoacylation mostly as homodimers. Some interesting outliers include AlaRS which was original observed to form a homotetramer in solution (Putney et al., 1981), however
subsequent studies found that it could exist in multiple homopolymeric states depending on conditions (Sood et al., 1997; 1996). PheRS and some GlyRS enzymes actually involve two different ORFs. In bacteria the tetramer of two genes, pheS and pheT, are produced in equal abundance to make up the full PheRS complex (Bobkova et al., 1991; Brakhage et al., 1990; Lavrik et al., 1982).
Table 1. Aminoacyl-tRNA synthetase enzyme form & regulation Class I aaRS T box in
B.S.?
Class II aaRS T box in
B.S.?
ArgRS α No GlyRS3 α
2, (α)2 Yes
CysRS α No HisRS α2 Yes4
IleRS α Yes ProRS α2 No
LeuRS α Yes ThrRS α2 Yes
MetRS α, α2 Yes SerRS α2 Yes
ValRS α Yes AsnRS α2 No
LysRS1 α No AspRS α2 Yes4
GlnRS2 α No LysRS1 α
2 No
GluRS α No AlaRS α, α4 Yes
TrpRS α2 Yes PheRS (α)2 Yes
TyrRS α2 Yes
1 LysRS is found as both class I and II in different organisms(Cusack, 1995) 2 In most bacteria, including Bacillus subtilis, glutaminyl tRNA is created by an
amidotransferase protein complex to convert Glu-tRNAGlu into Gln-tRNAGln (Curnow et al., 1997)
3 GlyRS exists in two forms across different organisms (Schimmel and Söll, 1979)
4 hisS and aspS genes exist in a single two gene operon controlled by aspartate tRNA
Biochemistry, Kinetics, and Inhibitors of aaRS Enzymes
Structural differences are not the only divergence point between Class I and Class II enzymes. The biochemistry of the conserved reaction also has been found to differ between the two types of enzyme. Interestingly, the hydroxyl group on the ribose ring in the terminal adenine of the tRNA in which the aminoacyl linkage is attached differs between the two classes. Class I
enzymes primarily attach the amino acid to the 2’ hydroxyl and Class II enzymes to the 3’ hydroxyl. This difference is not thought to have a major impact on aminoacyl linkage stability as stability is primarily driven by amino acid identity (Arnez and Moras, 1997; Peacock et al., 2014). Another biochemical question still under study concerns the rate limiting step in the charging reaction. Early work characterizing the kinetics of reaction in vitro found that the aminoacyl transfer step was ten times greater than the steady-state kcat, suggesting that product
release limited the full reaction for GlnRS, ArgRS, and IleRS, all Class I enzymes (Eldred and Schimmel, 1972; Fersht et al., 1978; Uter and Perona, 2004). In contrast, HisRS, PheRS, and SerRS, all Class II enzymes, did not show the same kinetics (Dibbelt et al., 1980; Guth et al., 2005; Lin et al., 1983). Further studies confirmed the differences between the two classes, and identified EF-Tu as a key contributor in increasing steady-state turnover for Class I enzymes by promoting product release (Zhang et al., 2006).
One of the most intriguing findings to come from the in vitro biochemical studies is a consistent lack of concordance between the in vitro measured rates and the required in vivo requirements for aaRS turnover. A back of the envelope calculation for required turnover estimates that the turnover of the average aaRS would need to be ~20 s-1 in order to not limit protein synthesis. This estimate can be further refined by taking into account species specific ribosome and aaRS expression, with codon usage. However, despite refinement, the average turnover measured in vitro is still near one order of magnitude less than the estimated
requirement (Jakubowski and Goldman, 1984). As numerous studies have pointed out, the in vitro conditions may not perfectly recapitulate the in vivo environment through the exclusion of potentially important factors like EF-Tu or the high concentration of intracellular aaRS and tRNA. Additionally, despite the highly-conserved enzyme core, aaRS in eukaryotes generally
have additional domains, some of which are known to promote large multi-aaRS (MSC)
complexes that may promote faster turnover rates than when measured individually (Park et al., 2005). However, these domains are absent in bacteria so the underlying reason for the
discrepancy means by which aaRS turnover matches amino acid incorporation is unclear. Additionally, these in vivo calculations are minimum turnover rates to not limit the translation cycle, and therefore do not provide the charging reaction a ‘safety factor’ as discussed
previously. Regardless, given that in vitro measurements are probably not underestimating the in vivo rates by multiple orders of magnitude, reduction in functioning aaRS could easily limit protein synthesis and cellular growth.
One way to study limitations on aaRS activity and its resulting consequences, is through the use of compounds specifically inhibiting individual aaRS. A general way to specifically inhibit individual aaRS is to use structural analogs of amino acid that cannot be properly ligated to tRNA such as serine hydroxymate or arginine hydroxymate (Nazario and Evans, 1974; Tosa and Pizer, 1971). During growth in minimal media, the addition of large amounts of amino acid analog can effectively outcompete the necessary L-amino acids for translation, creating stalled ribosomes and activation of stress responses. However, given their similarity to amino acids they can have non-translation off-target effects. To target aaRS more specifically a few compounds with antibiotic like properties have been discovered. Mupirocin, the major clinical antibiotic used to treat methicillin-resistant Staphylococcus aureus, binds tightly to and inhibits a wide spectrum of bacterial IleRS enzymes without inactivating the human protein (Hughes and Mellows, 1978; Nakama et al., 2001). Other aaRS targeting antibiotics have been discovered, however their therapeutic potential is limited due to the fast acquisition of resistant strains given the essentiality of aminoacylation to bacterial growth (Hurdle et al., 2005; Kwon et al., 2019). For research
purposes however, they are key tools to study the effects of inhibiting aaRS (Silvian et al., 1999). Overall, despite the straightforward and conserved underlying chemical reaction, there is still much to be learned about the biochemistry of the aaRS proteins.
aaRS Gene Regulation
Perturbing aminoacylation whether through amino acid starvation or specific targeting antibiotics does not necessarily lead to lowered charging output in bacteria. In most well studied bacterial species, aaRS genes are auto-regulated in order to increase production when the need arises. Surprisingly, the exact molecular mechanisms to achieve autoregulation is not identical across organisms and the two most well studied organisms E. coli and B. subtilis show striking divergence in strategies for regulating aaRS production.
E. coli seems to have favored a more generalist approach, with multiple different mechanisms at all levels of the central dogma to control aaRS expression (Putzer and Laalami, 2013). The gene for alanine tRNA charging, alaS, moonlights as a transcription factor, binding palindromic sequences upstream its own promoter in the presence of high alanine levels (Putney and Schimmel, 1981). When levels of alanine are low, such as during acute amino acid
starvation, repression is relieved and AlaS levels increase. The tetrameric PheRS complex utilizes a transcriptional attenuation mechanism to regulate the PheST operon (Springer et al., 1983). The translation rate of a 14 amino acid ORF upstream of the pheST genes containing five phenylalanine residues determines whether or not transcription is prematurely aborted, similar in mechanism to the classic trp operon (Springer et al., 1985). ThrRS production is controlled in a manner to ribosomal proteins, by binding its own mRNA to sterically occlude the ribosome and limit translation (Moine et al., 1988; Sacerdot et al., 1998). While the origin of these multiple
independent mechanisms arose is still an unknown, clearly regulation of aaRSs is important for E. coli fitness.
In stark contrast, Bacillus subtilis, and in fact most Firmicutes, use a single strategy to control aaRS expression. First discovered in the early 1990’s, a novel form of riboswitch named “T box” riboswitches, has been found to control the majority of aaRS genes in Firmicutes with 14 of 19 B. subtilis aaRS genes utilizing this mechanism (Grundy and Henkin, 1993; Henkin et al., 1992; Vitreschak et al., 2008) (Table 1). T box riboswitches are large ~300 nucleotide
structured RNAs in the 5’ UTR of the controlled genes (Green et al., 2010; Gutiérrez-Preciado et al., 2009; Putzer et al., 1995). Although some T boxes have been discovered to operate at the translational level (Sherwood et al., 2015), the best studied and most widespread T boxes are transcriptional regulators. During transcription, the RNA upstream of the open reading frame forms a complex multi-stem structure with the ability to bind tRNA cognate to the aaRS
downstream. The ‘switch’ depends on the aminoacylation status of the bound tRNA (Figure 5A). When bound by a charged tRNA, occupied at the 3’ end by an amino acid, the final stem loop forms a structure that promotes termination of the RNA polymerase transcription complex. This leads to a truncated and non-functional RNA product before the gene ORF that is subsequently degraded by RNase Y (Deloughery et al., 2018). This outcome is also achieved when no tRNA binds, and is thus the native fold of the riboswitch (Grundy et al., 2002). Alternatively, the binding of uncharged tRNA, with a free 3’ hydroxyl group, changes the conformation of the final loop into an anti-termination loop, allowing for transcription of the downstream mRNA that can be translated to produce aaRS protein. Although there are conserved features of all T boxes, each is a unique sensor to tRNA cognate to that of the synthetase being controlled (Gutiérrez-Preciado et al., 2009). Therefore, like aaRS enzymes, T boxes are required to identify specific variants in a
pool of related molecules. Unlike aaRS proteins, the major point of differentiation for the T boxes is the tRNA anticodon, as numerous studies swapping the tRNA anticodon binding triplet in the T box can efficiently switch recognition to another tRNA (Grundy and Henkin, 1993; Grundy et al., 2002). More recent structural work paints a broader picture in terms of overall tRNA binding, with multiple points of contact between riboswitch and tRNA across multiple different classes of T boxes (Battaglia et al., 2019; Grigg et al., 2013).
Despite the large body of work dedicated to T boxes, most of the focus has been on their biochemical features, especially in vitro, and many key questions about their in vivo nature remain to be explored. Functional studies suggest that as switches, T boxes can act
bidirectionally, as reporter genes linked to T boxes are sensitive both to starvation and aaRS overproduction (Luo et al., 1997). Validating this idea, nascent transcriptome sequencing shows that at steady state growth in B. subtilis roughly one in five transcription events leads to a productive aaRS mRNA, suggesting an equilibrium exists in cells to maintain proper aaRS protein levels (Figure 5B) (Larson et al., 2014). How sensitive this equilibrium is to changes in tRNA charging, and the general dynamic range of regulation in vivo, remains to be worked out. Additionally, it is yet to be determined if the T boxes provide important buffers to expression noise as has been posited for other forms of autoregulation (Raser and O’Shea, 2005).
Furthermore, it is interesting to note that T boxes effectively set their own steady-state level of charged tRNA through the autoregulatory loop. Why tRNA charging levels are maintained to that observed is an open question linking T box biochemistry with the entire translation system and bacterial growth in general. In summary, maintaining a high rate of protein synthesis through a constant flux of aminoacylation buffered by T boxes or other regulation is of critical
Figure 5. T box riboswitch regulation in Firmicutes. (A) Cartoon schematic of T box
riboswitch. During transcription of the 5’ UTR upstream of an aaRS ORF tRNA has a chance to bind primarily with the anticodon. If charged tRNA or no tRNA binds, a hairpin loops forms and transcription terminates. Alternatively, upon binding uncharged tRNA, an antiterminator loop is formed via the nascent transcript and RNAP proceeds to transcribe the full gene body. (B) Sequencing data of serS operon. NET-seq data obtained from (Larson et al., 2014) shows increased transcriptional activity in the T box leader region than the downstream, translated, open reading from of serS gene. T box verified as a UTR by a lack of ribosome protected fragments as detected in ribosome profiling (Lalanne et al., 2018).
(p)ppGpp and the Stringent Response
Control at the level of aaRS expression is not the only regulatory strategy organisms use to control protein production. Given the high cost and investment required in the synthesis of proteins, all organisms have a need to balance protein production with available nutrients. The building blocks of proteins, amino acids, can either be acquired from the environment or synthesized de novo, and cells must maintain a proper balance between the two processes to sustain growth (Lodish et al., 2016). Therefore many regulatory mechanisms have evolved to sense intracellular amino levels in the cell and shift large scale gene expression investment between translation related proteins and amino acid biosynthesis (Hinnebusch, 2005; Sabatini, 2017; Srivatsan and Wang, 2008). In bacteria, the sensor system involves a family of highly conserved relA proteins, a universal small molecule signal, (p)ppGpp, and a large-scale
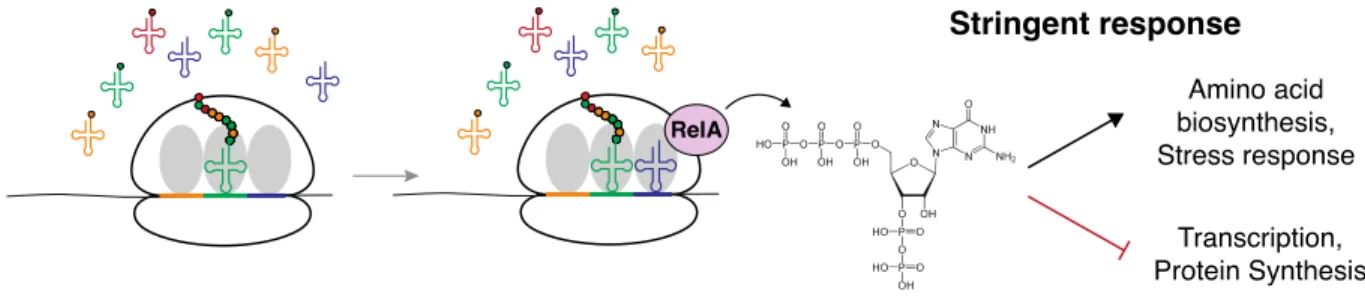
reprogramming of gene expression generally referred to as the “Stringent response” (Figure 6) (Srivatsan and Wang, 2008).
(p)ppGpp was first discovered as a product of acute amino acid starvation in E. coli (Cashel, 1969; Potrykus and Cashel, 2008). Since then, the “Magic spot” a hyper-phosphorylated guanine nucleotide has been found to be produced in all studied bacteria as well as chloroplasts (Atkinson et al., 2011). It is produced by two major enzymes in E. coli, RelA and a closely related protein SpoT, while in B. subtilis it is produced by a major synthetase RelA, and two minor proteins SasA and SasB (Nanamiya et al., 2008). Large bodies of work on (p)ppGpp have revolved around two major questions. First, what is the exact mechanism by which RelA is activated? Second, what are the downstream targets and consequences of increased (p)ppGpp levels?
Figure 6. Mechanism of stringent response activation. Cartoon diagram of steps involved in activating the Stringent response. When the ribosome encounters a codon for a starved tRNA with low charging levels (blue codon, blue tRNA) RelA synthesizes pppGpp. By a variety of mechanisms across bacteria (p)ppGpp induces changes in gene expression, re-allocating resources from growth promoting genes to genes required for starvation.
The mechanism of activation of RelA has been studied extensively via both genetic and biochemical approaches in multiple organisms. Although RelA and SpoT in E. coli are closely related by sequence, it has been found that RelA is the major synthease involved during amino acid (AA) starvation (Potrykus and Cashel, 2008). The two major requirements for activation of
RelA during AA starvation are the ribosome and uncharged tRNA within the A-site (Haseltine and Block, 1973). While these two requirements have been well mapped out and agreed upon, the exact mechanism by which RelA is activated is hotly debated. One model proposes that the RelA sits by on idle ribosomes, waiting for uncharged tRNA to bind. After uncharged tRNA binding during the translation elongation cycle, (p)ppGpp synthesis begins, causing a
conformational change in RelA leading to its eventual release from the stalled ribosome (Wendrich et al., 2002). The activated RelA after a burst of activity then ‘hops’ to the next ribosome awaiting more uncharged tRNA. This model has been further substantiated by single-molecule tracking studies (English et al., 2011). Alternatively, structural and contradictory imaging evidence suggests that RelA is not ribosome bound normally but requires uncharged tRNA to bind while staying ribosome bound during (p)ppGpp synthesis (Brown et al., 2016; Li et al., 2016). While no definitive evidence has concretely confirmed either model, the evidence towards RelA activation requiring uncharged tRNA is unanimous.
Activation of RelA, and the subsequent accumulation of (p)ppGpp, have been mostly studied in the context of amino acid starvation. The collective set of actions taken by the cell during this loss of nutrients is referred to as the “Stringent response”. Although stringent affects nearly all major pathways in the cell including translation, replication, and metabolism
(Hauryliuk et al., 2015; Liu et al., 2015a; Wang et al., 2007), the myriad of transcriptional changes are the most well characterized consequences of activation (Gourse et al., 2018). These changes involve both reductions in production of genes in energy intensive processes used for growth, and increases in production in genes required for shifting to an environment with less available nutrients. Although the overall changes are conserved across species the means by which these transcriptional changes occur differs across bacteria.
In E. coli it has been found that (p)ppGpp directly binds to the RNA polymerase (RNAP) inducing a massive shift in polymerase targeting (Durfee et al., 2008; Ross et al., 2013; Sanchez-Vazquez et al., 2019; Traxler et al., 2008; Zuo et al., 2013). The most important outcome in this re-targeting is the reduction in rRNA operon transcription. This reduction is mediated both by ppGpp directly binding RNAP, and through the subsequent binding of DksA, which together massively reduce ribosome production (Doniselli et al., 2015; Molodtsov et al., 2018; Paul et al., 2004). Alternatively, in B. subtilis the means by which transcriptional programs are re-wired during the stringent response appears to be indirect, mainly through the modulation of intracellular GTP pools (Lopez et al., 1981). It has been found that (p)ppGpp, while being a downstream metabolite produced from GTP, additionally binds and represses the activity of GTP synthesizing enzymes (Kriel et al., 2012; Liu et al., 2015b). The decrease in GTP pools has a major effect on ribosomal RNA operon transcription as the initiating nucleotide for rRNA operons in B. subtilis is guanine (Krásný and Gourse, 2004; Natori et al., 2009). This reduction in GTP is thought to make GTP limiting in the transcription initiation reaction, reducing total promoter output for guanine initiating promoters (Krásný et al., 2008).
The other half of the stringent response is the large upregulation in genes related to decreased nutrient availability. Given the mechanism of upregulation involves increased uncharged tRNA pools being sensed on the ribosome, a major set of genes activated are related to amino acid biosynthesis. Like the control of rRNA operons, amino acid biosynthesis is increased by different means in divergent bacteria. In E. coli the decrease in rRNA transcription through (p)ppGpp & DskA, which can account for as much as 70% of total RNAP flux (Bremer and Dennis, 2008)leads to a passive re-distribution of RNAP molecules to other sites in the genome, to the benefit of amino acid biosynthetic enzymes (Barker et al., 2001; Magnusson et
al., 2007). In B. subtilis, transcriptional changes are also indirect, although potentially less passive (Eymann et al., 2002). At the same time that GTP pools are decreased upon (p)ppGpp synthesis, ATP pools inversely begin to rise (Lopez et al., 1981). Unlike rRNA operons beginning transcription with a guanine nucleotide, amino acid biosynthesis operons generally begin transcription with adenine and see increased production as ATP is no longer limiting transcription initiation (Krásný et al., 2008). A secondary effect of the stringent response is the de-repression of operons controlled by the CodY transcription factor (Brinsmade et al., 2010; Tojo et al., 2005). De-repression further induces the expression of branch chain amino acid metabolic genes as well as others involved in flagellar production, competence, and genes involved in stationary phase maintenance (Belitsky and Sonenshein, 2013; Brinsmade et al., 2014; Kriel et al., 2014). Whether directly or indirectly, the increases in gene expression to amino acid biosynthesis are a direct counteraction to the sensing of limited nutrients provided to the ribosome. Unlike T boxes regulating aaRS genes, which can activate single genes in response to starvation for a single amino acid, the stringent response is global, controlling broad categories of genes even to starvation for a single amino acid.
But what is the importance of such a global reprogramming? The stringent response has been shown to be important for multiple biological phenomena such as sporulation, antibiotic resistance, persistence, and even pathogenicity (Dalebroux et al., 2010; Lopez et al., 1981; Maisonneuve and Gerdes, 2014; Svenningsen et al., 2019). However, underlying these global phenotypes is the importance of coordinating gene expression. Given the high amount of energy required to sustain translation, it is hugely disadvantageous for cells to maintain ribosomes and protein synthesis rates when nutrients are unavailable. Additionally, ribosomes starved at codons cognate to limiting amino acids can cause ‘traffic-jams’ on mRNA leading to detrimental
downstream effects as discussed previously (Gloge et al., 2014; Hanson and Coller, 2018; Rauscher and Ignatova, 2018). The stringent response has been shown to play a key role in keeping the balance between amino acid production and protein synthesis, possibly maintaining the bacterial ‘growth law’ relationship between ribosome content and the growth rate (Scott et al., 2010; Zhu and Dai, 2019). The recent finding that conserved molecular pathways have maintained stoichiometry between factors across evolution, and that this conservation extends across growth rates, potentially implicates the stringent response as the major coordinator of these expression ratios (Lalanne et al., 2018). The importance of maintaining a proper balance possibly ensures that the translation elongation rate remains constant across a wide range of growth rates (Dai et al., 2016). However, it is unclear if the stringent response would still be beneficial for the cell if activation was triggered without nutrients actually becoming limiting. For example, reducing expression of aaRS genes could produce the same activation of RelA and production of (p)ppGpp through accumulated uncharged tRNA, despite amino acid levels remaining unchanged. Would the coordination of ribosome production and the bacterial growth law remain? And how would the shift in global transcription affect the cell? I intend to explore these questions in detail in the following work.