https://doi.org/10.4224/20377950
READ THESE TERMS AND CONDITIONS CAREFULLY BEFORE USING THIS WEBSITE. https://nrc-publications.canada.ca/eng/copyright
Archives des publications du CNRC
For the publisher’s version, please access the DOI link below./ Pour consulter la version de l’éditeur, utilisez le lien DOI ci-dessous.
Access and use of this website and the material on it are subject to the Terms and Conditions set forth at
Green Roof Infrastructure - Technology Demonstration, Monitoring and Market Expansion Project
Liu, K. K. Y.; Baskaran, B. A.
https://publications-cnrc.canada.ca/fra/droits
L’accès à ce site Web et l’utilisation de son contenu sont assujettis aux conditions présentées dans le site LISEZ CES CONDITIONS ATTENTIVEMENT AVANT D’UTILISER CE SITE WEB.
NRC Publications Record / Notice d'Archives des publications de CNRC:
https://nrc-publications.canada.ca/eng/view/object/?id=f7bfc871-02f1-491d-bac9-ef33908735ab https://publications-cnrc.canada.ca/fra/voir/objet/?id=f7bfc871-02f1-491d-bac9-ef33908735ab
Green Roof Infrastructure – Technology Demonstration, Monitoring and Market Expansion
Project
Liu, K.; Baskaran, B.
B-1054.1
A green roof is a specialized roofing system that supports vegetation growth on rooftops. It has become a multi-million dollar industry in Germany and is rapidly gaining popularity in North America. Green roofs offer multiple benefits to urban areas. They can reduce building’s heating/cooling energy requirements. When widely adopted, they can lower the urban heat island effects and further reduce energy demand for the region, and the associated green house gases (GHG) emissions. In addition, green roofs can reduce stormwater runoff, improve air and water quality, and provide amenity space in urban areas.
Market penetration of green roof technology has been low in Canada. There is a general lack of awareness among building professionals and the general public on the benefits of this technology. Technical data (e.g. energy efficiency and urban heat island) specific to Canadian climates are not available for cost-benefit analysis. Although green roofs offer public benefits such as stormwater retention and improvement in air/water quality, there are currently no public policies that recognize these benefits and support their implementation. This project aimed to address the above market barriers by providing objective technical data and analyses.
This work was carried out by a partnership between the National Research Council (NRC), Environment Canada (EC), and Peck and Associates (PA). The partnership also involves various stakeholders such as the City of Toronto (Corporate Services, Works and Emergency Services), the Toronto Atmospheric Fund, the Toronto and Region Conservation Authority, the Food Policy Council, Green Roofs for Healthy Cities (a private sector coalition) and the Rooftop Gardens Resource Group (a community based non-profit group).
Technology Early Action Measures (TEAM) funding facilitated the leverage of other resources for this project as well. The City of Toronto has contributed over $300K of capital investment and in-kind support in establishing the green roofs. The research team also received funding from Great Lake Sustainability Fund to study the stormwater management potential of green roofs at the Eastview Neighborhood Community Centre. This report is divided into three parts each addressing the various objectives of this project.
• Part 1, carried out by NRC, presents technical data by describing the instrumentation of the green roofs, data analysis on energy savings and GHG reduction, as well as an evaluation of membrane durability.
building green roofs were instrumented in summer 2002 to provide thermal performance and energy efficiency data. The green roofs were shown to reduce heat flow through the roof, thus lowering the buildings’ heating/cooling energy demand, and the associated GHG emissions. Annual heat flow through the roofs was reduced by 30 to 50%. This corresponds to a reduction of about 20-25 kWh/m2/year in heating/cooling energy demand or 5-7 tonnes of CO2/m2/year in associated GHG emissions. The green roofs were more effective in reducing heat flow in the summer (70-90%) than in the winter (10-30%) due to different thermal mechanisms involved. Energy efficiency varied with growing medium depth and the system design. Although it is too early to evaluate the membrane durability, observations so far indicate that green roofs could likely improve membrane durability by reducing heat aging, thermal stresses, ultra-violet radiation and physical damages.
Part 2: Computer modeling was performed to evaluate the effectiveness of green roofs
in reducing energy use in buildings and urban heat island effect in Canadian cities. The VISDOE simulation tool was used to evaluate the effectiveness of green roof technology on a typical one-storey office building in Canada. Preliminary results (excluding evapotranspiration) showed that a green roof could reduce cooling energy consumption by about 5%. Effectiveness is dependent on building types and usages, and also varies significantly with climate differences. To examine the effectiveness of green roofs on mitigating the urban heat island effect, a mesoscale model coupled with parameterizations of natural and urban surfaces to simulate low-level air temperature was developed. The model was run for 48 hours in late June 2001 in Toronto – days with heat and air pollution episodes. With substantial implementation of vegetated and high-albedo roofs, an average cooling of low-level air 0.1-0.5°C with maximum reductions of 0.6-0.9°C. With irrigation, green roofs could reduce citywide temperature by 1°C.
Part 3: This project has successfully increased public awareness of the benefits of
green roof technology. The Toronto City Hall green roof serves as a high profile demonstration site. Thousands of visitors have toured the green roof in the past two years, including a large number of building professionals. A self-guided tour brochure was also developed and available at the Toronto City Hall. Official launch of the Eastview Neighbourhood Community Centre green roof in October 2002 further increased public awareness of the technology. Over 150 people, including numerous City Councilors and the media attended the event and the press conference. This demonstration project was also featured in various issues of the Green Roof Infrastructure Monitor (an online newsletter on green roofs).
Green Roof Infrastructure – Technology Demonstration, Monitoring and Market Expansion Project
Part 1: Field Monitoring and Technical Analysis: May 2002 – June 2003
Karen Liu Bas Baskaran
Table of Contents
Page
1. Introduction 3
1.1 Background 3
1.2 Principal Components in Green Roofs 5
1.3 Objectives 6
2. Toronto City Hall – Downtown Toronto 7
2.1 Features 7 2.2 Instrumentation 7 2.2.1 Roofing Systems 7 2.2.2 Instrumentation Locations 8 2.2.3 Sensors Installation 8 2.2.4. Monitoring Parameters 9 2.3 Data Analysis 10 2.3.1 Temperature Profile 10 2.3.2 Temperature Fluctuations 12 2.3.3 Heat Flow 13 2.3.4 Energy Efficiency 14 2.4 Other issues 16
3. Eastview Neighbourhood Community Centre – East York, Toronto 17
3.1 Features 17 3.2 Instrumentation 17 3.2.1 Roofing Systems 17 3.2.2 Instrumentation Locations 18 3.2.3 Sensors Installation 18 3.2.4. Monitoring Parameters 19 3.3 Data Analysis 21 3.3.1 Temperature Profile 21 3.3.2 Temperature Fluctuations 24 3.3.3 Heat Flow 26 3.3.4 Energy Efficiency 27
3.4 Other issues 29
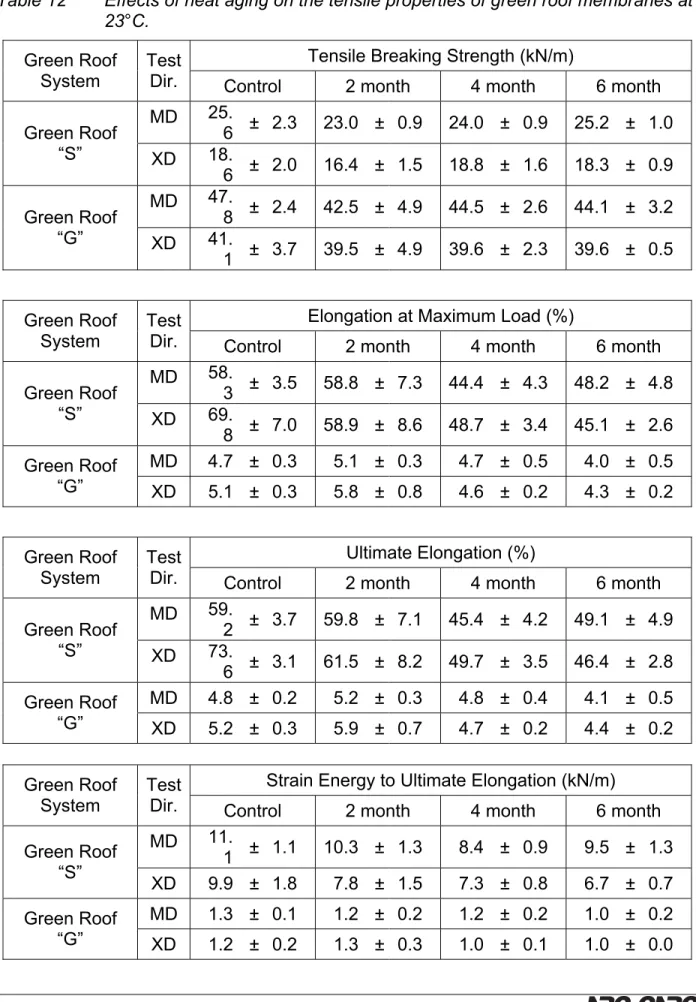
4. Membrane Durability 30
4.1 Experimental Procedure 30
4.2 Results and Discussion 31
5. Discussions 32
5.1 Thermal Performance in Different Seasons 32
5.2 Energy Savings and GHG Reduction 33
5.3 Heat Flow and Solar Radiation 35
5.4 Growing Medium Depth 35
5.5 Comparison of Green Roof Systems 37
5.6 Membrane Durability 37
6. Conclusions 39
7. Future Research work 40
8. References 41
9. Acknowledgement 42
10. Tables, Figures and Photos 43
10.1 Tables 43
10.2 Figures 54
1. Introduction 1.1 Background
Many Canadian cities are facing unique environmental challenges today – poor air and water quality and urban heat island effects are two examples. For example, the City of Toronto has recently implemented a health alert system to give warnings of high temperatures and poor air quality in the summer. Poor water quality due to combined sewage overflow events forced temporary closures of beaches in the Toronto area. Climate change is expected to bring about more frequent occurrence of extreme temperatures and precipitation events and many further exacerbate these problems. Many of these environmental problems faced by the cities are related to the removal of vegetation due to urban population growth. Vegetation and soil provide moisture for evapotranspiration, a process in which the leaves and the soil convert incoming solar energy into latent heat through evaporation of water, and prevents it from converting into sensible heat, therefore lowering surface air temperature. Vegetation also provides shading and further reduces surface temperature. On the other hand, a non-vegetated surface absorbs the incoming solar energy and its surface temperature increases. It re-radiates this heat and increases the surrounding air temperature. In an urban area with high building density, this re-radiated heat elevates the urban temperature – a phenomena known as the urban heat island. The higher temperatures increase the air conditioning demand and the green house gas (GHG) emissions associated with electricity generation.
Paving of the permeable surfaces where the vegetation grows with impermeable pavements exacerbates surface runoff and creates a water quality problem. During heavy rainstorms, runoff from the roofs and the roads are directed to the storm sewage infrastructure. Because of the rapid expansion of many North American cities, the storm sewage infrastructure quickly becomes overloaded. In older cities, such as the City of Toronto, where the storm and sewer infrastructure are connected, the overflow is allowed to flow into and overload the sewage infrastructure, causing raw elwage to discharge into the receiving water bodies without proper treatment. Combined Sewage Overflow (CSO) can create water pollution and cause serious environmental problems. Vegetation can significantly reduce surface runoff (the leaves intercept the rain and the soil absorbs a large part of the water) and reduce the occurrence of CSO.
Green roofs or rooftop gardens are roofs planted with vegetation. Green roofs are not a new concept and can be traced back to the hanging gardens of Babylon [1]. With advances in roofing materials, innovative research and technical development of roofing components, green roof systems can now be installed successfully under most climatic conditions. Given the limited space available for parks and green space in many North American metropolitan cities, placing the vegetation on otherwise unused building rooftops becomes an attractive building design option.
Green roofs not only add aesthetic appeal to the unused roof space that is available in most urban areas; they also provide multiple benefits. They can reduce a building’s energy demand on space conditioning, and hence greenhouse gas emissions, through direct shading of the roof, evapotranspiration and improved insulation values [2-7]. The
A 200-mm layer of growing medium and a 200-400-mm layer of thick grass has a combined insulation value equivalent to 150-mm mineral wool insulation (RSI 0.14) [2]. Under a green roof, indoor temperatures (without cooling) were found to be at least 3-4°C lower than outdoor temperatures between 25-30°C [3]. A study by Oak Ridge National Laboratory showed that a vegetated roof of 0.46-0.76m of soil reduced the peak sensible cooling needs of a building by about 25% [4]. In addition, the green roof did not have a cooling penalty like commercial buildings with high roof insulation levels. The National Research Council of Canada showed that roof with grass planted on a 150-mm growing medium reduced the heat flow through the roof by over 75% in the spring and summer [8]. Also, the roof membrane underneath the green roof rarely went above 30°C compared to an exposed membrane that typically reached over 60°C in the summer.
If widely adopted, green roofs could reduce the urban heat island [9-10] (an elevation of temperature relative to the surrounding rural or natural areas due to the high concentration of heat absorbing dark surfaces such rooftops and pavements), which would further lower energy consumption in the urban area. Mesoscale modeling conducted by Environment Canada showed that a moderate green roof coverage (6-35%) in Toronto could reduce the citywide temperature by 1-2°C during a hot summer day [11]. The extent of cooling strongly depends on the moisture available in the green roof, i.e. cooling through evapotranspiration.
Green roofs can also be used as part of the stormwater management strategy in the urban area. Part of the rain is stored in the growing medium temporarily to be taken up by the plants and returned to the atmosphere through evapotranspiration [2,7,12-13]. Studies in Berlin showed that green roofs absorb 75% of precipitation that falls on them, which translates into an immediate discharge reduction to 25% of normal levels [12]. A study in Germany showed that a grass covered roof with a 200-400 mm layer of substrate can hold 100-150 mm of water [2]. Generally, summer retention rates vary between 70-100% and winter retention between 40-50%, depending on the rooftop garden design and the weather conditions. Field monitoring in Ottawa showed that a green roof with 150 mm of lightweight growing medium could reduce by over 50% runoff in the spring and summer [14]. Environment Canada and the Greater Vancouver Regional District have included green roofs in their water balance computer model as a source control tool in reducing runoff in the region [15]. Green roofs also delay runoff into the sewage system, thus help to reduce the frequency of combined sewage overflow (CSO) events a significant problem for many major cities in North America [7]. Results from Portland, Oregon also indicated that a 100 mm green roof could absorb a 25 mm of rainfall during a summer rain event (when the soil started out fairly dry) before water started to runoff [7]. In addition, the plants and the growing medium can also
roof traffic and hail storms. In addition, green roofs can improve air quality, provide additional green space in urban areas, and increase property values [16].
1.2 Principal Components in Green Roofs
A green roof system requires additional roofing components. These components consist of a specialized roof membrane, a drainage layer, a filter membrane, a growing medium and vegetation.
1. Waterproofing Membrane: The most important component of any roofing system is the waterproofing membrane that prevents water penetration into the building. To prevent root damage to the roofing membrane, some manufacturers incorporate root repellent agent in the formulation of the roof membrane while others offer a physical root barrier, which can be a layer of polyvinyl chloride (PVC), thermoplastic polyolefin (TPO) or high-density polypropylene.
2. Drainage Layer: The drainage layer is installed over the waterproofing membrane to remove excess water from the growing medium. This comes in different forms – from a simple layer of gravel to specialized polymer foam panels or highly porous polymeric mats. In some cases, the drainage layer can also be designed to retain some water and serve as a reservoir for irrigating the plants between rainfalls.
3. Filter Membrane: The filter membrane is a geo-textile filter fabric that is installed on top of the drainage layer. It prevents fine particles in the growing medium from clogging the drainage layer.
4. Growing Medium: The growing medium supports plant growth. Its composition and depth depend on the vegetation selected. Water saturated soil can be heavy and the roof structure should be designed to bear the load. Artificial lightweight growing mediums can be used to replace regular soil to reduce the weight.
5. Vegetation: The plants should be selected for their adaptability to the local climate. Considerations should be given to the more extreme conditions experienced on rooftops such as exposure to a wide range of temperatures and soil moisture levels, higher winds (erosion of plants and soil), and solar exposure. Irrigation systems might be needed depending on the plants and weather conditions.
A green roof system can be installed over conventional and protected membrane roofing system as long as the structure can bear the additional load. Depending on the weight of the system, green roofs are generally divided into extensive and intensive systems. Extensive green roofs are lightweight systems. They generally contain less than 200 mm of lightweight growing medium and weigh no more than 300 kg/m2. These green roofs are ecological and natural, featuring small hardy plants that are self-propagating, such as grasses, wild flowers, herbs and sedums. Extensive systems require low maintenance and little if any irrigation. Accessibility is usually limited on extensive green roofs. Intensive green roofs are heavyweight systems. These green roofs generally have park-like features and they are usually accessible by the public as recreation space. Because of the deeper soil, these green roofs can support larger plants, shrubs and even trees. Irrigation and regular maintenance are required for
1.3 Objectives
Green roofs are gaining increasing attention as a sustainable building design option in North America. They can provide multiple benefits to the urban areas and help to address climate change. Many German cities have bylaws and incentive programs to promote green roof installation. In North America, the city of Portland, Oregon has pioneered an incentive program (Clean Air Incentive and Discount Program) to encourage the installation of green roofs on commercial, industrial, institutional and residential properties, with the aim of reducing the stormwater runoff problem and relieving the loading on the sewage infrastructure [17]. In Asia, the city of Tokyo, Japan has initiated a new ordinance to install green roofs on new buildings with floor space more than 1000 m2 to mitigate the urban heat island effects [18]. Recently, province of Quebec’s Energy Board has announced the Green Roof Financial Incentive Program, the first green roof specific financial incentive program in Canada, to promote green roof implementation in the province [19]. Most recently, the City of Toronto has also formed an Environment Task Force to examine how green roof technology can used to meet the city’s objectives for clean air, runoff and energy consumption.
Buildings account for 30% of energy use and 27% of GHG emissions in Canada [20]. Green roofs can reduce overall energy intensity of Canadian buildings and communities in urban areas and consequently GHG emissions. Other environmental benefits are improved air and water qualities. There are barriers to the widespread adoption in Canada. One of the major barriers is the scarcity of technical information specific to Canadian climate conditions. Another major barrier is the poor public awareness of this technology.
The National Research Council of Canada (NRC) has selected two in-service green roofs in a typical Canadian urban centre, the City of Toronto, for monitoring. One of them is the high-profile Toronto City Hall green roof. This green roof served both as a research site and a demonstration site to increase public awareness of the benefits of green roof technology. Another one is the Eastview Neighbourhood Community Centre, which provided a large area dedicated for research purpose. NRC has instrumented both green roofs and monitored their thermal performance since May 2002. The objectives of the monitoring are as follow:
1. Examine the thermal performance of extensive green roofs in the cold climate of Central Canada.
2. Measure the energy savings derived from extensive green roofs and estimates the associated green house gas reduction.
2. Toronto City Hall – Downtown Toronto 2.1 Features
Following the 1998 amalgamation, the City of Toronto became the largest municipality in Canada, with a population of about 2.5 million. The Toronto City Hall is located in the heart of downtown Toronto. Being minutes from the city’s financial district, the City Hall is surrounded by high-rise buildings (mainly office buildings and hotels) and downtown traffic [Photo 1]. This location is typical of Canada’s urban centres.
The green roof was established on the southeast corner of City Hall’s podium roof in November 2000. It is about 230m2 and consists of eight different garden plots of various horticultural themes [Photo 2]. It can be seen from the surrounding high-rise buildings and is accessible by the general public as a demonstration site.
The roof was constructed as a protected membrane system (PMS) where the roofing membrane was covered by the thermal insulation. The original roof consists of paver stones laid on a thin layer of sand, on top of the thermal insulation. Two extensive green roof systems were installed. Both systems contain similar roofing components arranged in a similar configuration. However, they were made of different materials with different designs.
2.2 Instrumentation
The roof was instrumented to measure the temperature profile and heat flow across the roofing system and the soil moisture content by embedding various sensors within the roofing systems. The atmospheric temperature and relative humidity on the podium roof were also monitored. The sensors are connected to a data acquisition system, which can be remotely accessed from NRC in Ottawa, for continuous monitoring. The experiment was designed to evaluate and compare the thermal performance with and without green roofs, of different green roof systems and with different soil depths and plants. Due to the locations of the drains on the podium, it was not possible to monitor the runoff from the green roof without extensive retrofitting of the drains. Therefore, only thermal performance of the green roof was monitored.
2.2.1 Roofing Systems
The original podium roof was constructed as a protected membrane system, where the thermal insulation was placed on top of the roofing membrane. During re-roofing, the existing asphalt-based waterproofing layer was covered by a new modified bituminous membrane. A separation layer was laid, and the original insulation boards were replaced, and covered with a new filter fabric. Bedding sand was placed on top as a thin layer where interlocking paver stones were embedded. This is the Reference Roof. For Green Roof System G, a root resistant layer was placed on top of the new modified bituminous roofing membrane. The original thermal insulation was replaced and a filter fabric was laid. This system consists of a composite semi-rigid polymeric drainage and filter mat and a root reinforcement mat. It also contains a proprietary lightweight soil
For Green Roof System S, the modified bituminous membrane was formulated with a root-repelling agent. A separation layer was placed between the new membrane and the insulation boards that were recovered from the original roofing system, and a filter fabric was laid on top. This system consists of an expanded polystyrene drainage panels and a geotextile filter fabric. It also contains a proprietary brown coloured lightweight soil mixture with orange coloured porous ceramic granules.
Major components of the roofing systems are summarized in Table 1.
2.2.2 Instrumentation Locations
The locations of the eight garden plots are shown in Figure 1. Four garden plots, namely G1, G2, S1 and S2, were chosen for monitoring for several reasons. First, these four plots are further away from the east tower of the City Hall, thus were least affected by the shadow cast by the building. Second, the two plots near the east tower (S1 and S2) were mirror image of the other two selected plots (G1 and G2), and equivalent in size for direct comparison. Third, two of the plots contain system S and the other two contain system G, so comparison can be made between the two systems. The four garden plots selected also contain different depth of growing medium and plants. The initial soil depth during May 2002 ranged from 150 to 225 mm. They also contained different plants [Table 2]. These plots were selected to give a good representation of the different roofing systems, soil types and depths, as well as the plants used on the Toronto City Hall green roof. An original roof section, R, without the green roof, was also selected for reference purpose. Figure 2 shows the dimensions of these four garden plots and the locations where the instruments were installed (marked with an “X”).
2.2.3 Sensor Installation
Figure 3 shows the schematics of the cross-sections of the three roofing systems, Reference, Green Roof “S” and Green Roof “G”, and where the various sensors were embedded between different layers within the roofing system at each instrumentation location. This allows direct comparison of the measurements obtained from different layers between the five roof sections.
The temperature profile of the roofing system was measured by a network of thermocouples (TC) placed within the various components [Figure 3]. The placements of the thermocouples are further summarized in Table 3. A heat flux transducer (HFT)
membrane [Photo 3]. The thermocouple at level C1 was secured on the roof membrane and the separation layer was replaced [Photo 4]. The lower layer of the thermal insulation was replaced and a thermocouple and a heat flux transducer were installed at level C2 [Photos 5-7]. The upper layer of thermal insulation was then replaced and another thermocouple was installed at level C3 [Photos 8-9]. A new piece of filter fabric was secured in the opening.
The sensors in the soil (levers C4 and C5) were secured on a wooden “tee” fixture to make sure they are embedded at the correct depths [Photo 10]. All the wires from the sensors were then collected neatly into a flexible wire conduit before buried in the bottom of a trench in the garden [Photo 11]. Figure 4 shows how the wires were collected and bundled. The wire bundles were allowed to go under the concrete curb into the interlocking paver stone covered area [Photo 12]. The wires from the five instrumentation locations (i.e. S1, S2 G1, G2, and R) were directed into an underground wire path leading to the data acquisition system unit mounted on the parapet [Figure 2]. A combined temperature and relative humidity sensor was installed beside the data acquisition system to monitor the ambient conditions. The wires from all the sensors were connected into the data acquisition system [Photos 13-14]. Finally the plants and the interlocking paver stones were replaced.
In total, more than 70 sensors were installed, with more than 1000 m of wires connecting them to the data acquisition system for continuous monitoring. The data acquisition system was equipped with a modem, which allowed direct access and downloading of data remotely from NRC in Ottawa.
2.2.4 Monitoring Parameters
Temperature Profile
The outdoor temperatures and temperatures across the roofing systems were monitored by a network of thermocouples. Thermocouples were installed at different layers within the roofing systems [Figure 3] to monitor the temperature profile across the thickness of the roofing system and assessing the thermal performance of different roofing components. Because of operational constraints a proper weather station could not be installed on the rooftop. Therefore, outdoor temperature was monitored using a combined relative humidity and temperature (RH/T) sensor installed inside a radiation shield mounted beside the data acquisition system about 1 m from the roof surface and 1 m away from the parapet. The indoor temperature of the building was not monitored. Heat Flow
The heat flow through the roofing system was measured by a heat flux transducer (HFT) embedded between the two insulation layers within the roofing system. They measure the heat flux (energy per unit area per unit time) entering or leaving the building through the roof surface at any point of time. A positive flux represents heat entering the building while a negative flux shows heat leaving the building. The heat fluxes over any duration can be integrated to calculate the amount of heat gain or loss through the roof over that period of time. The heat flux transducers were installed at S1
and S2 only. This was intended to provide information of how soil depth affects energy efficiency of green roofs.
Soil Moisture Content
The moisture content of the growing medium at each plot was monitored by a granular matrix soil moisture sensor. Soil moisture data would have been useful for irrigation purposes, estimating evapotranspiration and to correlate with the temperature profile of the roofing system and stormwater retention. Unfortunately, the accuracy of these sensors was poor and the data could only be used qualitatively.
Data Acquisition System
Over 70 sensors were installed at the site, about half of which were monitored continuously while the rest – duplicates of thermocouples – were used as backup. All sensors were connected to a Campbell Scientific CR23X Data Acquisition System (DAS), which was programmed to scan all sensors every minute and compute the average every 15 minutes. The data were stored on a RAM chip on the CR23X, in a first-in-first-out fashion. The DAS can be accessed remotely via a telephone modem. It was programmed to download its data to a dedicated computer at NRC in Ottawa at a preset time every day. In most cases, the 15-minute averages were more than adequate for analytical purposes. However, 1-minute data provided more detail when the weather changed suddenly, such as a heavy rain or hailstorm.
2.3 Data Analysis
Final debugging of the DAS was completed and data collection started in May 2002. The data collected were analyzed and compared to assess the thermal performance of extensive green roofs. This report summarizes the data, observations and findings during the observation period: May 2002 to June 2003.
2.3.1 Temperature Profile
The location of the thermocouple network installed within the roofing systems is shown in Figure 3. For the Green Roofs (G1, G2, S1 and S2) and the Reference Roof (R), temperature was measured at three layers (C1-C3). On the Green Roofs (G1, G2, S1 and S2), the temperature in the growing medium was measured by two extra thermocouples – one at the bottom (C4) and the other in the middle (C5) of the growing medium. The ambient or outdoor temperature (OUT) was measured by a combined temperature and relative humidity sensor located near the data acquisition unit. The
the roofing system was evident from the increase in temperature measured at the two layers of insulation (C2 and C3). The temperature on the upper layer of insulation on the Reference Roof rose to 34°C during the hottest time of the day [Figure 5a] but that on the Green Roof was less than 18°C. This showed that the growing medium and the vegetation reduced the heat flow into the roofing system.
The temperature in the soil was affected by the fluctuations in ambient temperature. At the location S1 where the soil depth was about 175 mm, the temperature midway in the soil (at C4) rose to about 20°C in the afternoon but that at the bottom of the soil (at C5) was relatively steady at 15-16°C the whole day [Figure 5d]. At location S2 where the soil depth was slightly deeper (225 mm), the temperature midway in the soil (at C4) only rose to about 16°C in the afternoon, and that at the bottom of the soil (at C5) remained steady as in the case in S1 [Figure 5e]. The temperature of roofing system underneath the soil (C1-C3) was steadier for S2 than S1. This showed that the extra 50 mm of growing medium (and slight difference in plants) in S2 compared to S1 provided slightly better thermal performance.
The temperature in the soil for G1 and G2 was affected by the fluctuations in ambient temperature as well. It is surprising to find that although G2 contains deeper soil (175 mm), the temperature at the middle of the soil (C5) was higher than that of G1, which contains less soil (150 mm) [Figures 5b and 5c]. Also, there was not much difference between the temperatures at the bottom or midway in the soil (i.e. levels C5 and C4) at G2. The growing medium depths measured during a maintenance check in summer 2003 were 110 mm and 125 mm for G1 and G2, respectively. The proprietary growing medium used in the green roof system “G” was very susceptible to compaction and/or erosion. The thermocouples that were installed in the soil in G2 thus were moved up towards the surface during the monitoring period, giving temperature at higher levels in the soil than intended. In addition, the vegetation in this plot did not do well and the plot had been close to bare during the monitoring period. Because of the various factors affecting temperature readings at G1 and G2, the analysis that follows will focus on S1 and S2 only.
Summer Performance (June 22 – September 23)
On August 18, 2002, a typically hot and sunny summer day, the outdoor temperature (OUT) rose from 25°C in the morning to 30°C in the afternoon [Figure 6]. The temperature of the roof membrane remained steady at about 24°C under all roof sections monitored. The surface temperature of the upper insulation layer in the Reference Roof rose to 50°C due to absorption of solar radiation but that under the green roof was less than 30°C.
The temperature midway in the soil (C5) for S1 followed closely to the changes in ambient temperature, reached its peak at 30°C around 16:30. The temperature at the bottom of the soil (C4) for S1 followed the change with some delay and reduction in peak value – reaching its peak of 25°C around 21:30. The temperature of the lower components (C3 and C2) also followed the same trend but with further delay and reduction in peak value. This clearly indicated the effects of thermal mass of the growing medium. It is interesting to compare the temperature profile of S1 and S2 for the effects of soil depth. The trends are the same for the two systems. However, the
temperature mid-way in the soil (C5) reached its peak at 27°C around 18:15. The reduction in peak and peak shifting to the right were also observed in the other components (C2-C4) as well. This observation further confirmed the effects of thermal mass – the increase in soil depth of 50 mm (from 175 mm in S1 to 225 mm in S2) increased the thermal mass of the green roof system.
Fall Performance (September 23 – December 22)
On October 20, 2002, a typical fall day, the outdoor temperature (OUT) ranged from 5°C to 12°C [Figure 7]. The temperature of the roof membrane was steady at 20-21°C. Similar to the observations in spring, the temperatures of the insulation layers were less affected by the changes in ambient temperature due to the presence of the green roofs. The temperature on the surface of the upper layer of insulation of the Reference Roof peaked at 17°C but those of S1 and S2 were relatively steady at 11°C and 14°C. S2 was better in reducing heat loss from the building on this day, as indicated by the higher temperatures within the insulation layers (C2 and C3). The temperature midway in the soil followed more closely to the changes in the ambient temperature than that at the bottom of the soil. Also, the peak in temperature midway in the soil (C5) shifted from 14:15 in S1 to 17:30 in S2, again demonstrated the thermal mass effects of the soil as observed in the summer (although not as intense in the fall).
Winter Performance (December 22 – March 21)
On January 25, 2002, a typical winter day, the outdoor temperature (OUT) ranged from –8°C to –4°C throughout the day [Figure 8]. The roof membrane temperature remained steady at 15-17°C on the three roof sections monitored (R, S1 and S2). In the Reference Roof, the temperatures of the two insulation layers (C2 and C3) fluctuated somewhat slightly (within 2°C range). The temperatures of the insulation layers in the green roofs were noticeably higher and steadier than those in the Reference Roof, likely due to the insulation effects and thermal mass from the green roofs. Also, while the growing medium in S1 was completely frozen (soil temperature below –2°C), it was not the case in S2. The growing medium remained above freezing: 1°C at mid-way and 3.5°C at bottom. The deeper depth prevented the growing medium in S2 from freezing and thus provided extra insulation value for the roofing system. Also note that the temperature of the top of the insulation was about 3°C lower than that at the bottom of the growing medium. This indicated that the drainage layer (30 mm of polystyrene panel with holes and channels) provided extra insulation value to the green roof system.
temperature (5 to 10°C) on some days. It is possible that the green roof changed how water traveled in a protected membrane system. When the water reached the roof membrane, it lowered the membrane’s temperature. More investigation will be required to explain this observation. Table 4 shows the monthly median temperature fluctuations (i.e. the difference between the daily maximum and minimum) of the roof membrane in most case was less than 1°C. The low temperature fluctuation of the Reference Roof confirmed that the thermal insulation played a major role in protecting the roof membrane from temperature fluctuations and thus the associated thermal stresses. While green roofs have been shown to significantly reduce the temperature fluctuations of roofing membrane in conventional roofing systems [14], the effects are expected to be minimal in protected membrane systems because the thermal insulation is placed on top of the roofing membrane. Observations at the Toronto City Hall confirmed this.
2.3.3 Heat Flow
The heat flux through the roof was measured by a heat flux transducers (HFT) embedded in the insulation within each roof section. They measure the amount of heat flowing into or out of the building through the roof. They were calibrated such that a positive reading represents heat entering the building while a negative reading shows heat leaving the building. The heat flow across the roofing systems was influenced by many factors such as ambient temperature, snow coverage and solar radiation. In this section, the heat flow through the roof on the same days selected in Season 2.3.1 will be discussed.
Spring Performance (March 21- June 22)
On a typical spring day (May 10, 2003), the Reference Roof lost heat (negative heat flow) at a rate of around 5 W/m2 during early morning and late evening [Figure 13a]. However, the rate of heat loss decreased during the afternoon as the roof membrane absorbed the solar radiation. During the warmest part of the day, heat entered the building (positive heat flow) for about 6 hours, peaking at a rate of 12 W/m2. The amount of heat lost (area under the heat flux curve) was greater than heat gain through the roof on this typical spring day. On the other hand, the Green Roofs lost heat (negative heat flow) at a steady rate of about 2-3 W/m2 throughout the day. Careful observation showed that S2 had a slightly steadier heat loss than S1, confirming the thermal mass effects as observed in the temperature profile within the roofing system. Summer Performance (June 22 – September 23)
The heat flow through the roof in the summer was similar to that in the spring to a certain extent. On a typical summer day (August 18, 2002), heat left the building through the roof during the morning and the evening (negative heat flow) but entered the building in the afternoon (positive heat flow) [Figure 13b]. However, the time of heat gain was longer (11 hours) and at a higher intensity (peak at 19 W/m2) in the summer. This is expected due to the longer daylight hours and the higher solar radiation intensity typical of the summer. Heat gain was observed on Green Roofs S1 and S2 as well but the amount was very small (around 1 W/m2) compared to that of the Reference Roof.
temperature observed in the temperature profiles in Section 2.3.1. Also, the heat gain through S2 was slightly steadier than S1. This further confirmed that the growing medium and plants acted as a thermal mass, which moderated the heat flow across the roofing system.
Fall Performance (September 23 – December 22)
During the fall, heat left the building through the Reference Roof during the morning and the evening (negative heat flow) but entered the building in the afternoon (positive heat flow) [Figure 13c], very similar to the observation in the spring. On a typical fall day (October 20, 2002), the Reference Roof lost heat (negative heat flow) at a rate of around 6-8 W/m2 during early morning and late evening [Figure 13c]. However, the rate of heat loss decreased during the afternoon as the roof membrane absorbed the solar radiation. Heat entered the building (positive heat flow) for only about 4 hours, peaking at a rate of 5 W/m2. The heat loss was significantly greater that the heat gain as expected for the shorter daylight hours and lower temperature typical of the fall. Heat left the building through the Green Roofs S1 and S2 at moderate but relatively rate of 3.5-4.5 W/m2. Again, the deeper soil depth of S2 provided a slightly steadier heat flow than S1.
Winter Performance (December 22 – March 21)
On a typical winter day (January 25, 2002), heat loss was observed on the Reference Roof and the Green Roofs [Figure 13d]. The Reference Roof lost heat at a higher rate in the morning (-7.5 W/m2) than in the afternoon (-6.0 W/m2) due to absorption of solar energy. Heat loss through the two green roofs was steady: -7.0 W/m2 for S1 and -5.0 W/m2 for S2. This observation was consistent with the stable temperature profiles observed within the roofing systems. The growing medium in S2 was not frozen due to its greater depth (that in S1 was frozen), thus providing higher insulation value to the roofing system.
2.3.4 Energy Efficiency
To compute the heat flow through the Reference and Green Roofs the heat flux curve obtained from each heat flux transducer was integrated over time each day to obtain the daily heat flow per unit roof area (kWh/m2/day). This is equivalent of calculating the area under a heat flux curves [Figure 14]. The positive areas, heat gain per unit roof area and the negative areas, heat loss per unit roof area, were computed separately. The daily heat flow through each unit area of the roof section was further averaged by each month to smooth out day-to-day variations [Figure 15].
0.15 kWh/m2/day. This is a reduction in heat loss of 0.3-0.5 kWh/m2/day on the average, or about 30%. This is consistent with the observation of the daily heat flux data in Section 2.3.2. This demonstrated that the extensive green roofs reduced heat flow between the building and the outdoor environment in the fall/winter and that the thicker medium of S2 (50 mm extra) provided a slightly better thermal performance. Since the vegetation was dormant during the fall and winter, most of the thermal benefit was derived from the insulation value of the growing medium and the drainage layer in the green roofs.
During the spring and summer (May – September 2002 and April – June 2003), the building gained heat through the Reference Roof during the day but lost heat at night as discussed in Section 2.3.2. Daily heat loss was greater than heat gain on the average in April and May but this trend reversed from June to September. The normalized average heat loss/gain ranged from 0.05-0.12 kWh/m2/day for the Reference Roof during this spring/summer. The heat flow through the Green Roofs was low compared to that of the Reference Roof. No heat gain was observed in April and May. The heat gain/loss during June to September was less than 0.02 kWh/m2/day, which is significantly lower than the heat gain/loss of the Reference Roof (0.05-0.10 kWh/m2/day), a reduction of 0.03-0.08 kWh/m2/day. The difference between S1 and S2 was small during this period. This demonstrated that the extensive green roofs were more effective in reducing heat flow between the building and the outdoor environment in spring and summer than in the fall and summer.
Note that the energy demand reduction discussed in this section was estimated based on heat flow through the roof only. It did not take into account of the heat flow through the other parts of the building envelope (e.g. walls and windows) as well as other energy requirements such as lighting and ventilation. Therefore, the percent reduction could not be applied for the space conditioning energy use for the whole building. Also, the energy demand did not represent the actual energy used for space conditioning in the building because the actual dollar saving depends on the type and efficiency of the heating and cooling equipment and the heating/cooling distribution systems, which are building specific.
The heat flow between a building and its environment creates energy demand for space conditioning. Assuming the temperature inside the building was kept constant, any heat entering the building has to be removed by the air conditioning unit and any heat leaving the building has to be made up by the furnace. The operation of the heating and cooling devices create energy demand for space conditioning. Therefore, the energy demand for space conditioning due to the roof can be estimated by the sum of the heat entering and leaving through the roof, or by adding the heat flow through the roof in absolute value.
The average daily space conditioning energy demand due to heat flow through the roofs is summarized in Table 6 and plotted in Figure 16. The average energy demand due to heat flow through the Reference Roof ranged from 0.12-0.18 kWh/m2/day during this observation period. The Green Roofs consistently reduced this energy demand of the building throughout the year – more in the spring and summer and less in the winter. The reduction of the average daily space conditioning energy demand due to the green
fall/winter and 50-90% in spring/summer. This again confirmed that the two extensive green roofs improved the energy efficiency of the roofing system – more so in the warmer period in the year. Within experimental uncertainty, S2 performed equal or slightly better (less than 5%) than S1 during this observation period [Figure 17]. S2 performed significantly better than S1 during the winter (January – March 2003), reducing the heat flow through the Reference Roof by an extra 10%. It was noticed that while the growing medium (175 mm) in S1 was frozen, the deeper growing medium (225 mm) in S2 did not. The deeper growing medium provided extra insulation value to the roofing system.
Since the performance of green roofs vary with the seasons, it is important to look at the annual performance. The data from May 1, 2002 to April 30, 2003 were used in computing the annual energy efficiency of the green roofs. The cumulative energy demand of the building due to the Reference Roof and the Green Roofs are shown in Figure 18. The curves for the Green Roofs S1 and S2 diverged quickly from that of the Reference Roof during the start of the observation period – May 2002, i.e. the Green Roofs significantly reduced the heat flow between the building and the environment. The difference at the end of the summer (September 2002) was significant. The three curves increased at approximately the same rate from October 2002 to March 2003, indicating the energy efficiency of the Green Roofs dropped during the fall and winter. However, the diversion was again observed in April 2003, similar to that in May 2002. The difference in space conditioning energy demand was 24 kWh/m2 for S1 and 26 kWh/m2 for S2 over one year (May 2002 – April 2003) of the observation period. Compared to the Reference Roof’s annual space conditioning energy demand of 52 kWh/m2, the Green Roofs reduced it by about 50%.
Green roofs reduced the space conditioning energy demand by reducing heat flow through the roofing systems. Figure 19 divided the total heat flow through the roof by heat gain (positive values) and heat loss (negative values). A large portion of the heat flow through the roof was due to heat loss, about 30% for the Reference Roof. The Green Roofs reduced both heat gain and heat loss through the roofing systems, however, the extent was higher for reducing the later. Figure 20 showed the percent reduction of heat gain/loss due to the Green Roofs. They reduced the heat gain by over 90% but heat loss by only about 30%.
2.4 Other issues
Compaction and/or erosion of the growing medium was observed in the Toronto City Hall green roofs. During the start of the project in May 2002, the depths of the growing
3. Eastview Neighbourhood Community Centre – East York, Toronto 3.1 Features
The Eastview Neighbourhood Community Centre is located in East York, Toronto [Photo 15]. It is surrounded mostly by low-rise residential and commercial buildings, with a high-rise residential building on one side. The green roof was established on the top of the community centre’s gymnasium. It has an area of about 460m2 and is divided length-wise into two sections where two extensive green roof systems were installed [Photo 16]. It is dedicated as a research site. It is not accessible by the public due to operational constraints. However, it can be viewed and enjoyed by the residents in the nearby high-rise building.
The roof was constructed as a conventional roofing system where the thermal insulation was covered by the roofing membrane. Because of the limited loading capacity of the structure, two lightweight extensive green roof systems with shallow growing medium were selected. The green roof installation was done in several stages due to administrative logistics. Re-roofing was completed in 2001 where new roofing membranes were laid. The green roof was installed in May 2002 and a dripping irrigation system was also laid in the growing medium. Finally, sedums were planted in August 2003. Therefore, during the observation period for this report (May 2002 – June 2003), the green roof did not contain vegetation.
3.2 Instrumentation
The roof was instrumented to measure the temperature profile and heat flow across the roofing system and the soil moisture content by embedding various sensors within the roofing systems. A weather station was installed on the rooftop to monitor atmospheric conditions such as temperature, relative humidity, precipitation, solar radiation intensity and atmospheric carbon dioxide concentration. The sensors are connected to a data acquisition system, which can be remotely accessed from NRC in Ottawa, for continuous monitoring. These sensors provide thermal performance data for energy efficiency quantification of green roof systems. Also, combined temperature and relative humidity sensors were installed close to the roof surface to provide information about the microclimate created by the green roofs. In addition, the City of Toronto’s Works Department modified by the drainage pipes to measure the volume of runoff from the roofs in spring 2003.
3.2.1 Roofing Systems
The gymnasium roof was constructed as a conventional roofing system, where the roof membrane was placed on top of the thermal insulation. During re-roofing, the roofing system was stripped to the steel deck level. New roofing components were installed – gypsum board, vapour retarder, thermal insulation, fibreboard and modified bituminous membrane. This is the Reference Roof.
mixture, which contained small light grey granules. This system has the same components as Green Roof System G at the Toronto City Hall except for the growing medium.
The Green Roof System S was the same as that used at the Toronto City Hall. The modified bituminous membrane was formulated with a root-repelling agent. This system consists of an expanded polystyrene drainage panels and a geotextile filter fabric. It also contains a proprietary brown coloured lightweight soil mixture with orange coloured porous ceramic granules.
Major components of the roofing systems are summarized in Table 7.
3.2.2 Instrumentation Locations
The green roof was located on the Northeast section of the Eastview Neighbourhood Community Centre [Figure 21]. Being above the gymnasium, this roof section (about 32 m X 18 m) was at a higher elevation than the other roof sections above the offices. The Green Roof was located above the gymnasium while the Reference Roof was located above the mechanical room next to the gymnasium. Three locations were selected on each green roof section for monitoring. A roof section, R, without the green roof, was also selected for reference purpose. Figure 22 shows the dimensions of the Green Roof and the Reference Roof and the locations where the instruments were installed (marked with an “X”).
3.2.3 Sensor Installation
Figure 23 shows the schematics of the cross-sections of the three roofing systems, Reference, Green Roof “S” and Green Roof “G”, and where the various sensors were embedded between different layers within the roofing system at each instrumentation location. This allows direct comparison of the measurements obtained from different layers between the three roof sections R, S and G.
The temperature profile of the roofing system was measured by a network of thermocouples (TC) placed within the various components [Figure 23]. The placements of the thermocouples are further summarized in Table 8. Heat flux transducers (HFT) were embedded on between the thermal insulation and the fibreboard to measure the heat flux through the roof. The soil moisture was measure by a moisture sensor (SM) placed in the growing medium. All sensors were connected to a data acquisition system for continuous monitoring. The data acquisition system was equipped with a modem,
Phase 1
The installation of the instrumentation was executed in such a way that no wire had penetrated the roofing membrane, as its continuity must be maintained to remain watertight [Figure 24]. All sensors that were installed below the roofing membrane within the roofing system were collected through a small opening in the steel deck into the building and secured under the ceiling of the gymnasium. All sensors that were installed above the roof membrane were collected and led into the building through an instrumentation port made from a standard roof protrusion.
Roof cuts were made at the instrumentation locations to allow sensor installation (levels E1-E3) within the roofing system. The roofing contractor first removed the components, layer by layer, until the steel deck was reached [Photo 17]. A small hole was drilled in the steel deck to allow the instrumentation wires to pass through. The roof components were then replaced, layer-by-layer, with sensors embedded between them [Photos 18-20]. Finally, the roofing contractor repaired the roof cut by torching on a new piece of membrane [Photos 21-22]. Note that no wire was allowed to penetrate the roof membrane to ensure its continuity. The wires leading from the sensors embedded in the roofing system were passed into the gymnasium [Photo 23]. They were collected into bundles and secured on the ceiling. They were then directed from the gymnasium, through a conduit drilled in the wall, to the adjacent mechanical room where the data acquisition system was located. A weather station was installed at the parapet where the Reference Roof and the two Green Roofs met. The local atmospheric conditions such as temperature, relative humidity, rainfall and solar radiation on the rooftop were monitored continuously.
Phase 2
The sensors in the soil (levers E4 and E5) were secured on a wooden “tee” fixture to make sure they are embedded in the correct depth [Photo 25]. The wires were placed under the filter membrane to minimize accidental damage due to gardening [Photo 26]. All the wires from the sensors above the roof membrane were collected and passed indoor through a roof protrusion in the Reference Roof [Photo 27]. Photo 28 shows the weather station located at the intersection of the Reference Roof and the two green roofs. Figures 24-25 show how the wires from different instrumentation areas were directed to the data acquisition system located in the mechanical room. After the sensors and the wires were secured, the contractors added the growing medium on the green roofs and installed the drip irrigation system [Photos 29-32].
3.2.4 Monitoring Parameters
Temperature Profile
The temperature across the roofing systems and the indoor temperature were monitored by a network of thermocouples. Thermocouples were installed at different layers within the roofing systems [Figure 23] to monitor the temperature profile across the thickness of the roofing system and assess the thermal performance of different roofing components. The outdoor temperature was monitored by a combined relative
the weather station located about 1.5 m from the roof surface at the intersection between the Reference Roof and the two Green Roofs.
Heat Flow
The heat flow through the roofing system was measured by heat flux transducers (HFT) embedded between the insulation and the fibreboard within the roofing system. They measure the heat flux (energy per unit area per unit time) entering or leaving the building through the roof at any point of time. They were calibrated such that a positive reading represents heat entering the building while a negative reading shows heat leaving the building. The heat fluxes over any duration can be integrated to calculate the amount of heat gain or loss through the roof over that period of time.
Soil Moisture Content
The moisture content of the growing medium at each plot was monitored by a granular matrix soil moisture sensor. Soil moisture data would have been useful for irrigation purposes, estimating evapotranspiration and to correlate with the temperature profile of the roofing system and stormwater retention. Unfortunately, the accuracy of these sensors was poor and the data could only be used qualitatively.
Rooftop Microclimate
A combined RH/T sensor was placed just above the roof surface (by attaching to the wooden “tee”) at R, S1 and G1. Dark roof surfaces absorb solar radiation and re-emit the energy as long wave radiation such as heat, which increases the temperature of the surface layer of air above the roof. However, green roof has the potential to convert the energy absorbed into latent heat through evapotranspiration of the plants and cool down the surface layer of air above the roof, thus creating a unique microclimate. These sensors were intended to look at these effects.
Stormwater Runoff Measurement
Each green roof and reference roof section contains one drain where all water from that section goes [Figure 22]. The City of Toronto’s Work Department modified the pipes to measure the stormwater runoff. A new pipe was installed side-by-side to the old pipe under the ceiling of the gymnasium to separate the runoff form the two green roofs [Photo 33]. The runoff from the three roof sections were directed into three flow meters, installed on the up arm of a U-shaped pipe, before being discharged outside [Photo 34]. The flow meters were connected to a dedicated data acquisition unit maintained by the City of Toronto. Data on the stormwater runoff will be available from the City of Toronto when the analysis was completed.
preset time every day. In most cases, the 15-minute averages were more than adequate for analytical purposes. However, 1-minute data provided more detail when the weather changed suddenly, such as a heavy rain or hailstorm.
3.3 Data Analysis
Final debugging of the DAS was completed and data collection started at the end of May 2002. The data collected were analyzed and compared to assess the thermal performance of the two extensive green roofs. This report summarizes the data, observations and findings during the observation period: May 2002 to June 2003.
3.3.1 Temperature Profile
The location of the thermocouple network installed within the roofing systems are shown in Figure 23. For the Green Roofs (G1- G3 and S1-S3) and the Reference Roof (R), temperature was measured at four layers (E0-E3). On the Green Roofs (G1- G3 and S1-S3), the temperature in the growing medium was measured using two extra thermocouples – one at the bottom (E4) and the other at 25 mm above the bottom of the growing medium (E5). The ambient temperature (OUT) was measured by a combined temperature and relative humidity (RH/T) sensor installed on the weather station. The placement of the thermocouples and the symbols for the layers are described in Table 8. In this section, typical days will be selected to represent the typical temperature profile in the roofing systems recorded during the observation period. Note that there was no vegetation planted on the green roof during the
observation period, therefore, the thermal performance observed was due to the growing medium only.
Membranes Only - Without Green Roofs
Phase 1 instrumentation was completed in mid May 2002 and the green roof was not installed until mid July 2002. Therefore, the roof membranes of the three sections (R, S and G) were exposed for the two months in between. This provided a good opportunity to compare the observations from the bare roof sections.
Figure 26 shows the temperature profile across the roofing system of the three roof sections R, S and G on May 28, 2002. The ambient temperature rose from 12°C in early morning to 25°C in the afternoon. The temperature profiles were similar for the three roof sections. The roof membrane absorbed solar radiation and its temperature (E3) rose and peaked in the afternoon (when the solar radiation intensity was the strongest). The temperature on top of the thermal insulation (E2) closely followed that of the membrane. The temperature of below the insulation (E1) and the indoor temperature (E0) were relatively steady, peaked only slight later in the afternoon.
The roof membrane on the Reference Roof and the Green Roof S were surfaced with grey coloured granules. However, the roof membrane Green Roof G was smooth surfaced (no granules) and black in colour. The roof membrane temperature peaked at
66 and 72°C for the Reference Roof, Green Roof S and Green Roof G, respectively. There were rooftop equipments such as vents and HVAC units on the Reference Roof. Although the instrumentation location was selected such that it was not shaded by them most of the time, shading of the vicinity on the same section might have lowered the temperature of the Reference Roof slightly. On the other hand, the instrumentation location (S2) on Green Roof S was out in the open, fully exposed. This could explain the difference of 3°C between the Reference Roof and the Green Roof S even though their colours were similar. The black colour of the roofing membrane on Green Roof G increased the peak temperature by another 6°C (compared to Green Roof S).
Spring Performance (March 21- June 22)
On a typical spring day (May 15, 2003), the outdoor temperature rose from 8°C in early morning to 16°C in the afternoon [Figure 27a]. The incident solar radiation was 17.7 MJ/m2/day with a peak 15-minute average value of over 900 W/m2. On the Reference Roof, the membrane absorbed the solar radiation and its temperature rose to 48°C around noon [Figure 27b]. On the other hand, the Green Roof membrane temperature ranged from 9-18°C. The membrane temperature was reduced because of the shading, insulation, evapotranspiration and thermal mass effect provided by the growing medium (no vegetation was planted in the garden yet) on the Green Roofs. The shift in temperature profile of the various components in Green Roof G was clear [Figure 27d]: the ambient temperature peaked at 12:00, followed by the temperature in the middle of the soil (E5) 2 hours later (at 14:30), then by the temperature of the bottom of the soil (E4) another 2 hours later (at 16:30), finally by the roof membrane (E3) 2.5 hours later (at 19:00). A similar shift pattern was also observed for Green Roof S [Figure 27c]. However, the temperature in the middle of the soil (E5) peaked at 13:30, an hour earlier compared to Green Roof G. Also, the temperature at the bottom of the soil (E4) peaked an hour later (at 14:30), instead of 2 hours later as in Green Roof G. This further confirmed the insulation and thermal mass provided by the growing medium because Green Roof G (100 mm) contained more growing medium than Green Roof S (75 mm). Also, it showed the growing medium provided significant thermal benefit to a green roof system. It is interesting to note that the roof membrane temperature was steadier under Green Roof G (12-17°C) than Green Roof S (10-18°C) throughout the day. The extra growing medium (25 mm) provided higher thermal mass for Green Roof G. Also, the darker growing medium in Green Roof S (orange-brown) absorbed more solar energy than the lighter growing medium in Green Roof G (light grey).
It is noted that during mid-day when the solar radiation was strong and the ambient temperature was highest (10:00-14:00), the temperature of the roof membrane was
Although the Reference Roof and the Green Roofs were installed adjacent to each other, however, the indoor environment was different because of the different usage. The Reference Roof was installed on top of the mechanical room, which had a higher temperature (about 3-4°C) than the gymnasium, where the Green Roof was installed. Since heat flow through the roof is proportional to the temperature difference across the roofing system (i.e. indoor and outdoor temperatures), the driving force for heat transfer is higher for the Green Roofs than for the Reference Roof. Therefore, the energy saving data generated for the Green Roofs would be underestimated slightly.
Summer Performance (June 22 – September 23)
On a typical summer day (June 26, 2003), the outdoor temperature rose from 22°C early morning to 32°C in the afternoon. The incident solar radiation was 28.7 MJ/m2/day with a peak 15-minute average value of over 900 W/m2 [Figure 28a]. On the Reference Roof, the roof membrane absorbed solar energy and its temperature quickly rose from 18°C to 66°C [Figure 28b]. The indoor temperature under the green roof also reached as high as 38°C.
Both green roof systems lowered the temperature experienced by the roof membrane. The roof membrane temperature peaked at 38°C at 18:30 for Green Roofs S and 36°C at 19:30 for Green Roof G [Figures 28c-d]. Because Green Roof G had deeper growing medium than Green Roof S, the temperature of the growing medium in S rose quickly in comparison and the temperature at E5 and E4 in S also followed together closely. These observations again proved that the deeper growing medium in Green Roof G provided extra insulation and thermal mass to the green roof system.
It was also noted that the temperature of the roof membrane in Green Roof G followed closely to that of the bottom of the growing medium throughout the day – the difference was less than 1°C. On the other hand, there was a shift of about 2 hours between the temperatures of the roof membrane in Green Roof S and the bottom of the growing medium. The temperature difference across the drainage panel was about 4°C. This indicated that the drainage layer of Green Roof S provided extra insulation to the green roof system.
Fall Performance (September 23 – December 22)
On a typical fall day (October 15, 2002), the outdoor temperature ranged from 6-16°C. The incident solar radiation was 12.3 MJ/m2/day with a peak 15-minute average value of about 640 W/m2 [Figure 29a]. On the Reference Roof, the temperature of the roof membrane ranged from 4°C in early morning to 24°C in the afternoon [Figure 29b]. The Green Roofs moderated the temperature experienced by the roof membrane to 7-16°C throughout the day. The thermal mass of the deeper growing medium in Green Roof G could be seen by the temperature changes measured in the growing medium (E5 and E4) [Figures 29c-d]. The temperature at E5 was 1°C in the early morning for Green Roof S but 4°C for Green Roof G. It reached a maximum of 18°C in the afternoon for Green Roof S but only 14°C for Green Roof G. The extra growing medium in Green Roof G provided additional insulation and thermal mass to the green roof system to reduce temperature changes. The better insulation capacity of the drainage layer in Green Roof S can be seen by the temperature difference between the roof membrane
Roof G provided less thermal insulation value as indicated by the small temperature difference across the drainage layer.
The indoor temperature of the Reference Roof (installed over the mechanical room) was about 2-3°C higher than that of the Green Roof (installed over the gymnasium). Similar observation was seen in spring as well. Since heat flow through the roof is proportional to the temperature difference across the roofing system, the energy saving data generated for the Green Roofs would be underestimated slightly.
Winter Performance (December 22 – March 21)
On a typical winter day (January 5, 2003) with light snow coverage (less than 25 mm deep), the outdoor temperature hovered just below 0°C. The incident solar radiation was low: 2.0 MJ/m2/day with a peak 15-minute average value of about 150 kJ/m2 [Figure 30a]. The temperature of the roof membrane on the Reference Roof was stable at around 0°C throughout the day [Figure 30b]. The growing media in the two Green Roofs were frozen, as indicated by the temperatures measured at midway and bottom of the soil (E5 and E4), which were around 0°C [Figures 30c-d]. The roof membrane temperatures under the green roofs were stable throughout the day, at 4°C and 2.5°C for Green Roof S and Green Roof G, respectively. Since the frozen growing media did not provide much insulation value, this showed that the drainage layer in Green Roof S provided higher insulation value than that in Green Roof G. Although the polystyrene panels in Green Roof S contained holes and channels for drainage, they nevertheless provided higher insulation value than the semi-rigid polymeric drainage mat in Green Roof G.
Note that the indoor temperature of the Green Roof was cooler in the early morning (20°C) but warmer later in the day (25°C), possibly due to operation needs of the gymnasium. However, the temperature of the mechanical room was maintained at about 20°C throughout the day. This higher indoor temperature under the green roof increased the temperature difference across the roofing system; therefore, the energy saving data generated for the Green Roofs would again be underestimated slightly. On another cold sunny winter day (February 15, 2003) without snow coverage, the outdoor temperature ranged from –15 to -10°C. The incident solar radiation was 11.6 MJ/m2/day with a peak 15-minute average value of about 600 kJ/m2 [Figure 31a]. The roof membrane on the Reference Roof absorbed the solar energy and rose from -15°C in the early morning to -3°C in the afternoon [Figure 31b]. The growing media were frozen but their temperature rose in the afternoon due to the solar radiation as well. Although the temperature of the bottom of the soil measured in Green Roof S was lower than that in Green Roof G by about 1-2°C, the roof membrane temperature under