Publisher’s version / Version de l'éditeur:
Clinical and Diagnostic Laboratory Immunology, 11, September 5, pp. 977-982,
2004
READ THESE TERMS AND CONDITIONS CAREFULLY BEFORE USING THIS WEBSITE. https://nrc-publications.canada.ca/eng/copyright
Vous avez des questions? Nous pouvons vous aider. Pour communiquer directement avec un auteur, consultez la première page de la revue dans laquelle son article a été publié afin de trouver ses coordonnées. Si vous n’arrivez pas à les repérer, communiquez avec nous à PublicationsArchive-ArchivesPublications@nrc-cnrc.gc.ca.
Questions? Contact the NRC Publications Archive team at
PublicationsArchive-ArchivesPublications@nrc-cnrc.gc.ca. If you wish to email the authors directly, please see the first page of the publication for their contact information.
NRC Publications Archive
Archives des publications du CNRC
This publication could be one of several versions: author’s original, accepted manuscript or the publisher’s version. / La version de cette publication peut être l’une des suivantes : la version prépublication de l’auteur, la version acceptée du manuscrit ou la version de l’éditeur.
For the publisher’s version, please access the DOI link below./ Pour consulter la version de l’éditeur, utilisez le lien DOI ci-dessous.
https://doi.org/10.1128/CDLI.11.5.977-982.2004
Access and use of this website and the material on it are subject to the Terms and Conditions set forth at
Antigen-Specific Gene Expression Profiles of Peripheral Blood
Mononuclear Cells Do Not Reflect Those of T-Lymphocyte Subsets
McLaren, Paul J.; Mayne, Michael; Rosser, Stuart; Moffatt, Teri; Becker,
Kevin G.; Plummer, Francis A.; Fowke, Keith R.
https://publications-cnrc.canada.ca/fra/droits
L’accès à ce site Web et l’utilisation de son contenu sont assujettis aux conditions présentées dans le site LISEZ CES CONDITIONS ATTENTIVEMENT AVANT D’UTILISER CE SITE WEB.
NRC Publications Record / Notice d'Archives des publications de CNRC:
https://nrc-publications.canada.ca/eng/view/object/?id=dd91abd8-4308-45ff-9627-3cf1a0e074ba
https://publications-cnrc.canada.ca/fra/voir/objet/?id=dd91abd8-4308-45ff-9627-3cf1a0e074ba
1071-412X/04/$08.00⫹0 DOI: 10.1128/CDLI.11.5.977–982.2004
Copyright © 2004, American Society for Microbiology. All Rights Reserved.
Antigen-Specific Gene Expression Profiles of Peripheral Blood
Mononuclear Cells Do Not Reflect Those
of T-Lymphocyte Subsets
Paul J. McLaren,
1Michael Mayne,
2Stuart Rosser,
1,3Teri Moffatt,
2Kevin G. Becker,
4Francis A. Plummer,
1and Keith R. Fowke
1*
Department of Medical Microbiology,1Department of Pharmacology and Therapeutics,2and Department of Internal Medicine, Section of Infectious Diseases,3University of Manitoba, Winnipeg, Canada,
and DNA Array Unit, National Institute on Aging, Bethesda, Maryland4
Received 23 April 2004/Returned for modification 28 June 2004/Accepted 1 July 2004
Advances in microarray technology have allowed for the monitoring of thousands of genes simultaneously. This technology is of particular interest to immunologists studying infectious diseases, because it provides tremendous potential for investigating host-pathogen interactions at the level of immune gene expression. To date, many studies have focused either on cell lines, where the physiological relevance is questionable, or on mixed cell populations, where the contributions of individual subpopulations are unknown. In the present study, we perform an intrasubject comparison of antigen-stimulated immune gene expression profiles between a mixed population of peripheral blood mononuclear cells (PBMC) and the two predominant cell types found in PBMC, CD4ⴙand CD8ⴙ T lymphocytes. We show that the microarray profiles of CD4ⴙand CD8ⴙ T
lymphocytes differ from each other as well as from that of the mixed cell population. The independence of the gene expression profiles of different cell types is demonstrated with a ubiquitous antigen (Candida albicans) as well as with a disease-specific antigen (human immunodeficiency virus p24). This study has important implications for microarray studies of host immunity and underscores the importance of profiling the expres-sion of specific cell types.
Microarray technology has become a widely used tool to define host cell gene expression changes in response to infec-tious diseases. Many in vitro (4, 13) and in vivo (5, 6) studies have provided information about mechanisms of pathogenesis and host responses to pathogens. These studies have proven the utility of microarrays, not only to define genes of interest, but to implicate these genes in novel pathways (27). However, in order to make the most relevant conclusions regarding mi-croarray data, the choice of appropriate starting material is crucial. Prior microarray studies of host cell infection and im-mune cell response in chronic and infectious disease research have focused mainly on either cell culture models (13, 14, 23, 28), where the physiological relevance is indirect at best, or on mixed cell populations (5, 15, 30, 34), where the contribution of the individual cell types is difficult to determine.
The use of peripheral blood mononuclear cells (PBMC) as starting material in microarray experiments is convenient, be-cause sufficient numbers of cells can be obtained to harvest the considerable amount of RNA required for the microarray pro-cedures (36). However, this mixed population consists of sev-eral cell types: CD4⫹
and CD8⫹
T lymphocytes (70%), B lymphocytes (15%), natural killer cells (10%), monocytes (5%), and dendritic cells (⬍1%) (1), each expressing a unique set of genes. It is conceivable that large alterations (several log units) in a gene expressed predominantly in an underrepre-sented cell type may be overlooked upon examination of the
PBMC population. Recent studies have alluded to the fact that the cell types constituting the lymphocyte population show different gene expression profiles (16, 36), but to date no study has performed a direct intrasubject comparison of gene expres-sion by T-lymphocyte subsets and the whole PBMC popula-tion.
In this study our goal was to determine, within the same individual, the unique gene expression profiles of whole PBMC populations, CD4⫹
T lymphocytes, and CD8⫹
T lymphocytes in response to antigen-specific stimulation. We chose to eval-uate the immune gene expression responses to the common recall antigen Candida albicans and to a pathogen-specific an-tigen, the human immunodeficiency virus (HIV) core protein p24. This analysis was performed for two individuals, one with a normal immune response and one in the context of HIV infection. T lymphocytes were chosen because they drive anti-gen-specific responses and because they represent the majority of cells in the PBMC population and therefore would be most likely to have expression profiles similar to those of the mixed population. Our results indicate that there is significant intra-subject variability in the gene expression profiles of CD4⫹
T lymphocytes and CD8⫹T lymphocytes and that this variability could not be inferred from the gene expression profile of PBMC.
MATERIALS AND METHODS
Sample collection and processing.Fifty milliliters of blood was collected from an otherwise healthy (CD4 count, ⬎800) HIV-infected individual and from an age- and sex-matched uninfected control individual. The blood was collected into tubes containing sodium heparin at the St. Boniface General Hospital Ambula-tory Care Facility and the University of Manitoba, respectively. PBMC were * Corresponding author. Mailing address: Department of Medical
Microbiology, University of Manitoba, 539-730 William Ave., Win-nipeg, Manitoba, Canada R3E 0W3. Phone: (204) 789-3818. Fax: (204) 789-3926. E-mail: fowkekr@cc.umanitoba.ca.
977
at Canada Institute for STI, National Research Council on June 29, 2009
cvi.asm.org
isolated from whole blood by Ficoll density gradient centrifugation using stan-dard methods. Isolated cells were counted and tested for viability by trypan blue exclusion prior to culture.
Cell culture and T-lymphocyte subset purification.To allow normal antigenic processing, presentation, and cell type interaction, we performed all antigen stimulations in whole PBMC populations. Prior to the isolation of separate cell types, PBMC were incubated at 2.0 ⫻ 106per ml in RPMI–10% fetal calf serum
plus 2% penicillin-streptomycin. PBMC were either stimulated with heat-killed, noninfectious C. albicans (Grier Laboratories) at 10 g/ml or with recombinant HIV p24 protein produced in our lab at 1 g/ml or, as a control, were left in the medium for 24 h at 37°C under 5% CO2. Following stimulation, the cells were
collected, washed twice in phosphate-buffered saline plus 2% fetal calf serum, and split into three groups for subpopulation purification. Highly purified pop-ulations of CD4⫹or CD8⫹T lymphocytes were obtained by using a magnetic
bead purification procedure (StemCell Technologies, Vancouver, British Colum-bia, Canada) according to the manufacturer’s instructions. PBMC were exposed to a mixture of cell type-specific antibodies for negative selection of either CD4⫹
or CD8⫹T lymphocytes, followed by binding of a magnetic bead-coupled
sec-ondary antibody. Cells were passed over columns in the presence of a magnetic field for purification. In our hands, purified cell populations have consistently been shown to be ⬎95% pure by flow cytometry (data not shown).
RNA isolation and quantification.For both study individuals, total cellular RNA was isolated from 106cells in each group (PBMC, CD4⫹T lymphocytes,
and CD8⫹T lymphocytes) for all three stimulation conditions (medium alone, C.
albicans, and p24) by using RNeasy minikits (QIAGEN) according to the man-ufacturer’s instructions. RNA quantity was measured by UV spectrometry, and RNA quality was assayed by amplification of mRNA by glyceraldehyde phos-phate dehydrogenase reverse transcription-PCR (data not shown).
Microarray hybridization.Immune microarrays were obtained from the Na-tional Institute on Aging. The array used represented 4,608 immunologically relevant cDNAs spotted in duplicate (further information on the array is avail-able at http://www.grc.nia.nih.gov/branches/rrb/dna/array.htm). RNA labeling and array hybridization were carried out as described elsewhere (10, 35). Briefly, 1 g of total cellular RNA from each sample was reverse transcribed by using oligo(dT) primers and labeled with [33P]dCTP (NEN) by using LabelStar Array
kits (QIAGEN) according to the manufacturer’s instructions. Labeled cDNA was hybridized to the arrays in 5 ml of Microhyb (ResGen) buffer in the presence of poly(A) (Sigma) and human cotI DNA (Invitrogen) at 42°C for 18 h. Arrays were washed in 2⫻ SSC (1⫻ SSC is 0.15 M NaCl plus 0.015 M sodium citrate) plus 1% sodium dodecyl sulfate twice, for 15 min, and exposed to Molecular Imager imaging screens (Bio-Rad) for 24 h. Images were obtained by using the Personal Fx Phosphorimager and Quantity One software (both from Bio-Rad). Spot values were quantified by using ArrayPro software.
Microarray analysis.Quantified data files were exported to Microsoft Excel to undergo averaging of duplicate spots and prefiltering. Any duplicate spots with values that had a variance of ⬎20% were eliminated from further analysis. The remaining data were transferred to GeneSpring (Silicon Genetics) for normal-ization and comparison. Individual arrays were normalized in two ways. The data for each array were first normalized to the distribution of all genes on that array (per-chip normalization) to account for variation across the individual arrays. The data were next normalized to the median value for each individual gene across all arrays (per-gene normalization) in order to control for variation be-tween different arrays. Gene expression values were considered to be changed as a result of stimulation if normalized values from the stimulated (C. albicans or p24) condition were twofold greater than or twofold less than those from the unstimulated (medium-alone) condition. Lists of changed genes (both up-regu-lated and down-reguup-regu-lated) were created for each patient by cell type and stim-ulation condition and were compared by Venn diagrams using GeneSpring software. Quantified raw data files for all arrays are available at http://hivgroup .medmb.umanitoba.ca/HIVwebsite/fowkelab4.htm.
Array repeatability.PBMC were collected from five control individuals, and the extracted RNA was pooled to create a large amount of sample RNA that could be run several times. To determine the repeatability of our array proce-dure, pooled total RNA was hybridized on three separate occasions to the nylon arrays as described above, and concordance was measured. After data filtering (removal of duplicate spots with a variance of ⬎20%) and normalization, a standard normal curve of expression data was generated for each of the three separate experiments. The data for each experiment were then split into 20 groups ranging from lowest to highest expression, with each group representing 5% of the data based on the standard curve. Each data set was then compared to the other two independent sets by generating a kappa statistic to test for reliability and a McNemar’s P value to test for systematic shifts in the data.
RESULTS
Reliability of array data.We sought to obtain some quan-titative value for the repeatability of the nylon array procedure by using a single pool of control RNA run on different days. Comparison of normalized data from three different days showed excellent reliability (for all comparisons, the kappa statistic was 0.88 and the 95% confidence interval was 0.87 to 0.89) and no significant systematic shifts in the data from day to day (McNemar’s P value was ⬎0.95 for all comparisons). These data are in agreement with other data showing the excellent level of reproducibility of similar nylon arrays (2, 9, 31) and provide confidence in the data generated by this mi-croarray procedure.
Antigen-specific changes in gene expression. Microarray analysis of different cell populations showed antigen-specific alterations in gene expression at the twofold level relative to the unstimulated condition. This was true for C. albicans stim-ulation of both test subjects and for p24 stimstim-ulation of the HIV-infected individual. Lists of those genes shown to be ⱖ2-fold up-regulated or down-regulated were generated. For each stimulation condition (C. albicans or p24), Venn diagrams were generated from the gene lists to compare gene expression profiles between the cell subsets (PBMC, CD4⫹
T lympho-cytes, and CD8⫹T lymphocytes) within each test subject (Fig. 1). The Venn diagrams show that the largest proportions of changed genes are unique to the individual cell populations. The profile of the HIV-negative sample stimulated with C. albicans, for example (Fig. 1a), showed that 16 distinct genes were up-regulated only in the PBMC, 2 genes were up-regu-lated in both the PBMC and CD4⫹T lymphocytes, and only 1 gene was up-regulated in all three cell populations. Interest-ingly, in all of the comparisons, the PBMC and CD8⫹ T-lymphocyte populations show no (Fig. 1a, c, d, and f) or very few (Fig. 1b and e) genes with similar expression patterns.
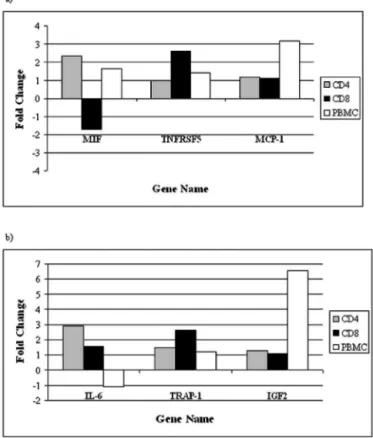
Intrasubject comparison of individual gene expression in each cell type.To further highlight the distinct gene expression profiles in the chosen cell populations, we selected genes that were up-regulated in one cell population but not in the others. We compared fold changes across all cell types for the C. albicans-stimulated condition in the non-HIV-infected individ-ual and for p24 responses in the HIV-infected individindivid-ual (Fig. 2). To highlight examples of genes that were differentially expressed in different cell populations, we chose to examine the expression levels of macrophage migration inhibitory fac-tor (MIF), tumor necrosis facfac-tor recepfac-tor superfamily member 5 (TNFRSF5), and monocyte chemoattractant protein-1 (MCP-1) in response to C. albicans stimulation in the HIV-negative donor and the expression levels of interleukin 6 (IL-6), transforming growth factor beta receptor-associated pro-tein-1 (TRAP-1), and insulin-like growth factor 2 (IGF2) in response to p24 stimulation in the HIV-positive donor. Genes up-regulated in one cell population showed no appreciable (greater than twofold) change in the other two cell popula-tions. In the C. albicans-stimulated HIV-negative sample (Fig. 2a), MIF was 2.35-fold up-regulated in CD4⫹
cells yet showed a trend toward down-regulation (⫺1.7-fold) in the CD8⫹ pop-ulation, while its expression in PBMC fell between these levels yet below the twofold cutoff (1.63-fold). In a similar manner, with regard to the CD4⫹cell population in the HIV-positive
978 MCLAREN ET AL. CLIN. DIAGN. LAB. IMMUNOL.
at Canada Institute for STI, National Research Council on June 29, 2009
cvi.asm.org
sample, the demonstrated up-regulation of the proinflamma-tory cytokine IL-6 (2.9-fold) would have gone unnoticed in a study of either the CD8⫹ or the PBMC population alone, because both show expression changes below the twofold cut-off. These data underscore the importance of examining indi-vidual cell populations within the immune system in order to obtain a clear picture of immune function.
Changes in gene expression of PBMC do not reflect those in CD4ⴙor CD8ⴙT lymphocytes.In order to demonstrate how
studying only PBMC can result in a view of antigen-specific gene expression very different from that obtained by study of CD4⫹or CD8⫹T lymphocytes, we compared the responses of the HIV-infected subject’s cells in each cell pool to stimulation with C. albicans and p24 antigen. Figure 3 shows that the response to C. albicans was minimal in the PBMC population, where only 12 genes had altered expression, while in the CD8⫹ pool more than 100 genes were differentially expressed. This comparison also showed that with p24 stimulation, the largest
FIG. 1. Venn diagrams of changed genes in single and mixed cell populations. The number of genes showing expression changes at the twofold level is given for each subset. (a and b) HIV-negative sample responses to C. albicans; (c and d) HIV-positive sample responses to C. albicans; (e and f) HIV-positive sample responses to p24. Diagrams a, c, and e represent gene up-regulations, while diagrams b, d, and f represent gene down-regulations. Red, green, and blue sections represent genes changed only in the CD4⫹, CD8⫹, and PBMC populations, respectively. Sections
in yellow, purple, and light blue represent genes sharing trends in two cell populations as shown. Sections in white represent genes showing the same trend in all cell populations.
at Canada Institute for STI, National Research Council on June 29, 2009
cvi.asm.org
number of gene expression alterations occurred in the PBMC pool. Since this one individual was stimulated with both C. albicansand p24, we could compare between cell types those genes that were similarly expressed under both stimulation
conditions. Interestingly, a relatively large proportion of genes in each of the cell types shows the same gene expression trend for both antigens, suggesting a common pattern of gene ex-pression independent of the recall antigen used. However, the largest proportion of changed genes remains specific to each antigen, suggesting that despite some similarity in responses, different antigens are capable of inducing and repressing large numbers of genes in an antigen-specific manner.
HLA class II expression in the HIV-infected subject. Anal-ysis of genes shown to be changed in the HIV-infected indi-vidual revealed that a cluster of HLA class II transcripts was down-regulated in response to p24 stimulation. Table 1 shows a greater-than-twofold decrease in HLA-DPB1, DRB3, and DRB5 expression in PBMC, yet no change was observed in either the CD4⫹or CD8⫹T lymphocytes. This down-modu-lation of HLA class II expression was antigen specific; no twofold change was noted in C. albicans-stimulated cells. This finding provides a further example of the fact that, if a gene’s alteration is large enough in a small cell population, the change can be detected in the mixed cell pool.
DISCUSSION
Microarray technology has proven its utility in determining immune function and host response to infectious diseases (3, 8, 12, 29, 39, 40). Recently, microarray studies have shown that, although some systematic variation does occur between indi-viduals, these differences are far outweighed by the changes in immune responses that accompany disease states (36). In this study we compared the intrasubject variation in antigen-spe-cific gene expression profiles of T-lymphocyte subsets to that of the PBMC population. For antigen-specific responses we looked at a very disease specific response, p24 stimulation, and at a ubiquitous antigen, C. albicans. The p24 response was studied for an HIV-infected individual, and the C. albicans response was assessed for both the HIV-positive subject and a normal HIV-negative donor. The primary goal of this study was to determine the intrasubject variation in gene expression between cell types. No intersubject comparisons were per-formed, because the sample size was not appropriate for such an analysis.
In comparing the gene profiles of CD4⫹
T lymphocytes, CD8⫹T lymphocytes, and PBMC populations, we saw tremen-dous variation within the same individual with regard to anti-gen-stimulated changes in gene expression. For example, in response to C. albicans, the HIV-negative sample showed 136 genes with changed expression in at least one cell population,
FIG. 2. Fold change in gene expression in response to antigenic stimulation in single and mixed cell populations. Shown are ratios for selected genes with differing values in each cell population. Genes shown to have changed expression in one cell population do not meet the twofold criteria in the other two populations. (a) HIV-negative sample responses to C. albicans stimulation with respect to expression of MIF, TNFRSF5, and MCP-1. (b) Effects of p24 stimulation on expression of IL-6, TRAP-1, and IGF2 in the HIV-positive sample.
FIG. 3. Comparison of responses to different recall antigens in an HIV-positive sample. Responses to different recall antigens show sim-ilarity within the same individual. Shaded or solid bars, numbers of genes changed in response to C. albicans or p24, respectively. Open bars, numbers of genes similarly changed in response to both antigens in individual cell types.
TABLE 1. Fold change in HLA class II gene expression in an HIV-infected subject in response to antigenic stimulation
Gene
Fold changeain expression in the following cell population
stimulated with the indicated antigen:
PBMC CD4 CD8
p24 C. albicans p24 C. albicans p24 C. albicans
HLA-DRB3 ⫺2.10* ⫺1.09 ⫺1.10 ⫺1.03 1.13 ⫺1.14
HLA-DRB5 ⫺2.12* ⫺1.26 ⫺1.21 ⫺1.06 ⫺1.33 ⫺1.10
HLA-DPB1 ⫺2.80* ⫺1.60 ⫺1.03 1.07 1.19 ⫺1.48
aAsterisks mark genes with twofold changes in expression.
980 MCLAREN ET AL. CLIN. DIAGN. LAB. IMMUNOL.
at Canada Institute for STI, National Research Council on June 29, 2009
cvi.asm.org
with only 26 genes showing the same trend in all three of the populations studied (Fig. 1a and b). These data underscore the point that tremendously different pictures of global gene ex-pression are seen depending on the cell populations examined. When specific genes (MIF, TNFRSF5, MCP-1, IL-6, TRAP-1, and IGF2) were compared, we observed expression changes that were unique to each cell type (Fig. 2). Specifically, the up-regulation in the HIV-positive donor of the expression of IL 6, a key proinflammatory cytokine known to show altered expression in HIV infection (20), after C. albicans stimulation (Fig. 2b) was observed only in CD4⫹
T lymphocytes. This interesting observation would not have been made if only the mixed population had been studied. Other examples of changes in T cells that are not reflected in PBMC are provided by MIF expression in CD4⫹
lymphocytes and TNFRSF2 and TRAP-1 expression in CD8⫹ lymphocytes from normal and HIV-infected donors, respectively (Fig. 2). Indeed, Fig. 3 dem-onstrates the independence of gene expression in different cell types within the same study subject, regardless of the antigen used to stimulate the cells. Another interesting finding was that for each cell subset there was a small set of genes that were regulated in a similar manner independently of the antigenic stimulation, while the expression of a larger set of genes was antigen dependent (Fig. 3). Although there are common events that occur during the activation of T cells, such as the phosphorylation of p56lck and ZAP70 (37), the two-signal hypothesis suggests that multiple signals are required to acti-vate a T cell. Events such as stimulation of cosignaling mole-cules and/or cytokine receptors may be unique to each recall antigen. HIV infection of antigen-presenting cells has been shown to down-regulate costimulatory molecules such as CD80/CD86 (24, 26) and to up-regulate molecules that regu-late apoptosis, such as CD95 (Fas) (17). In the context of these altered antigen-presenting cells, it is not surprising to see dif-ferent gene expression patterns for PBMC and the T-lympho-cyte subsets in response to C. albicans and p24 antigen. These types of comparisons would not have been possible if only PBMC had been analyzed.
Although our primary observation is that the gene expres-sion of PBMC does not reflect that of the T-cell subsets, the study of PBMC is not without value. Indeed, if the alteration in gene expression in a cell subset is large enough, it may be detected even if expression of that gene is not altered in the T-cell population. The increased expression of MCP-1, a CC chemokine involved in monocyte trafficking (7), in response to C. albicansin the HIV-negative individual (Fig. 2a) is an ex-ample. Large changes in MCP-1 expression were observed in the PBMC population but not in either CD4⫹ or CD8⫹ T lymphocytes. MCP-1 has recently been shown to affect the cytokine profiles of T cells and other facets of adaptive immu-nity (25), as well as inducing inflammatory responses to influ-enza A virus (18). Although the change in MCP-1 expression was large enough to be detectable in the mixed cell population, it is impossible to determine which of the cell types known to secrete MCP-1 (18, 38) is responsible for this change. In ad-dition, had only T cells been studied, the observation of down-regulated expression of three HLA class II genes in the mixed cell population of the HIV-infected sample (Table 1) would have been missed. This down-regulation of HLA class II ex-pression raises questions about the effects of the p24 protein in
the context of HIV infection in this subject. The lack of ex-pression change in either the CD4⫹or the CD8⫹population is not surprising, since resting naïve cells do not express HLA class II genes until activated, and once they are activated, HIV, which is known to down-regulate HLA II genes, is expressed. Previous studies have shown that the HIV Tat protein may specifically bind the HLA class II transcriptional activator and prevent gene expression of certain HLA class II alleles and that the resulting down-regulation allows virus-infected cells to escape immune detection and deletion (19, 33). B cells, mono-cytes, and dendritic cells are, however, the major cell types expressing HLA class II among circulating PBMC (21, 22). Since B cells, monocytes, and dendritic cells constitute only minor proportions of the PBMC population, the detection of a twofold change in gene expression in the mixed population likely indicates a large effect in these subsets. Whether the down-regulation of HLA class II expression reported here is the direct result of a previously undescribed effect of p24 or is due to the activation of latent virus will require further inves-tigation with a larger sample size, but it does again show that the gene expression profile of PBMC is distinct from those of the T-cell subsets.
This study demonstrates that the choice of starting material is crucial in the design of a microarray experiment, and it suggests that subsequent studies should examine specific cell populations or that, if mixed cell populations are used, caution should be exercised in extrapolating those results to the subsets contained within. Given the variety of cell types that are sus-ceptible to infection and the extensive network of cells respon-sible for immune responses, this study suggests that if fearespon-sible, it will be important to study a specific cell population. With advances in linear amplification making even the smallest amounts of RNA accessible to microarray studies (11, 32), it should now be possible to examine gene expression in even the rarest of cell populations.
ACKNOWLEDGMENTS
This study was funded by a grant from the Canadian Institutes for Health Research (CIHR grant HOP-42798).
We thank Mary Cheang for help with statistical analysis and Mike Gubbins and T. Blake Ball for critical review of the manuscript. We also thank the STD research staff at the St. Boniface Hospital Ambu-latory Care Facility for help in sample collection and the study indi-viduals for their willingness to participate.
REFERENCES
1. Abbas, A. K., and A. H. Lichtman 2003. Cellular and molecular immunology, 5th ed. Elsevier Science, Philadelphia, Pa.
2. Barrett, T., C. Cheadle, W. B. Wood, D. Teichberg, D. M. Donovan, W. J.
Freed, K. G. Becker, and M. P. Vawter.2001. Assembly and use of a broadly applicable neural cDNA microarray. Restor. Neurol. Neurosci. 18:127–135. 3. Bigger, C. B., K. M. Brasky, and R. E. Lanford. 2001. DNA microarray analysis of chimpanzee liver during acute resolving hepatitis C virus infec-tion. J. Virol. 75:7059–7066.
4. Boldrick, J. C., A. A. Alizadeh, M. Diehn, S. Dudoit, C. L. Liu, C. E. Belcher,
D. Botstein, L. M. Staudt, P. O. Brown, and D. A. Relman.2002. Stereotyped and specific gene expression programs in human innate immune responses to bacteria. Proc. Natl. Acad. Sci. USA 99:972–977.
5. Bolt, G., K. Berg, and M. Blixenkrone-Moller. 2002. Measles virus-induced modulation of host-cell gene expression. J. Gen. Virol. 83:1157–1165. 6. Chun, T. W., J. S. Justement, R. A. Lempicki, J. Yang, G. Dennis, Jr., C. W.
Hallahan, C. Sanford, P. Pandya, S. Liu, M. McLaughlin, L. A. Ehler, S. Moir, and A. S. Fauci.2003. Gene expression and viral production in latently infected, resting CD4⫹ T cells in viremic versus aviremic HIV-infected
individuals. Proc. Natl. Acad. Sci. USA 100:1908–1913.
7. Daly, C., and B. J. Rollins. 2003. Monocyte chemoattractant protein-1
at Canada Institute for STI, National Research Council on June 29, 2009
cvi.asm.org
(CCL2) in inflammatory disease and adaptive immunity: therapeutic oppor-tunities and controversies. Microcirculation 10:247–257.
8. de la Fuente, C., F. Santiago, L. Deng, C. Eadie, I. Zilberman, K. Kehn, A.
Maddukuri, S. Baylor, K. Wu, C. G. Lee, A. Pumfery, and F. Kashanchi.
2002. Gene expression profile of HIV-1 Tat expressing cells: a close interplay between proliferative and differentiation signals. BMC Biochem. 3:14. 9. Donovan, D. M., and K. G. Becker. 2002. Double round hybridization of
membrane based cDNA arrays: improved background reduction and data replication. J. Neurosci. Methods 118:59–62.
10. Fan, J., X. Yang, W. Wang, W. H. Wood III, K. G. Becker, and M. Gorospe. 2002. Global analysis of stress-regulated mRNA turnover by using cDNA arrays. Proc. Natl. Acad. Sci. USA 99:10611–10616.
11. Feldman, A. L., N. G. Costouros, E. Wang, M. Qian, F. M. Marincola, H. R.
Alexander, and S. K. Libutti.2002. Advantages of mRNA amplification for microarray analysis. BioTechniques 33:906–912, 914.
12. Galey, D., K. Becker, N. Haughey, A. Kalehua, D. Taub, J. Woodward, M. P.
Mattson, and A. Nath.2003. Differential transcriptional regulation by human immunodeficiency virus type 1 and gp120 in human astrocytes. J. Neurovirol.
9:358–371.
13. Geiss, G. K., R. E. Bumgarner, M. C. An, M. B. Agy, A. B. van’t Wout, E.
Hammersmark, V. S. Carter, D. Upchurch, J. I. Mullins, and M. G. Katze.
2000. Large-scale monitoring of host cell gene expression during HIV-1 infection using cDNA microarrays. Virology 266:8–16.
14. Geiss, G. K., V. S. Carter, Y. He, B. K. Kwieciszewski, T. Holzman, M. J.
Korth, C. A. Lazaro, N. Fausto, R. E. Bumgarner, and M. G. Katze.2003. Gene expression profiling of the cellular transcriptional network regulated by alpha/beta interferon and its partial attenuation by the hepatitis C virus nonstructural 5A protein. J. Virol. 77:6367–6375.
15. Gu, J., M. Rihl, E. Marker-Hermann, D. Baeten, J. G. Kuipers, Y. W. Song,
W. P. Maksymowych, R. Burgos-Vargas, E. M. Veys, F. De Keyser, H. Deister, M. Xiong, F. Huang, W. C. Tsai, and D. T. Yu.2002. Clues to pathogenesis of spondyloarthropathy derived from synovial fluid mononu-clear cell gene expression profiles. J. Rheumatol. 29:2159–2164.
16. Hoffmann, R., L. Bruno, T. Seidl, A. Rolink, and F. Melchers. 2003. Rules for gene usage inferred from a comparison of large-scale gene expression pro-files of T and B lymphocyte development. J. Immunol. 170:1339–1353. 17. Hosaka, N., N. Oyaizu, M. H. Kaplan, H. Yagita, and S. Pahwa. 1998.
Membrane and soluble forms of Fas (CD95) and Fas ligand in peripheral blood mononuclear cells and in plasma from human immunodeficiency virus-infected persons. J. Infect. Dis. 178:1030–1039.
18. Julkunen, I., T. Sareneva, J. Pirhonen, T. Ronni, K. Melen, and S.
Mati-kainen.2001. Molecular pathogenesis of influenza A virus infection and virus-induced regulation of cytokine gene expression. Cytokine Growth Fac-tor Rev. 12:171–180.
19. Kanazawa, S., T. Okamoto, and B. M. Peterlin. 2000. Tat competes with CIITA for the binding to P-TEFb and blocks the expression of MHC class II genes in HIV infection. Immunity 12:61–70.
20. Kedzierska, K., and S. M. Crowe. 2001. Cytokines and HIV-1: interactions and clinical implications. Antivir. Chem. Chemother. 12:133–150. 21. Klein, J., and A. Sato. 2000. The HLA system. First of two parts. N. Engl.
J. Med. 343:702–709.
22. Klein, J., and A. Sato. 2000. The HLA system. Second of two parts. N. Engl. J. Med. 343:782–786.
23. Kong, X., H. San Juan, M. Kumar, A. K. Behera, A. Mohapatra, G. R.
Hellermann, S. Mane, R. F. Lockey, and S. S. Mohapatra.2003. Respiratory syncytial virus infection activates STAT signaling in human epithelial cells. Biochem. Biophys. Res. Commun. 306:616–622.
24. Lore, K., A. Sonnerborg, C. Brostrom, L. E. Goh, L. Perrin, H. McDade,
H. J. Stellbrink, B. Gazzard, R. Weber, L. A. Napolitano, Y. van Kooyk, and J. Andersson.2002. Accumulation of DC-SIGN⫹CD40⫹dendritic cells with
reduced CD80 and CD86 expression in lymphoid tissue during acute HIV-1 infection. AIDS 16:683–692.
25. Luther, S. A., and J. G. Cyster. 2001. Chemokines as regulators of T cell differentiation. Nat. Immunol. 2:102–107.
26. Malaspina, A., S. Moir, S. Kottilil, C. W. Hallahan, L. A. Ehler, S. Liu, M. A.
Planta, T. W. Chun, and A. S. Fauci.2003. Deleterious effect of HIV-1 plasma viremia on B cell costimulatory function. J. Immunol. 170:5965–5972. 27. Mayne, M., C. Cheadle, S. S. Soldan, C. Cermelli, Y. Yamano, N. Akhyani,
J. E. Nagel, D. D. Taub, K. G. Becker, and S. Jacobson.2001. Gene expres-sion profile of herpesvirus-infected T cells obtained using immunomicroar-rays: induction of proinflammatory mechanisms. J. Virol. 75:11641–11650. 28. Ren, Q., S. J. Robertson, D. Howe, L. F. Barrows, and R. A. Heinzen. 2003.
Comparative DNA microarray analysis of host cell transcriptional responses to infection by Coxiella burnetii or Chlamydia trachomatis. Ann. N. Y. Acad. Sci. 990:701–713.
29. Roberts, E. S., M. A. Zandonatti, D. D. Watry, L. J. Madden, S. J. Henriksen,
M. A. Taffe, and H. S. Fox.2003. Induction of pathogenic sets of genes in macrophages and neurons in NeuroAIDS. Am. J. Pathol. 162:2041–2057. 30. Rus, V., S. P. Atamas, V. Shustova, I. G. Luzina, F. Selaru, L. S. Magder, and
C. S. Via.2002. Expression of cytokine- and chemokine-related genes in peripheral blood mononuclear cells from lupus patients by cDNA array. Clin. Immunol. 102:283–290.
31. Sawiris, G. P., C. A. Sherman-Baust, K. G. Becker, C. Cheadle, D. Teichberg,
and P. J. Morin.2002. Development of a highly specialized cDNA array for the study and diagnosis of epithelial ovarian cancer. Cancer Res. 62:2923– 2928.
32. Scherer, A., A. Krause, J. R. Walker, S. E. Sutton, D. Seron, F. Raulf, and
M. P. Cooke.2003. Optimized protocol for linear RNA amplification and application to gene expression profiling of human renal biopsies. BioTech-niques 34:546–550, 552–554, 556.
33. Tosi, G., A. De Lerma Barbaro, A. D’Agostino, M. T. Valle, A. M.
Megio-vanni, F. Manca, A. Caputo, G. Barbanti-Brodano, and R. S. Accolla.2000. HIV-1 Tat mutants in the cysteine-rich region downregulate HLA class II expression in T lymphocytic and macrophage cell lines. Eur. J. Immunol.
30:19–28.
34. Unoki, M., J. Okutsu, and Y. Nakamura. 2003. Identification of a novel human gene, ZFP91, involved in acute myelogenous leukemia. Int. J. Oncol.
22:1217–1223.
35. Vawter, M. P., T. Barrett, C. Cheadle, B. P. Sokolov, W. H. Wood III, D. M.
Donovan, M. Webster, W. J. Freed, and K. G. Becker.2001. Application of cDNA microarrays to examine gene expression differences in schizophrenia. Brain Res. Bull. 55:641–650.
36. Whitney, A. R., M. Diehn, S. J. Popper, A. A. Alizadeh, J. C. Boldrick, D. A.
Relman, and P. O. Brown.2003. Individuality and variation in gene expres-sion patterns in human blood. Proc. Natl. Acad. Sci. USA 100:1896–1901. 37. Yamaguchi, H., and W. A. Hendrickson. 1996. Structural basis for activation
of human lymphocyte kinase Lck upon tyrosine phosphorylation. Nature
384:484–489.
38. Yamashiro, S., H. Kamohara, and T. Yoshimura. 1999. MCP-1 is selectively expressed in the late phase by cytokine-stimulated human neutrophils: TNF-␣ plays a role in maximal MCP-1 mRNA expression. J. Leukoc. Biol.
65:671–679.
39. Zhang, Y., M. Jamaluddin, S. Wang, B. Tian, R. P. Garofalo, A. Casola, and
A. R. Brasier.2003. Ribavirin treatment up-regulates antiviral gene expres-sion via the interferon-stimulated response element in respiratory syncytial virus-infected epithelial cells. J. Virol. 77:5933–5947.
40. Zhao, H., F. Granberg, L. Elfineh, U. Pettersson, and C. Svensson. 2003. Strategic attack on host cell gene expression during adenovirus infection. J. Virol. 77:11006–11015.
982 MCLAREN ET AL. CLIN. DIAGN. LAB. IMMUNOL.
at Canada Institute for STI, National Research Council on June 29, 2009
cvi.asm.org