HAL Id: hal-00797464
https://hal.archives-ouvertes.fr/hal-00797464
Submitted on 6 Mar 2013
HAL is a multi-disciplinary open access
archive for the deposit and dissemination of
sci-entific research documents, whether they are
pub-lished or not. The documents may come from
teaching and research institutions in France or
abroad, or from public or private research centers.
L’archive ouverte pluridisciplinaire HAL, est
destinée au dépôt et à la diffusion de documents
scientifiques de niveau recherche, publiés ou non,
émanant des établissements d’enseignement et de
recherche français ou étrangers, des laboratoires
publics ou privés.
Stability of ICA decomposition across within-subject
EEG datasets.
Romain Grandchamp, Claire Braboszcz, Scott Makeig, Arnaud Delorme
To cite this version:
Romain Grandchamp, Claire Braboszcz, Scott Makeig, Arnaud Delorme. Stability of ICA
decomposi-tion across within-subject EEG datasets.. Conference proceedings : .. Annual Internadecomposi-tional Conference
of the IEEE Engineering in Medicine and Biology Society. IEEE Engineering in Medicine and Biology
Society. Annual Conference, Institute of Electrical and Electronics Engineers (IEEE), 2012, 2012,
pp.6735-9. �10.1109/EMBC.2012.6347540�. �hal-00797464�
Abstract— Independent Component Analysis (ICA) has been
successfully used to identify brain related signals and artifacts from multi-channel electroencephalographic (EEG) data. However the stability of ICA decompositions across sessions from a single subject has not been investigated. The goal of this study was to isolate EEG independent components (ICs) across sessions for each subject so as to assess whether ICs are reproducible across sessions. We used 64-channel EEG data recorded from two subjects during a simple mind-wandering experiment. Each subject participated in 11 twenty-minute sessions over a period of five weeks. Extended Infomax ICA decomposition was performed on the continuous data of each session. We used a simple IC clustering technique based on correlation of scalp topographies. Several clusters of homogenous components were identified for each subject. Typical component clusters accounting for eye movement and eye blink artifacts were identified. Both clusters included one component from each recording session. In addition, several clusters corresponding to brain electrical sources, among them clusters exhibiting prominent alpha, beta and Mu band activities, included components from most sessions. These results present evidence that ICA can provide relatively stable solutions across sessions, with important implications for Brain Computer Interface research.
I. INTRODUCTION
One main challenge in EEG research is the inverse problem of separating the EEG sources whose activities are projected to the scalp sensors through volume conduction and are thus summed in the recorded channel signals. Independent Component Analysis (ICA) [1] has been proposed to isolate brain and non-brain (artifact) signals that contribute to scalp channel signals [2] . Scalp EEG potentials describe a mixture of field activities emitted by several approximately dipolar effective EEG sources belonging to multiple cortical areas. ICA identifies the maximally temporally independent components of the electrical potentials recorded at scalp electrode sites [3–6]. Recent results show that many independent ICA components are compatible with a biologically plausible EEG source model [7].
ICA decompositions are usually performed on a single session from each subject. Clustering techniques are then used to group similar components across subjects [6]. Some evidence of the possible interest in using ICA for effective
*Research supported by a Grant from the French Ministry of Research and Higher Education.
R. Grandchamp, C. Braboszcz and A. Delorme are with the Brain and Cognition Research Center (CerCo), Paul Sabatier University, Toulouse, France (corresponding author phone: +33-62-74-61-40; fax: + 33 (0)5-81-18-49-58; e-mail: [email protected]).
A. Delorme and S. Makeig are with the Swartz Center for Computational Neuroscience, Institute for Neural Computation, UCSD, La Jolla CA 92093-0559 USA.
Brain Computer Interface (BCI) design have been demonstrated [8–12]. However, BCI experiments usually involve repeated sessions recorded over several days from the same subjects. Estimating the stability of ICs across sessions for a given subject appears to be crucial for BCI applications. In this document, we report results from intra-subject IC cluster analysis of 11 sessions from two intra-subjects performing a mind-wandering task. We identified several clusters of similar ICs across sessions, including typical ocular artifacts and sources accounting for various types of brain activity.
II. MATERIALS AND METHODS A. Subjects
Two participants volunteered for this experiment after giving written informed consent. All participants had normal or corrected to normal vision. The experimental protocol was approved by the local ethical committee (CPP).
B. Stimuli and procedure
The task of subject was adapted from Braboszcz and Delorme [13]. Subjects sat in a dimly lighted room in front of a computer screen placed 60 cm in front of them. The subject was asked to keep his/her gaze on a central fixation cross displayed at the center of the screen. The task of the subjects was to count backward each of their breath cycles (inhale/exhale) from 10 to 1 and to indicate whenever they realized they had lost track of their breath count (i.e. that their attention had drifted) by pressing a button [14]. As soon as they press the button, a phenomenological questionnaire was presented on the screen – it took less than one minute to complete the questionnaire and then the breath counting task resumed.
While performing the breath counting task, subjects were also presented with a passive auditory oddball protocol that they were instructed to ignore. The auditory oddball protocol was composed of 70 ms pure sounds of 500 Hz for the standard stimuli (70% of the stimuli) and 1000 Hz for the oddball (30% of the stimuli) presented at 72 dB.
Each session lasted 20 minutes excluding breaks and time spent filling out questionnaires. Eleven sessions of the 20-minute breath-counting task were recorded for each subject. Sessions were scheduled every 2-3 days, excluding week-ends, over a period of 5 weeks.
C. EEG acquisition
A BioSemi EEG system was used to record from 64 scalp channels mounted in an elastic cap. Sessions were recorded at a sampling rate of 1024 Hz. Skin Conductance (SC), electrocardiogram (ECG) as well as eye movements
Stability of ICA decomposition across within-subject EEG datasets
Romain Grandchamp, Claire Braboszcz, Scott Makeig, Arnaud Delorme
34th Annual International Conference of the IEEE EMBS San Diego, California USA, 28 August - 1 September, 2012
and pupil size were also recorded. In this report, we present results on the EEG data only.
D. EEG data processing
The data were first imported using Cz reference. The data were then high-pass filtered using an IIR digital filter with a cut-off frequency of 2 Hz (order 6, 0.7-Hz transition bandwidth) implemented in the EEGLAB software. Note that the quality of the ICA decomposition (as assessed subjectively by counting the number of “dipolar” components – components with equivalent dipoles with low residual variance) decreased dramatically for lower high-pass frequency cut-off. All data segments corresponding to periods during which the subject was completing the questionnaire were removed. The data were then downsampled to 256 Hz. Channel signals contaminated high frequency noise or electrical artifacts (as assessed by visual inspection) were removed. We then converted the signal to average reference and applied the Extended Infomax version of ICA using EEGLAB runica algorithm [15]. EEGLAB implementation of JADE ICA decomposition algorithm has been used as well. Since ICs resulting from this decomposition were almost identical, only Extended Infomax components were kept, as this method returns globally more dipolar components as stated in [7]. For a
detailed comparison of ICs obtained from various ICA algorithms applied to EEG data, see [7]. To obtain approximate source localization, we computed an equivalent dipole model for each IC using a four-shell spherical head model (radius: 71, 72, 79, 85 mm with shell conductances: 0.33, 0.0042, 1, 0.33 S) using the DIPFIT plug-in (version 2.2) [16] of the EEGLAB toolbox (version 9.0.2.3b). The spherical model was co-registered with the MNI average brain using a custom homogenous matrix computed by matching fiducials and vertex in the MNI and the spherical models. The lower portion of Fig. 1 shows some IC equivalent dipole locations in the 3-D MNI brain volume.
E. Independent components clustering.
We performed a within-subject analysis in order to identify similar ICs across the different sessions. Our independent component clustering algorithm comprised two steps: identification of template ICs of interest and clustering of ICs similar to the template ICs.
To identify IC of interest, we used a custom KMean [17] algorithm. The algorithm identified several typical independent components based on their topographical maps, their equivalent dipole location and their power spectrum following recommendations described in [6]. All these measures were combined and used for clustering. A
pre-Figure 1: Three clusters for subject 1. For each cluster, the average scalp topography of the cluster is displayed on the top left corner. The scalp topographies of the ICs belonging to a particular cluster are also shown. Above each topography, the session (S) and corresponding IC number (ic) are shown in a colored rectangle. The color of the rectangle matches the color of the component’s equivalent dipole (colored disks) and power spectrum (colored lines). Dipole locations of corresponding ICs are shown on a standard MNI anatomical model. The cluster centroid is represented as a black disk. The curve on the bottom right panel of each cluster indicates the power spectrum of each component. Finally, the last plot displays the spectrum of each IC. The first cluster (Cls4) contains 11 ICs (1 IC from each session) and corresponds to eye blinks. The second cluster (Cls12) represents a left Mu component. The third cluster (Cls7) shows ICs with beta-range left fronto-parietal activity.
clustering matrix contained the scalp topography of each component (with dimension reduced from the number of channels to 10 using PCA), power spectrum in the 3-25 frequency band (with dimension reduced from 23 to 10 using PCA) and equivalent dipole location in spherical coordinates (3 dimensions). This resulted in a n x 23 matrix, n being the number of components across all sessions (642 components for subject 1; 615 for subject 2). The KMean algorithm was initialized using uniform centroids positions and we used correlation as a measure of distance between components. We customized the KMean algorithm from [17] to limit to at most 1 the number of participating components per session in each cluster. As a consequence the maximum number of components per cluster is the number of sessions. For subject 1, we used 12 clusters and for subject 2, we used 15 clusters. The number of cluster was determined by picking in each subject, the session with the minimum number of ICs with an equivalent dipole residual variance below 15%. For each IC cluster, the IC closest to cluster's centroid was selected.
As a second step, we run the CORRMAP algorithm [18] on each of the selected ICs. The CORRMAP EEGLAB plugin outputs, for a given IC template, all ICs with the most correlated topographical maps. The algorithm performs two passes, one using the IC given as input as template, and a second one using the average IC – found after the first pass – as template. The difference between the two passes' mean correlation is used to compute a similarity index (SI) which informs about how robust the resulting cluster is against the selection of the initial map. We constrained CORRMAP to
return at most one IC per session and, for each cluster, only the ICs with a correlation higher than a given correlation threshold were kept. We used the default correlation threshold of CORRMAP. This optimal threshold is automatically determined using an iterative procedure. The procedure selects the threshold value for which the SI is maximum across the iterations [18].
III. RESULTS
Analysis of the first subject data led to the identification of 5 clusters which had one component in each session. 3 clusters with only one component were not considered. We counted 9.8±1.7 components per cluster. Mean intra-cluster component topography correlation (Mean Intra-Cluster Correlation – Mean ICC) was 0.91±0.08. Mean pairwise correlation between components outside the cluster (Mean Outside Cluster Correlation – Mean OCC) was 0.33±0.06. Figure 1 shows three typical clusters. The first cluster (Cls4 – ICC 0.99) is an eye blink component cluster. The second cluster (Cls12 – 0.93) shows typical Mu spectral activity – with clearly visible 10 and 20 Hz peaks – located on the left primary motor cortex (Talairach coordinates X=-48, Y=-7, Z=47, Brodmann area 4). One component was identified in each session. The third cluster (Cls7 – 0.91) represents EEG sources with a spectral activity in beta2 (20-25Hz) range. The centroid of this cluster (Talairach coordinates: X=-33, Y=20, Z=8) is located in the left Insula (Brodmann area 13). For the second subject, 3 clusters were isolated with one
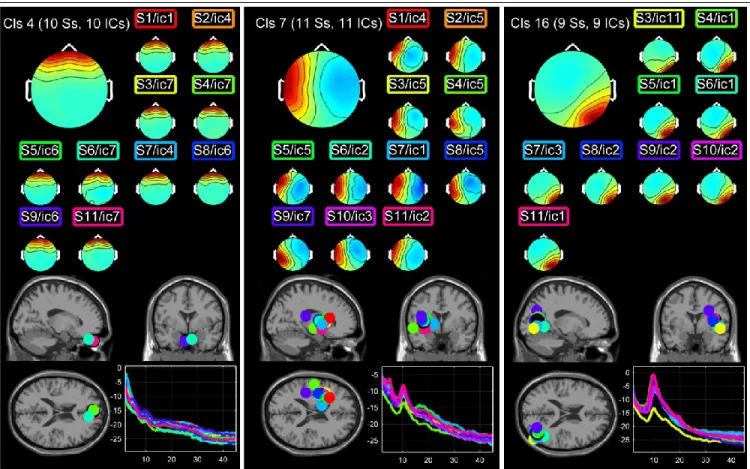
Figure 2: Three clusters computed for subject 2. The nomenclature is the same as for Figure 1. The first cluster (Cls4) corresponds to eye blinks. The second cluster (Cls7) shows ICs with left-parietal alpha range activity. The third cluster (Cls16) shows right occipital alpha activity.
component in each session. 4 clusters had only one component and were removed. We counted 7.5±3.5 components per cluster with mean MICC of 0.93±0.06 and mean MOCC of 0.36±0.05. Figure 2 shows three typical clusters isolated for the second subject. As for the first subject, the first cluster (Cls4 – ICC 0.98) corresponds eye blinks. The second cluster (Cls7 – ICC 0.89) shows ICs with parietal alpha range activity (10 Hz). The closest Gray Matter voxel near this cluster's centroid (Talairach coordinates X=-35, Y=2, Z=5) is located in the left sub-lobar claustrum. The third cluster (Cls 16 – ICC 0.94) shows a right occipital alpha activity (10 Hz). The closest Gray Matter voxel near this cluster's centroid (Talairach coordinates X=39 Y=-68 Z=13) is located in the middle occipital gyrus (Talairach coordinates X=39 Y=-68 Z=12, range=4, Brodmann area 19).
IV. DISCUSSION
Clusters of ICs identified using combined clustering methods of KMean and CORRMAP are showing uniform scalp topographies, equivalent dipole locations and spectral activities. For each of the two subjects, several clusters include ICs from all 11 sessions. To our knowledge this is the first demonstration showing that ICA decompositions applied to different recording sessions of a given subject return similar results.
Among the clusters which we successfully isolated, we observed both artefactual IC clusters and brain activity IC clusters. The functional relevance of each cluster showing ICs corresponding to brain activity has to be considered in relation to the task performed by the subject. Here we showed Mu, alpha, and beta components. These clusters are consistent with the type of ICA clusters found in the literature [7, 19].
Some components were absent in some sessions. For example, a blink component is missing in one session of subject 2. After visual inspection of the data for the session in which the eye blink component was missing, it appears that no significant blinks were present in the analyzed data, which explains why ICA failed to isolate an eye blink component. When components representing brain sources are missing from a cluster, it may be that other EEG sources and artifacts dominate the EEG signal for a given session. This would explain why some components are absent. The likelihood of a component being present could depend on the task. We believe the frequency of occurrence of specific components in a given task could be a marker of a specific mental state, although this has not been tested to date..
The reason we run two sequential clustering methods was that CORRMAP requires component templates as input. When using CORRMAP, prototypical components are usually provided by the user to detect specific types of artifacts. We wanted to automate this process to detect, possibly, other types of biologically plausible components. This is the reason why we used the KMean clustering algorithm as a first step. The KMean clustering results were qualitatively of lower quality than the CORRMAP results with less uniform clusters. This is the reason why KMean
algorithm results are not presented here. We believe that other methods, such as running CORRMAP on all possible IC templates and then selecting clusters with the largest number of ICs – although computationally demanding given the large number of components – would have returned similar results.
Although our clustering method was successful, we cannot claim it was optimal. We could vary features used for clustering (topographies, 3-D dipole location, spectrum, etc…), metric (Euclidian, Mahalanobis, Chebyshev, Minkowski and other distances), and type of clustering algorithm. The crude ICC and OCC topographical correlation metric we used would not allow comparing the large variety of algorithms. We are currently developing other methods to compare clustering solutions. One must consider the number of free parameters in the clustering algorithm, a metric to assess the quality of a cluster, the size of clusters, the number of clusters and the number of unclustered components. An information based distance, such as the one developed by Marisa Meilă [20] might be a good candidate to assess cluster quality. Weighted measures based on the Akaike criteria are also worth investigating [21–23].
Clustering in individual subjects is comparatively an easy task compared to clustering across subjects. In single subject, we expect the scalp topography of a projected underlying EEG source to be similar across sessions – with small variations based on the uncertainty pertaining to electrodes positions. However, when clustering across multiple subjects, brain anatomy may differ dramatically. A Mu component for one subject may be different from a Mu component in another subject simply because of variations in the localization of active brain regions on the folded cortical grey matter. A few millimeters difference on a gyrus could dramatically change the orientation of the equivalent dipole and the projected EEG source scalp topographies.
Our results have important applications for the field of BCI and Neurofeedback research. In BCI and Neurofeedback, subjects or patients need to train over several days. It is therefore important to isolate prototypical artifacts and brain sources – as separated by ICA – that are common across sessions. Our approach provides a first solution to tackle this problem in the EEG-based BCI and Neurofeedback context, and also show that it is possible to find similar components across multiple sessions. For example, the Mu rhythm is a typical rhythm that has been shown to be efficient at controlling BCIs [24–27]. This rhythm was isolated for both subject 1 (figure 1) and 2 (Cluster 13 not shown). After identification of the Mu component in the first session, the correlation method we presented could be used to automatically detect this component in subsequent sessions.
V. CONCLUSION
In this paper, we introduced briefly a new method to cluster ICs identified by ICA applied to multi-session human EEG recorded during a mind-wandering task. This method combines a customized KMean clustering method used to 6738
identify ICA components of interest across sessions and a correlation-based clustering method applied to scalp topographies. We obtained clusters of ICs showing similar scalp topographies, equivalent dipole locations and spectral activities. For each subject, several clusters included ICs from all sessions showing that, even when recording session occurred on different days, ICA was able to identify recurring brain and artefactual components. This report is a proof of concept that ICA provides relatively stable solutions across sessions, with important application in BCI research.
REFERENCES
[1] A. J. Bell and T. J. Sejnowski, “An information-maximization approach to blind separation and blind deconvolution,” Neural
computation, vol. 7, no. 6, pp. 1129–1159, 1995.
[2] S. Makeig, A. J. Bell, T. P. Jung, T. J. Sejnowski, and others, “Independent component analysis of electroencephalographic data,”
Advances in neural information processing systems, pp. 145–151,
1996.
[3] T. P. Jung, S. Makeig, M. Westerfield, J. Townsend, E.
Courchesne, and T. J. Sejnowski, “Removal of eye activity artifacts from visual event-related potentials in normal and clinical subjects,” Clinical Neurophysiology, vol. 111, no. 10, pp. 1745– 1758, 2000.
[4] R. D. Pascual-Marqui, “Review of methods for solving the EEG inverse problem,” International Journal of Bioelectromagnetism, vol. 1, no. 1, pp. 75–86, 1999.
[5] R. Grech, T. Cassar, J. Muscat, K. Camilleri, S. Fabri, M. Zervakis, P. Xanthopoulos, V. Sakkalis, and B. Vanrumste, “Review on solving the inverse problem in EEG source analysis,” Journal of
neuroengineering and rehabilitation, vol. 5, no. 1, p. 25, 2008.
[6] J. Onton, M. Westerfield, J. Townsend, and S. Makeig, “Imaging human EEG dynamics using independent component analysis,”
Neuroscience & Biobehavioral Reviews, vol. 30, no. 6, pp. 808–
822, 2006.
[7] A. Delorme, J. Palmer, J. Onton, R. Oostenveld, and S. Makeig, “Independent EEG Sources Are Dipolar,” PLoS ONE, vol. 7, no. 2, p. e30135, Feb. 2012.
[8] L. Senhadji, A. Kachenoura, L. Albera, and P. Comon, “Sur l’exploitation des approches d’analyse en composantes
indépendantes dans les interfaces cerveau machine,” IRBM, vol. 30, no. 5–6, pp. 211–217, Dec. 2009.
[9] A. Kachenoura, L. Albera, L. Senhadji, and P. Comon, “ICA: a potential tool for BCI systems,” Signal Processing Magazine,
IEEE, vol. 25, no. 1, pp. 57–68, 2008.
[10] A. Delorme and S. Makeig, “EEG changes accompanying learned regulation of 12-Hz EEG activity,” IEEE Trans Neural Syst
Rehabil Eng, vol. 11, no. 2, pp. 133–137, Jun. 2003.
[11] C.-I. Hung, P.-L. Lee, Y.-T. Wu, L.-F. Chen, T.-C. Yeh, and J.-C. Hsieh, “Recognition of Motor Imagery Electroencephalography Using Independent Component Analysis and Machine Classifiers,”
Ann Biomed Eng, vol. 33, no. 8, pp. 1053–1070, Aug. 2005.
[12] M. Naeem, C. Brunner, R. Leeb, B. Graimann, and G.
Pfurtscheller, “Seperability of four-class motor imagery data using independent components analysis,” Journal of neural engineering, vol. 3, no. 3, pp. 208–216, 2006.
[13] C. Braboszcz and A. Delorme, “Lost in thoughts: Neural markers of low alertness during mind wandering,” NeuroImage, vol. 54, no. 4, pp. 3040–3047, Feb. 2011.
[14] J. W. Schooler, “Re-representing consciousness: Dissociations between experience and meta-consciousness,” Trends in Cognitive
Sciences, vol. 6, no. 8, pp. 339–344, 2002.
[15] A. Delorme and S. Makeig, “EEGLAB: an open source toolbox for analysis of single-trial EEG dynamics including independent component analysis,” Journal of Neuroscience Methods, vol. 134, no. 1, pp. 9–21, Mar. 2004.
[16] R. Oostenveld and A. Delorme, “DIPFIT EEGLAB plugin for source localization of ICA component.” [Online]. Available: http://sccn.ucsd.edu/wiki/A08:_DIPFIT. [Accessed: 03-Mar-2012]. [17] J. MacQueen and others, “Some methods for classification and
analysis of multivariate observations,” in Proceedings of the fifth
Berkeley symposium on mathematical statistics and probability,
1967, vol. 1, p. 14.
[18] F. C. Viola, J. Thorne, B. Edmonds, T. Schneider, T. Eichele, and S. Debener, “Semi-automatic identification of independent components representing EEG artifact,” Clin Neurophysiol, vol. 120, no. 5, pp. 868–877, May 2009.
[19] S. Makeig, A. Delorme, M. Westerfield, T.-P. Jung, J. Townsend, E. Courchesne, and T. J. Sejnowski, “Electroencephalographic Brain Dynamics Following Manually Responded Visual Targets,”
PLoS Biol, vol. 2, no. 6, p. e176, Jun. 2004.
[20] M. Meila, “Comparing clusterings–an information based distance,”
Journal of Multivariate Analysis, vol. 98, no. 5, pp. 873–895,
2007.
[21] H. Akaike, “A new look at the statistical model identification,”
Automatic Control, IEEE Transactions on, vol. 19, no. 6, pp. 716–
723, 1974.
[22] S. L. Sclove, “Application of model-selection criteria to some problems in multivariate analysis,” Psychometrika, vol. 52, no. 3, pp. 333–343, 1987.
[23] H. Bozdogan and S. L. Sclove, “Multi-sample cluster analysis using Akaike’s information criterion,” Annals of the Institute of
Statistical Mathematics, vol. 36, no. 1, pp. 163–180, 1984.
[24] J. R. Wolpaw, D. J. McFarland, G. W. Neat, and C. A. Forneris, “An EEG-based brain-computer interface for cursor control,”
Electroencephalography and clinical neurophysiology, vol. 78, no.
3, pp. 252–259, 1991.
[25] G. E. Fabiani, D. J. McFarland, J. R. Wolpaw, and G. Pfurtscheller, “Conversion of EEG activity into cursor movement by a brain-computer interface (BCI),” IEEE Transactions on Neural Systems
and Rehabilitation Engineering, vol. 12, no. 3, pp. 331–338, Sep.
2004.
[26] L. Qin, L. Ding, and B. He, “Motor imagery classification by means of source analysis for brain–computer interface
applications,” Journal of Neural Engineering, vol. 1, p. 135, 2004. [27] G. Pfurtscheller, C. Brunner, A. Schlögl, and F. H. Lopes da Silva, “Mu rhythm (de)synchronization and EEG single-trial classification of different motor imagery tasks,” NeuroImage, vol. 31, no. 1, pp. 153–159, May 2006.