HAL Id: halshs-00321632
https://halshs.archives-ouvertes.fr/halshs-00321632
Submitted on 15 Sep 2008
HAL is a multi-disciplinary open access archive for the deposit and dissemination of sci-entific research documents, whether they are pub-lished or not. The documents may come from teaching and research institutions in France or abroad, or from public or private research centers.
L’archive ouverte pluridisciplinaire HAL, est destinée au dépôt et à la diffusion de documents scientifiques de niveau recherche, publiés ou non, émanant des établissements d’enseignement et de recherche français ou étrangers, des laboratoires publics ou privés.
Financial Factors and the Margins of Trade: Evidence
from Cross-Country Firm-Level Data
Nicolas Berman, Jérôme Héricourt
To cite this version:
Nicolas Berman, Jérôme Héricourt. Financial Factors and the Margins of Trade: Evidence from Cross-Country Firm-Level Data. 2008. �halshs-00321632�
Documents de Travail du
Centre d’Economie de la Sorbonne
Maison des Sciences Économiques, 106-112 boulevard de L'Hôpital, 75647 Paris Cedex 13 http://ces.univ-paris1.fr/cesdp/CES-docs.htm
Financial Factors and the Margins of Trade : Evidence
from Cross-Country Firm-Level Data
Nicolas B
ERMAN, Jérôme H
ERICOURTFinancial Factors and the Margins of Trade : Evidence from
Cross-Country Firm-Level Data
∗Nicolas Berman† J´erˆome H´ericourt‡
September 14, 2008
Abstract: Using a large cross-country, firm level database containing 5,000 firms in 9 developing and emerging economies, we study how financial factors affect both firms’ export decisions and the amount exported by firm. First, our results stress an important impact of firms’ access to finance on their entry decision into the export market. However, a better financial health neither increases the probability of remaining an exporter once the firm has entered, nor the size of exports. Second, we find that financial constraints create a disconnection between firms’ productivity and their export status: productivity is a significant determinant of exporting decision only if the firm has a sufficient access to external finance. Finally, an increase in a country’s financial development dampens this disconnection, thus acting positively both on the number of exporters and on the exporters’ selection process. Keywords: Export decision, margins of trade, financial constraints
R´esum´e: A l’aide d’une base de donn´ees recensant 5000 entreprises issues de neuf pays ´emergents et en d´eveloppement, cet article ´etudie l’influence des contraintes financi`eres `a la fois sur les d´ecisions d’exportation des entreprises et sur le volume export´e par entreprise. Nos r´esultats soulignent tout d’abord que l’acc`es des entreprises aux financements externes repr´esente un d´eterminant important de leur d´ecision d’entr´ee sur le march´e `a l’export. Une meilleure situation financi`ere n’accroˆıt cependant ni la probabilit´e de demeurer exportateur, ni le volume d’exportations. Par ailleurs, nous montrons que les contraintes financi`eres entraˆınent une d´econnexion entre le niveau de productivit´e des entreprises et leur capacit´e `a ˆetre pr´esentes sur le march´e `a l’export : la productivit´e n’apparaˆıt comme un d´eterminant significatif de la d´ecision d’exporter qu’`a la condition que l’entreprise ait un acc`es suffisant aux financements externes. Enfin, une ´el´evation du degr´e de d´eveloppement financier du pays att´enue cette d´econnexion, et a donc un impact positif `a la fois sur le nombre d’exportateurs et sur le processus de s´election de ces derniers.
Mots-cl´es : D´ecision d’exportation, marges du commerce, contraintes financi`eres Classification JEL : D24, F14, F10, D92
∗For very useful comments and discussions, we thank Kenza Benhima, Anne-C´elia Disdier, Ann Harrison and Farid
Toubal, as well as participants at the 10th ETSG conference, RIEF VIIIth meetings, and SMYE 2008 conference. All remaining errors are ours.
†European University Institute and Paris School of Economics. Address : Max Weber Programme, Villa La Fonte,
Via delle Fontanelle 10, I-50014 San Domenico, Italia. Tel: (0039) 055 4685 853. E-mail: Nicolas.Berman@eui.eu.
‡EQUIPPE-University of Lille. Universit´e de Lille 1, Facult´e des Sciences ´Economiques et Sociales, USTL - Cit´e
Scien-tifique - Bˆat SH2, 59655 Villeneuve d’Ascq Cedex, France. Tel/Fax: (33) 1 44 07 82 71/47, Email: jerome.hericourt@univ-lille1.fr
I
Introduction
Three important facts have been pointed out by recent literature in international trade. First, firms may face important fixed, start-up costs when entering the export market, to gather information on foreign markets, establish a distribution system, or more generally to adapt their product to foreign tastes and environment. Second, firms are greatly heterogenous in terms of productivity. Together with the existence of fixed costs, this heterogeneity contributes to explain why all firms do not engage in international trade, why exporters are more productive than domestic producers, and why an important share of variations in total exports comes from the adjustment of the extensive margin of trade - i.e. of the number of exporters (Melitz, 2003, Eaton et al., 2004, Bernard and Jensen, 2004). Third, at the macro level, financial development exerts a significant and positive impact on bilateral trade flows (Beck, 2002, Beck, 2003, Berthou, 2006, Manova, 2007), both on the number of bilateral flows and on the mean value of shipments, suggesting that heterogeneity in terms of access to finance (within and between countries) may be an important determinant of exporting behavior at the micro level.
As they stand, firm-level studies have generally focused on the role of fixed costs and productivity on exporting decisions. The effect of financial constraints on international trade has been mainly stud-ied at the country or sectoral level. There is a striking lack of evidence both of the impact of firms’ access to finance on their exporting behavior and of the elements underlying the positive influence of financial development on international trade. A comprehensive study of the relationship between finance and trade at the firm level may thus improve our understanding of the impact of financial development on trade, as well as of the role of productivity and fixed costs on exporting behavior.
By studying the impact of financial constraints, productivity and financial development on both the extensive (i.e. the exporting decision) and the intensive (i.e. the amount exported by firm) margins of trade, this paper aims at filling these gaps. We first present a simple model based on Chaney (2005), in which firms are heterogenous both in terms of productivity and access to external finance. We study the determinants of their exporting behavior, and the impact of financial development on trade at the firm-level. We then test our main results using a large cross-country, firm-level database containing 5,000 firms in 9 developing and emerging countries.1 Our findings, both theoretically motivated and
empirically supported, can be summarized as follows. First, both productivity and firms’ access to external finance have a positive impact on exporting probability, but only productivity significantly increases the value of shipments. The role of financial constraints seems to be mainly concentrated
at the time of entry. Neither the quantity exported nor the probability of remaining an exporter are affected by financial constraints. This is in line with the existence of sunk costs which have to be paid to access the export market. Our results suggest that once the firms have become exporters, the potential fixed cost that they have to pay at each subsequent period is dramatically lower. These results are robust to the use of instrumental variable specifications, and to the consideration of several additional controls, including capital intensity or innovation.
Second, access to finance and productivity interact positively: productivity becomes increasingly important for the exporting decisions as financial constraints decrease. Productivity will in fact not matter at all if the firms do not hold any liquidity, or are prevented from entering the export market because of their lack of access to external financing. Put differently, credit constraints generates a disconnection between firms’ productivity and export status. This explains the imperfect selection of firms into the export market with regard to their productivity: While recent international trade theories, following Melitz (2003), predict that, for a given foreign market, all firms with productivity higher than a given threshold will export, evidence shows that, whatever the measure used to compute productivity, this is far from being true (see for example Eaton et al., 2004). Even if productivity and exporting status are overall positively correlated, an important number of low productivity firms do export, and some high productivity firms do not. Therefore, we propose in this paper an explanation of this fact based on the imperfect correlation between firms’ productivity and access to finance.
Third, a direct implication of this result is that financial development exerts a positive impact on trade flows not only because of it allows more firms to export, but also because it reduces this artificial disconnection between productivity and exports generated by liquidity constraints. Interacting firms’ productivity with the country’s level of financial development, we find that productivity is a stronger determinant of exporting decision in more financially developed countries. By reducing the strength of credit constraints in the economy, financial development allows firms which are productive enough to enter foreign markets. Financial development acts thus positively both on the number and on the selection of firms: firms that enter the export market when financial market becomes deeper are the most productive of the financially constrained firms. As a result, both the extensive and the intensive margin increases.
To our knowledge, only two papers looks at the impact of financial constraints on trade at the firm-level. The first is Greenaway et al. (2007), who study the impact of firms’ financial health on firms’ exporting decisions on a panel of UK manufacturing firms. Greenaway et al. (2007) find that ex-porters significantly display a better financial health than non-exex-porters. This result seems however to be mainly driven by the fact that financial health is improved by the participation to exporting
activities. At the time of entry, exporters do not seem to be financially healthier than domestic produc-ers. On the contrary, Forlani (2008) has found exporting probability to be negatively and significantly affected by financial constraints on a panel of Italian firms. We focus here on developing countries, in which financial constraints may be much stronger and more binding; more importantly, we depart from these previous works by studying both margins of trade, by considering the possible interaction between productivity and access to finance, and the impact of financial development at the micro level. This paper contributes to the existing literature at various levels. First by improving the under-standing of the relationship between firms’ financial constraints and trade at the firm level. Second, by providing micro evidence of the role of financial development on trade. Third, our results support the view of fixed costs as an important feature of international trade, especially in presence of financial market imperfections. The joint consideration of the extensive and intensive margins of trade is thus especially important for the understanding of trade flows, and for the study of the impact of aggregate shocks (in particular monetary shocks) on trade and macroeconomic adjustment.
The next section proposes a simple model from which we derive the main testable propositions. The empirical methodology is described in section III. Section IV reviews the data, while section V presents the results. Sections VI concludes.
II
Theoretical Underpinnings
1 Basic environment
There are two countries, Home and Foreign, the latter being denoted by an asterisk. We consider the export decision of a firm with productivity ϕ in the home country. There are two sectors in the economy. The first provides a single homogenous good, freely traded, used as the numeraire. Its price is set equal to 1. This sector gives wages w at home and w∗ abroad. The second sector supplies a
continuum of differentiated goods. Workers are endowed with one unit of labor, consume each variety of the differentiated goods in quantity q(ϕ) and q0 units of the homogenous good. Each firm is a
monopolist on its variety. Utility is given by: U ≡ q01−γ ³ Z X q(ϕ)σ−1σ dϕ ´ σ σ−1 (1)
and imported. Dixit-Stiglitz monopolistic competition yields the following demand function: r(ϕ) = γwL³ p(ϕ) P ´1−σ P ≡ ³ Z X p(ϕ)1−σdϕ ´1/(1−σ) (2)
where P is the ideal price index and L is the number of households in the economy. Demand for a variety produced by a firm with productivity ϕ thus both depends on the prices of the firm and on the prices of all its competitors. To access the foreign market, the firm faces a fixed cost Cf. The cost function is then given by:
cf(qf) = qfwϕ + wCf (3)
Monopolistic competition implies that the price of a variety produced by firm ϕ charged on the foreign market is:
pf(ϕ) = σ − 1σ wτϕ (4)
which is simply the domestic price multiplied by an ’iceberg’ trade cost τ > 1: firms have to export τ q units of their variety in order to sale q units of it in foreign country. Export-related profits are then:
πf(ϕ) = µσw∗L∗(σ − 1σ ϕPwτ∗)1−σ− wCf (5)
A firm will only export if its profits are positive. Firms with higher productivity ϕ generate higher operating profits, and are thus more able to cover the fixed cost and to make positive total profits. In absence of borrowing constraints, only firms’ productivity determines the entry behavior on the foreign market. We can define a cut-off of productivity ϕf such as πf(ϕ) = 0. All firms with productivity
ϕ > ϕf export.
2 Productivity, access to finance and exports
Suppose now that firms are heterogenous in terms of both productivity and exogenous collateral. Each firms draws an exogenous amount of collateral, wΩ in terms of the numeraire, and a productivity ϕ from two independent distributions, with cumulative distribution functions respectively denoted F (.) and G(.). Both distributions are supposed to be independent. However, depending of their shapes, they may be more or less correlated.
Ω represents the firm’s financing capacity, or the inverse of credit constraints. From an empirical standpoint, it can be proxied by different variables which have been shown to influence banks’ loan supply (liquidity, cash flow, asset tangibility). We call Ω “collateral”, but it can be understood more generally as the determinants of a firm’s access to external finance. We come back to this point in the next section.
The amount that can be borrowed by a firm is proportional to Ω. More precisely, it equals µΩ, with µ > 1 being the inverse of the extent of credit constraints in the home country (an increase in µ means a reduction of credit constraints). Here we suppose that the credit constraint only affects the fixed cost of export. To finance its entry, the firms needs to own a sufficient amount of collateral. Then in addition to the profit condition, the firm faces the following borrowing constraint:
Cf ≤ µΩ (6)
The exporting decision thus depends on both export-related profits (5) and borrowing constraint (6):2 πf(ϕ) = µσw∗L∗(σ − 1σ ϕPwτ∗)1−σ − wCf > 0 Cf ≤ µΩ (7)
Productivity increases the exporting probability through its positive impact on export-related profits, while collateral increases the exporting probability for a given productivity by relaxing the constraint. More formally, exporting probability can be written:
P {πf(ϕ) > 0/µΩ>Cf} = P (ϕ > ϕ) × P (Cf < µΩ) = h 1 − F (ϕ) i × h 1 − G(Cf/µ) i (8)
If a firm both gets a sufficient productivity and collateral, P {πf(ϕ) > 0/µΩ>Cf} = 1. For
uncredit-constrained firms, i.e. those owning a sufficient collateral, P {πf(ϕ) > 0/µΩ>Cf} = P (ϕ > ϕ) < 1,
which increases with productivity, and depends on the shape of the distribution of productivity G(.). Finally, P {πf(ϕ) > 0/µΩ>Cf} = 0 for credit constrained firms. Thus, our first and intuitive result is that both a larger ϕ and a larger Ω increases exporting probability:
Proposition 1: The exporting probability, P {πf(ϕ) > 0/µΩ>Cf} is increasing with productivity ϕ
and access to finance Ω. 2We assume zero interest rate.
More interestingly, this simple framework emphasizes an additional effect of credit constraints: they disconnect firms’ productivity and exporting decisions. More precisely, as shown above, productivity matters for exporting decision only if firm’s collateral is above a given level Cf/µ. Productivity thus
becomes increasingly important for exporting decision as collateral increases.
Proposition 2: The positive effect of firms’ productivity ϕ on its exporting probability P {πf(ϕ) > 0/µΩ>Cf} is increasing with firms’ access to finance Ω.
Empirically, this can be tested by an interaction term between productivity and a proxy for firms’ access to finance, whom coefficient is expected to be positive. Of course, this result is only true if ϕ and Ω are independent. This may not be the case, for example because firms’ collateral depends positively on their profit on the domestic market which is itself positively related to productivity. However, an empirical assessment of proposition 2 can be used to indirectly get information on whether these elements are independent or not.
More precisely, suppose that Ω is the product of two components: Ωϕ, which is proportional to
firms’ productivity ϕ, and ΩE, which is independent from ϕ. Empirically, we can construct proxies for
both Ω and ϕ, but we do not have direct information on the respective sizes of Ωϕ and ΩE. Controlling
for productivity, we capture empirically the effect of the component of firms’ access to finance which is independent from their productivity, ΩE. As productivity increases, the share of this component in
overall access to finance Ω decreases: ΩE becomes less and less important in firms’ exporting
probabil-ity as productivprobabil-ity ϕ increases. The effect of the interaction between ϕ and Ω on exporting probabilprobabil-ity should thus be negative, in contradiction with proposition 2. Our results will support proposition 2, suggesting that productivity and access to finance are mainly independent.
Export revenues, i.e. the intensive margin of trade at the firm-level, are simply given by foreign demand multiplied by the firm’s price:
x(ϕ) = r∗(ϕ) = µ σw ∗L∗( σ σ − 1 wτ ϕP∗)1−σ (9)
This expression depends positively on foreign demand and productivity, but not on collateral. This result directly comes from the hypothesis that financial constraints only affect the fixed cost of export. Our empirical results will support this assumption.
Proposition 3: ∂ϕ∂x > 0,∂Ω∂x = 0: The intensive margin is increasing with productivity ϕ but un-affected by access to finance Ω.
3 Financial Development
A deepening of financial markets, i.e. an increase in financial development is usually associated to a lowering of credit constraints.3 Here, this aggregate decrease of credit constraints can be modeled
in two ways, which are conceptually similar and yield the same main results. First, a deepening of financial markets can also be assimilated to an increase in µ. From a level µ0 aggregate credit
constraints become µ1 = µ0+ ∆µ0: for a given distribution of collateral, each firm becomes less credit
constrained. Second, financial development can be defined as a deepening of financial markets which increases the mean of the collateral distribution G(.) without affecting its variance. From G0(Ω0) the
distribution becomes G1(Ω1), with G1(Ω1) = G0(Ω0+ ∆Ω0): each firm draws a higher collateral, and
this additional collateral is equally apportioned among firms. Both definitions are consistent with previous empirical works documenting the impact of financial development on financial constraints (see for example Harrison et al., 2004).
As financial system gets more developed, some of the firms that were, before the increase in fi-nancial development, productive enough to enter but prevented from doing so because they lacked sufficient access to finance, are now able to enter. Therefore, whatever its definition, the first effect of financial development is to increase the extensive margin of trade by allowing more firms to enter:
Proposition 4: P {πf(ϕ) > 0/µΩ>Cf} is increasing with financial development.
Moreover, the set of firms for which the exporting decision depends only on their level of produc-tivity 1 − G(Cf/µ) increases. Overall, financial development thus reduces the disconnection between
productivity and exporting decisions generated by credit constraints.
Proposition 5: Financial development magnifies the impact of ϕ on exporting probability.
Thus, the positive impact of financial development here both comes from its positive effect on the number and on the selection of firms: a low financial development potentially prevents highly pro-ductive firms from entering the export market. By decreasing the mean level of credit constraints, a deepening of financial markets first benefits to those firms which productivity is above the cutoff ϕf.
The size of this additional effect on total exports depends on the correlation between ϕ and Ω: as soon as this correlation is positive, entrants will increase average productivity. Financial development may thus act positively on firms’ selection into the export market, both improving the extensive and the intensive margin (as average productivity is higher, the mean value exported is higher).
Finally, the positive effect of financial development is magnified by the level of firm’s collateral. What-ever the definition of financial development, its effect will be positive only for firms owning a level of collateral close to Cf/µ: only those firms will be able to enter following an increase in µ or after an
increase in the mean of the collateral distribution. In other words, financial development magnifies the importance of firms’ collateral on their exporting decision:
Proposition 6: Financial development magnifies the impact of Ω on exporting probability.
In the next section, we present the data, before turning to the empirical part in which we present our methodology to test these propositions.
III
Data
1 Database
To assess the empirical relevance of these theoretical predictions, we use a large firm-level database constructed from different Investment Climate Surveys made by the WorldBank.4 Those surveys aim
at studying business environment in developing and emerging countries. As we are both interested in participation and entry / exit behavior into export market, we only have collected the data from surveys in which firm-level information were available for different years. We are left with nine countries5 and
around 5,000 firms, each of them being present in the database at least two years - with a maximum of four years for Chinese firms. In each country, industries were selected non-randomly in order to focus on the main producing sectors. Within each industry, firms were chosen randomly and their composition is therefore representative of the population. The time period differs across the countries, but is always comprised between 2000 and 2005. For each firm, information is available in average for three consecutive years inside this period. The data includes accounting information on sales, inputs, labor, capital stock, investment and several other expenditures; broader information is also included, such as ownership structure, labor force characteristics, relations with competitors, clients and suppliers,
4Available at http://www.enterprisesurveys.org.
innovation, and market environment and investment climate. As the data is denominated in home currency, we have converted it into US dollars using yearly exchange rates from the International Financial Statistics. Finally, we have restricted our sample to firms which present strictly positive sales and assets, and positive or null debt and interest payments.
2 Variables of interest
Credit constraints are proxied in three different ways. Previous works typically computes the correla-tion between investment and measures of internal (cash flow) or external (debt) funds, after controlling for other factors, to identify credit constraints. Significant correlations are usually attributed to cap-ital market imperfections and therefore suggest the presence of financing constraints.6 In this paper, we use first the ratio of total debt over total assets, that can be interpreted as both a measure of the firm’s lack of collateral and of the firm’s current demand for borrowing relative to its capacity to borrow. Second, the ratio of cash flow over total assets gives an indication on the volume of funds that can be mobilized on a very short-term basis by the firm. These two indicators have been widely used in the literature dealing with financial constraints (see e.g. Harrison and McMillan (2003)). Third, several works have shown that when financial contractibility is poor (which is more likely to be the case in developing countries), external finance requires higher proportions of assets that more easily remain with investors if the relationship deteriorates (Braun, 2003). We then use the ratio of firms’ tangible assets over total assets as a third measure of access to finance. We take the inverse of the first ratio, so that an increase of each measure represents a decrease in financial constraints. Due to data availability, we proxy tangible assets by machinery and equipment.
Productivity is measured here by the ratio of value added over the number of workers.7 Finally,
based on previous firm-level studies in international trade8, we also include as controls firm’s size
(measured by the logarithm of assets) and nationality (binary variable, which takes the value of one if the company is foreign9, 0 otherwise).
Descriptive statistics are given in Table 1. Around 40% of the firms of our sample are exporters. This share does not really differ across countries: except for India (80% of exporters), the share of 6See the surveys by Schiantarelli (1996), Blundell et al. (1996), Hubbard (1998) or Claessens and Tzioumis (2006). 7The time dimension of our data prevents us to compute proper total factor productivity. However, as a robustness check, we have included the labor to capital ratio in our estimations. The results are unchanged.
8See among others Bernard and Jensen (2004), Bernard and Wagner (1998), Greenaway et al. (2007).
9We define a firm as foreign when foreign participation in its capital is at least 49 percent; it is otherwise defined as domestic. This threshold is commonly used in firm-level data literature (see among others Harrison and McMillan, 2003). It should also be noted that in our sample, firms are mostly either completely owned by domestic or foreign private sector, so that the choice of the threshold does not influence our results.
exporting firms is comprised between 35 and 55% in each country. Consistent with previous literature, exporters are twice larger than non-exporters, display a much higher productivity and a higher ratio of foreign currency denominated debt over total debt. Although larger for the exporters sub-sample, the ratio of cash flow over total assets is not very different across the two sub-samples. In the same way, the difference in terms of asset tangibility is not striking. However, as both elements may also reflect sector-specific technological elements (Rajan and Zingales, 1998, Braun, 2003), these descriptive statistics do not allow to conclude about the importance of firms’ access to finance on their exporting status. We now turn to a more careful empirical analysis of these relationships.
IV
Empirical Methodology
We first presents our methodology to test propositions 1 to 3, related to the impact of firms’ access to finance and productivity on both margins of trade. We then assess empirically the impact of financial development on firms’ exporting decision, as well as how it depends on firms’ characteristics (propositions 4 to 6).
1 Productivity, Access to Finance and the Margins of Trade
We want to determine whether: (i) the exporting decision depends positively on firms’ productivity and access to finance; (ii) a better access to finance magnifies the positive impact of productivity on exporting decision; (iii) the value of shipment only depends on productivity.
Propositions 1 and 2: Extensive margin
Because the exporting decision is a discrete variable by definition equal to 0 or 1, the probit model with a discrete binary endogenous variable is appropriate. Hence, the exporting probability of a firm i operating in country c during year t is:
P rob(Xict > 0) = 1 if αiUict+ βϕict+ γΩict+ ηck+ λt+ ²ict > 0
P rob(Xict> 0) = 0 otherwise (10)
where ϕict is the logarithm of the firm’s productivity, Ωict is our proxy for firm i’s access to external
finance, and Uict is a vector of control variables including firms’ size and nationality. The coefficients
of the above variables on the exporting probability.
We estimate specification (10) with a full set of country and industry dummies to account for unobservable characteristics at the country and industry level (ηck). We also include year dummies (λt). Due to the limited degrees of freedom, we cannot account for firm-fixed effects, even in a logit
specification.10
Firm’s productivity, size and nationality are expected to have a positive impact on exporting de-cision (β, αi > 0). We expect the signs of estimated coefficients on our proxy for access to finance
(either the ratio of total assets over total debt, cash flow over total assets, or tangible assets over total assets) to be positive, i.e. γ > 0. We expect a positive sign on the first proxy, i.e. on the inverse of the ratio of total debt over total assets, since the more a firm is indebted, the less it is likely to be able to face the fixed cost of entering the exporting market. The rationale for the expected positiveness of the second proxy - the ratio of cash flow over total assets - is symmetric: the more short-term liquidity the firm has, the more likely it will be to be able to enter the export market of to export more, either through external or self-financing. Finally, firms owning a more important amount of tangible assets may get a better access to external finance and be more able to enter the export market.
Our theoretical framework is static, and does not allow to distinguish between fixed and sunk costs of exports. There are however many reasons to believe that sunk costs, i.e. the costs of entering the export market for the first time, and fixed costs, i.e. the costs of maintaining an activity on the export market, are fundamentally different, and that the firsts are higher.11 Finance should then matter more for firms that enter the market for the first time. To account for this point, we further estimate this specification on two different subsamples, respectively characterized by the conditions Xi,t−1 > 0 and Xi,t−1 = 0. The results on the first subsample give the role of our regressors on the
probability of remaining an exporter (which is the opposite of the probability of exiting the export mar-ket), while the second subsample gives their impact on the firms’ entry decision into the export market.
To assess the relevance of proposition 2, we interact firm’s productivity with its level access to external finance. Our specification becomes:
P rob(Xict > 0) = 1 if αiUict+ βϕict+ γΩict+ ψ(ϕict× Ωict) + ηck+ λt+ ²ict> 0
P rob(Xict > 0) = 0 otherwise
(11)
We expect ψ to be positive, i.e. productivity becomes increasingly important as access to finance 10See the next section for more details.
increases.
Proposition 3: Intensive margin
The impact of financial factors on the intensive margin of trade is estimated by replacing the de-pendent variable by the value of export. The relationship is estimated with a standard linear equation which can be written as follows:
Log(Xict) = θiUict+ ρϕict+ δΩict+ ηck+ λt+ µict if Xict> 0 (12)
This equation is estimated only on the subsample of exporting firms (i.e. under the condition Xict> 0).
Here again, we expect the signs of the coefficients on firms’ productivity, size and nationality to be positive (ρ, θi> 0). Our contention is that the impact of financial may be, because of the existence
of fixed costs of exports, more important on the extensive margin than on the intensive one. We thus expect our financial proxies to have either no impact (δ = 0) or a lower impact (δ < γ) on the intensive margin. The difference in terms of significance between γ and δ should give information on the role of fixed costs in the relationship between finance and trade. More precisely, a larger γ will suggest the role of finance on export is mainly due to the existence of fixed costs of exports.
2 Financial Development and the exporting probability
As exposed in the previous section, financial development may have different impacts on exporting decisions. In should increase, overall, the exporting probability (Proposition 4). At the same time, it should modify the role of firms’ productivity and access to finance in affecting exporting behavior (Propositions 5 and 6).
To test these results, we both introduce the country’s level of financial development and its inter-action with our variables of interest, namely firms’ productivity and financial health. Specification (10) becomes:
P rob(Xict > 0) = 1 αiUict+ βϕict+ γΩict+ ν(ϕict× F Dc) + ξ(Ωict× F Dc) + ηck+ λt+ ²ict > 0
P rob(Xit> 0) = 0 otherwise
where F Dt represents the average level of financial development of country c during the period. In
the above specifications, the financial development variable alone does not appear, since it is captured by country-specific dummies. Following the literature on finance, growth and trade12, we use as a
proxy for financial development the ratio of private credit to GDP. To ensure that our results are not biased due to omitted variables correlated with country’s financial development, we include as controls several other country’s characteristics, including GDP growth, inflation, and institutions. Following propositions 5 and 6, we expect ν and ξ to be positive, reflecting the fact that financial development disproportionately increases the exporting probability of productive, and financially healthier firms.
3 Econometric issues
In order to check for potential multicollinearity between regressors, we compute the Variance Inflation Factor (VIF) for each regressor. VIF shows how the variance of an estimator is inflated by the presence of multicollinearity. The larger the value of VIF, the more collinear the variable. A common rule of thumb is to consider a VIF exceeding 10 as an indication of high collinearity of the considered variable (cf. Gujarati, 2004). Table 2 (Appendix) provides VIF of each variable, including alternatively proxies for financial constraints. The results confirm that our variables do not suffer from any multicollinearity problem.
Regarding the extensive margin, since our sample generally contains three years by firm (cf. Data section supra), we are left with an insufficient time variance to include firms fixed effects in a logit model estimation.13 We decided therefore to estimate equation (1) with a probit model in levels with
additional controls (country and industry dummies, firm-level control variables like size and foreign status). Still due to the limited degrees of freedom, we cannot perform any non-linear instrumental variables estimation for the exporting probability. We then test the endogeneity of the right-hand side variables. We regress each instrumented variable on its own lags and on other exogenous variables. Residuals of all these first stage regressions are introduced afterwards in equations 10 and 11, and a Fisher test for joint significance of all residuals is implemented to provide a diagnosis on endogeneity. Since the null hypothesis cannot be rejected in a number of cases, we decide to report a double set of estimates for each specification. A pooled probit based on contemporaneous values of regressors is first reported, completed by another one relying on first lagged values of right-hand side variables.
12See among others King and Levine (1993), Aghion et al. (2005), Beck (2002), Beck (2003).
13When either export = 0 or export = 1 for all observations for a firm, this firm’s contribution to the log-likelihood is zero. This leads therefore to drop a major part of our sample during the maximization process.
Regarding the intensive margin, the linear form of equation 12 allows the inclusion of fixed effects in spite of the short time dimension, at least for standard OLS estimation. Indeed, the control for a possible endogeneity bias requires to perform a two-stage least squares (2SLS)14 estimation, using
two lags of current period regressors as instruments. Our panel displaying three years, the 2SLS are therefore performed over a single year. We check the validity of our instruments (two lags of current period regressors) using two different tests. The Hansen’s J statistic of overidentifying restrictions cannot reject our set of instruments. We also report the F-stat form of the Cragg-Donald statistic suggested by Stock and Yogo, 2002 as a test for weak instruments. All statistics are well above the critical value, confirming that our choice of instruments is appropriate.15 The next step is to perform
the Durbin-Wu-Hausman test for exogeneity of regressors. In most (but not all) cases, the null hy-pothesis of exogeneity cannot be rejected. For equation 12, both OLS and 2SLS estimates are therefore reported.
In addition, we implement the Heckman two-stage procedure to correct for a potential selection bias. For each of our financial variables, two types of procedures are implemented. One is the standard Heckman procedure, relying on OLS estimation for the linear equation. The other one accounts for a possible endogeneity bias by using 2SLS for estimating the intensive margin equation, following the recommendations by Wooldrigde, 2002. To make comparisons more meaningful, we restrict the sample on the OLS estimates to match the 2SLS one.
In line with recent literature in international trade (Helpman et al., 2008), we use firm-level selec-tion variables, who proved to influence the exporting decision (equaselec-tion 10), but not the volume of exports (equation 12).16 The variables used depend on the financial proxy included in the estima-tion. More precisely, we use labor regulations (Total Assets/Total Debt), custom regulations (Cash Flow/Total Assets) and transport costs (Tangible Assets/Total Assets). Available in the World Bank Enterprize Surveys, all these variables can be seen as various indicators of business constraints. They take the value 1 if the firm sees these regulations/costs as a major or severe obstacle for the operation and growth of its business, 0 otherwise.
Regarding the significance of our estimates, the structure of our data confronts us with the prob-lem of clustering of errors. It is to be expected that observable and unobservable characteristics of the 14The 2SLS estimation is a special case of the Generalized Method of Moments (GMM) approach (Verbeek, 2004). Contrary to studies that include the lagged dependent variable in the exogenous set, our estimations do not suffer from any systematic bias, which is traditionally solved by taking a (GMM) estimation.
15Besides, all F-statistics of first stage regression (available upon request) are well above ten, conforming to the rule of thumb edicted by Staiger and Stock, 1997.
firms within the same industry and country are correlated (cf. Moulton, 1986, Moulton, 1990). In this paper, in addition to the standard White correction for heteroskedasticity, we correct for clustering using the Froot’s correction (Froot, 1989). We therefore correct for the correlation of errors between firms within a specific industry and country.
V
Results
1 Finance, Productivity and the Margins of Trade
Proposition 1: Finance and the Extensive Margin of trade
Table 3 presents the results of the basic estimations, i.e. the impact of financial constraints, as well as the role of firms’ size, productivity, and nationality on its exporting probability. Columns (a) and (d) present the results using the first financial proxy, i.e. the ratio of total assets over total debt, columns (e) to (h) contains the estimations using the second proxy, i.e. the ratio of cash flow over total asset, and columns (i) to (l) depicts the results based on the third proxy, i.e. the ratio of tangible assets over total assets. If significant, the coefficients on all three proxies are expected to be positive, reflecting the impact of better access to finance on exporting probability.
For each proxy, we present both the specifications using the current values of our regressors, and the lagged specifications, since the Fisher statistics reject exogeneity in columns (b) and (f). We include separately each financial proxy in order to maximize the number of available observations for each estimation.
The estimated coefficients of the traditional determinants of export decisions have the expected signs. Exporters are found to be larger and more productive than domestic producers. Foreign-owned firms export more than domestic ones. Coefficients on our financial proxies are positive and significant. Note that the inclusion of those variables only affects the coefficient on productivity, which tends to de-crease slightly. As mentioned before, as productivity and financial health are positively correlated, the omission of financial variables may lead to an over-estimation of the role of productivity on exporting decision. Our results indeed suggest that a part of the positive effect of productivity found previously was due to the non-consideration of financial variables. However, productivity remains significant in explaining exporting probability in all estimations.
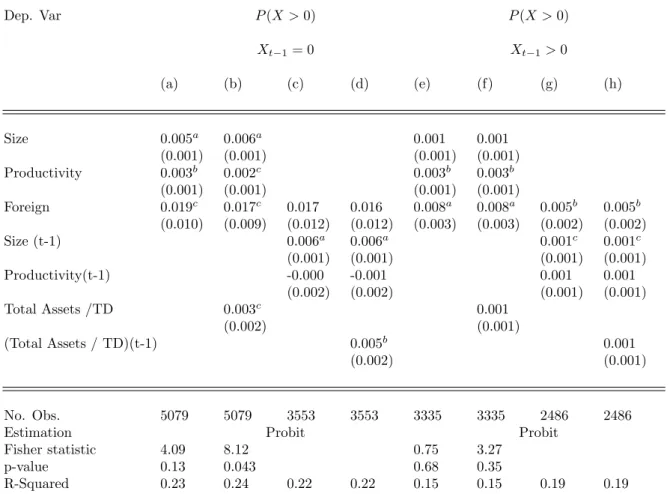
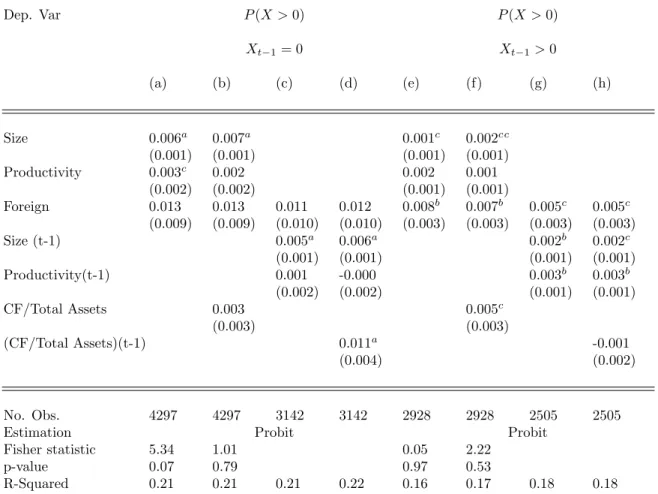
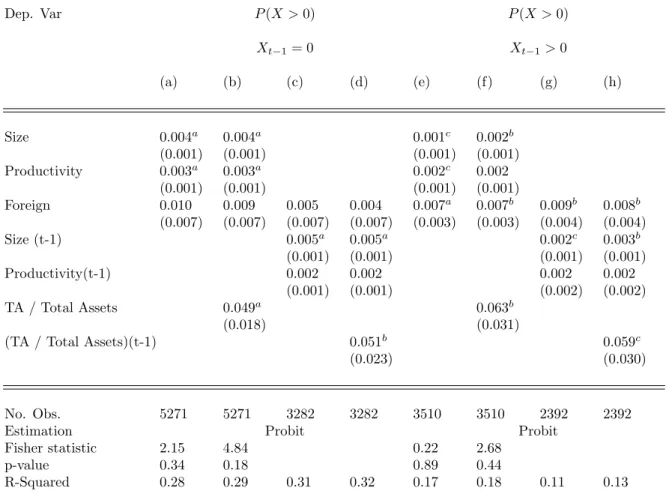
In tables 4, 5 and 6, we decompose the effect on exporting probability between the entry proba-bility (if Xt−1 = 0, columns (a) to (d)) and the probability of remaining an exporter (Xt−1 > 0,
columns (e) to (h)). Table 4, 5 and 6 respectively contains the results using the first, the second and the third proxy for financial constraints. Here again, as exogeneity is occasionally rejected, we present both the current values and the lagged specifications. Our control variables affect differently both sub-samples: size is more significant in determining the entry decision than the probability of remaining an exporter; productivity affects more the second probability. More importantly, our financial proxies are mainly significant in explaining the entry probability, but do not greatly influence the probability of remaining an exporter once the firm has entered (columns (d) and (h) of each table). These results support the existence of sunk costs which have to be paid to access the export market. Once the firms became exporters, the potential maintenance cost that they have to pay at each subsequent period are dramatically lower, thus dampening the impact of financial constraints on exporting probability. This is consistent with the recent evidence of fixed costs found by Das et al. (2007): according to their results, export penetration costs account for between 18.4 and 41.2 percent of the annual value of a firm’s exports. The fixed costs associated with the continuation of the exporting activity are however considerably lower, i.e. around 1% of the value of exports.
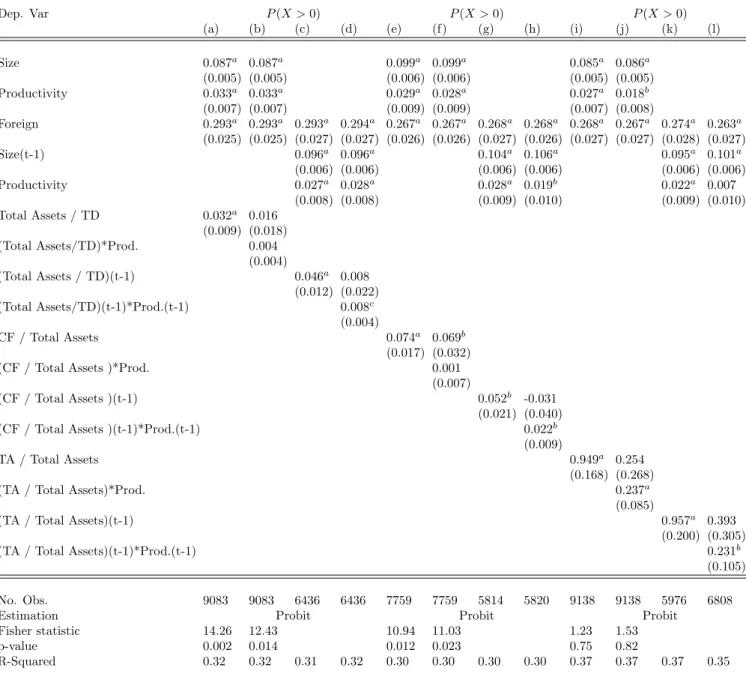
Proposition 2: Finance, Productivity and Exporting Probability
Table 7 includes, in addition to the previous regressors, interacted terms between each of our fi-nancial proxies and productivity. As Proposition 2 suggests, the existence of fifi-nancial constraints may generate a disconnection between export status and productivity. When firms have a restricted access to external finance, variations in productivity will not have any effect on their exporting decision. The coefficient on the interaction term is thus expected to be positive, i.e. a decrease in productivity should have a stronger impact on exporting probability when financial constraints are low (for high values of our financial proxies).
Results presented in Table 7 are in line with these intuitions: coefficients on the interaction term between financial health and productivity are positive and significant in (d), (f), (h), (j) and (l). The impact of productivity on exporting decision is thus stronger in financially healthy firms. More precisely, for the more financially constrained firms (defined as the ones below the first quartile of each financial proxy), the impact of productivity on exporting decisions is insignificant. Productivity only matters above a given threshold of access to finance.
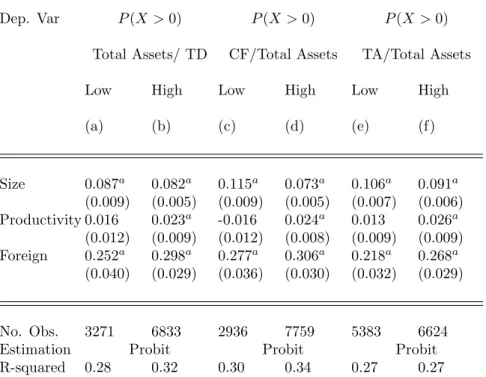
Another way to look at this disconnection between productivity and export status is too run our basic estimation on different subsamples, defined according to the level our different financial proxies.
In table 8 we separate our sample with respect to the level of firms’ access to finance. More precisely, we run separately estimations on firms that have a low (respectively high) access to finance, as defined by the first (resp. last) quartile of each of our financial proxies.17 The effect of productivity strongly
differs on both subsamples: while firms’ size and foreign status positively and significantly affects exporting probability in all estimations, productivity is found to improve the exporting probability only in firms characterized by a sufficient access to finance.
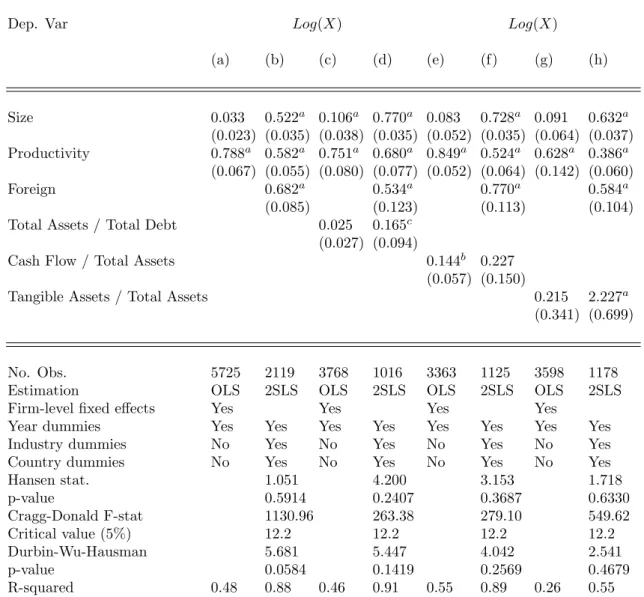
Proposition 3: Finance and the Intensive Margin of trade
Following proposition 3, we expect the impact of financial constraints on the intensive margin to be insignificant: if they only prevent firms from paying their fixed costs, but do not influence the marginal costs, then only the extensive margin, i.e. the exporting probability should be affected by our financial proxies. Table 9 presents the results on the intensive margin, i.e. on the size of exports by firm; columns (c) to (d) present the results using the first financial proxy, while columns (e) to (f) use the second one and (g), (h) contain the results with our third proxy. We only consider here exporting firms, thus estimating equation 12 above under the condition Xt> 0. For each estimation,
we check the robustness of our results to endogeneity by running 2SLS estimations. Both Hansen test of overidentifying restrictions and Cragg-Donald F-statistic of weak instrument strongly support the choice of our instruments. Regarding endogeneity concerns, Durbin-Wu-Hausman test cannot reject exogeneity of our regressors in the specifications including the financial proxies. We will then primarily rely on the OLS results, since they are more efficient (Pagan, 1984).
While both firms’ size, productivity and foreign status are strongly significant in explaining the size of exports, no strong evidence emerges from the coefficients of our financial proxies. In our preferred specifications, they are generally found to be insignificant, excepted for the ratio of tangible assets over total assets. If finance may have a small significant impact on the intensive margin, those results are more in line with the fixed costs hypothesis, according to which the role of finance on trade is mainly concentrated at the time of entry.
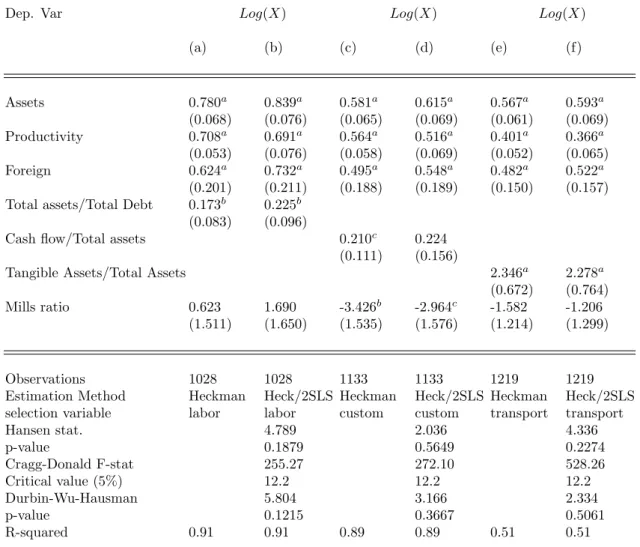
We check the robustness of these results in table 10 by using a Heckman selection model. Over-all, the evidence in favor of selection is not overwhelming. The inverse of Mills ratio is significant only for the specification including the ratio of Cash Flow over Total Assets (columns (c) and (d)). For the two others, the inverse of Mills ratio is not significant, and previous estimations from Table 9 can therefore be considered as reliable. Regarding columns (c) and (d), the volume of exports is impacted
by the ratio of Cash Flows over Total Assets with a low significance. More generally, the conclusions arising from Table 9 are confirmed: the impact of financial factors of the intensive margin of trade is either very low or insignificant.
Put together, Tables 3 to 10 shed new light on the role of finance on international trade patterns. Our results first suggest that a better financial health exerts a positive role on the probability of becoming an exporter - or, in other words, that financially healthy firms have more ability to meet the fixed cost of export. Once they are exporters, financial health do not seem to help firms to remain on the foreign market. Financial health still has a small positive impact on the value of exports, but most of the effect on total export comes the entry probability. Finally, both heterogeneities in terms of productivity and access to finance matter: when the firm faces important financial constraints, productivity will not matter for its exporting decision.
2 Financial Development, productivity and exports
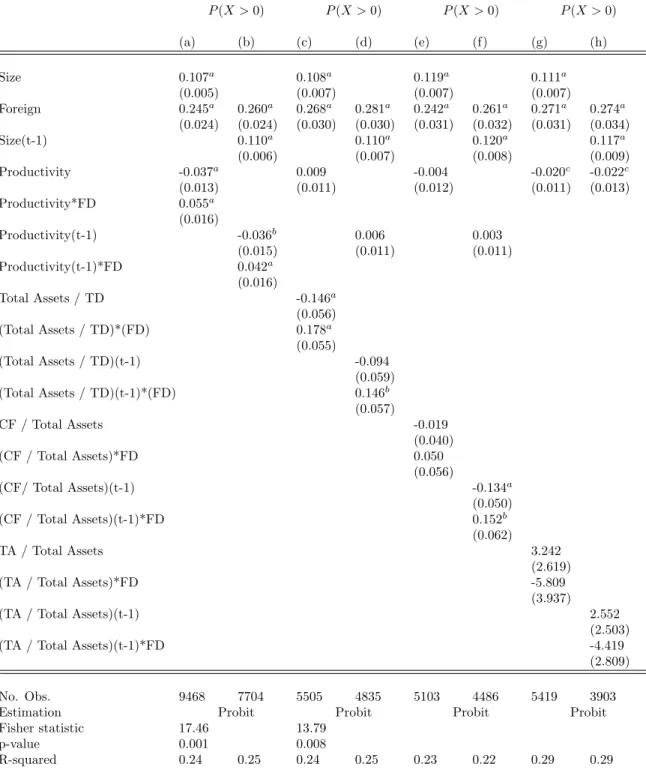
Results presented in Table 7 emphasize the disconnection between productivity and exporting decisions generated by liquidity constraints. In that context, financial development, by increasing the liquidity available in the economy, may allow some firms to enter (Proposition 4), and reduce this disconnection (Proposition 5).
In Table 11 are included interacted terms between productivity and financial development, proxied by the ratio of total private credit to GDP (columns (a) and (b)), as well as interacted terms between our financial proxies and financial development. As expected, financial development magnifies the impact of productivity on exporting probability. The coefficients on the interaction terms in columns (a) and (b) are strongly significant. This suggests that the positive impact of financial development found by previous literature (Beck, 2002, Beck, 2003, Berthou, 2006, Manova, 2007) both comes from the increase in the number of exporters and the better firms’ selection into the export market.
As emphasized previously, the impact of firms’ collateral should be larger as the financial systems expands (Proposition 6): the firms owning a collateral close to the threshold defined by the borrowing constraint (6) benefit from a deepening of financial markets. This result is confirmed by the introduc-tion of interacted terms between our financial proxies and financial development (Table 11, columns (c) to (h)). When significant, these proxies are positive, meaning that a higher financial development magnifies the effect of firm-specific financial health on its exporting decision. For a very low level of financial development, our financial proxies have very little impact on the export decision, since most firms are credit constrained whatever their level of collateral. The magnification of the impact of
financial health through financial development may come from the fact that firms in poorly financially developed countries may face important credit constraints uncorrelated with their financial health.
Those results suggest that financial development, more than only allowing more firms to enter the export market, has an impact on the exporters’ selection process: in financially developed countries, firms are both financially healthier and more productive. More firms exports, and in larger quantities.
3 Robustness
Finally, we have checked the robustness of our results to different alternative specifications. Our results are unaffected by: (i) controlling for firms’ innovating behavior (number of new products and R&D investment) and technology (capital intensity); (ii) dropping each country separately (meaning that our results are not driven by one particular country in our sample); (iii) controlling for other country-specific characteristics that may be correlated with financial development, including GDP, GDP per capita, and quality of institutions (for the last set of results, Table 11); (iv) using Random Effects probit estimations instead of pooled probit; (v) using the methodology of Ai and Norton (2003) to compute interacted effects; (vi) testing various alternative selection variables in the Heckman models.
VI
Conclusions
Using a large cross-country firm-level database on nine developing and emerging economies, we have studied the impact of financial factors on both the intensive and extensive margins of trade. Our results stress an important role of firms’ access to finance on their entry decision into the export market. However, a better financial health increases neither the probability of remaining an exporter once the firm has entered, nor the size of its exports. We also find that productivity and access to finance interact positively, productivity becoming a significant determinant of the exporting decision only above a given threshold of access to finance: in presence of important credit constraints, productivity and exporting status are disconnected.
This result has important implications: in Melitz (2003), a trade liberalization leads to intra-sectoral firms reallocations in favor of the most productive ones, and in turn generate aggregate productivity gains. Here, if financial constraints and productivity are not perfectly correlated, this positive effect of trade liberalization will not be fully observed. A direct corollary of this finding is that the effect of trade liberalization will depend on the country’s level of credit constraints. Simultaneous financial sector reforms may be necessary to maximize the gains from openness.
the number of exporters and on the selection process into the export market: in financially developed countries, exporting firms are more productive, and thus export in larger quantities. Financial de-velopment therefore affects positively the extensive margin, and (indirectly, through a better firms’ selection) the intensive margin.
This paper contributes to the recent literature which documents the significant role of fixed costs in affecting trade level and dynamics. The role of finance on trade is mainly concentrated at the time of entry. This is in line with the existence of sunk costs which have to be paid to access the export market. Our results suggest that once the firms became exporters, the potential fixed cost that they have to pay at each subsequent period are dramatically lower. Finally, while recent international model only emphasize firms’ productivity heterogeneity as a determinant of exporting status, the present work points out the importance of considering as well heterogeneity in terms of access to external finance.
References
Aghion, P., Angeletos, J., Banerjee, A. and Manova, K. (2005), “ Volatility and Growth: Credit Constraints and Productivity-Enhancing Investment ”, NBER Working Paper 11349. Ai, C. and Norton, E. C. (2003), “ Interaction terms in logit and probit models ”, Economic Letters,
vol. 80 no 1: pp. 123–129.
Beck, T. (2002), “ Financial Development and International trade: is there a link? ”, Journal of International Economics, vol. 57: pp. 107–131.
Beck, T. (2003), “ Financial Dependence and International Trade ”, Review of International Eco-nomics, vol. 11 (2): pp. 296–316.
Bernard, A. and Wagner, J. (1998), “ Export Entry and Exit by German Firms ”, NBER Working Paper W6538.
Bernard, A. B. and Jensen, J. B. (2004), “ Why Some Firms Export? ”, The Review of Economics and Statistics, vol. 86 no 2: pp. 561–569.
Berthou, A. (2006), “ Credit Constraints and Zero Trade Flows: the Role of Financial Development ”, Mimeo University of Paris I.
Blundell, R., Bond, S. R. and Meghir, C. (1996), Econometric Models of Company Investment: A Handbook of the Theory with Applications, Advanced Studies in Theoretical and Applied Econo-metrics, Volume 33, Kluwer Academic Publishers.
Braun, M. (2003), “ Financial Contractibility and Asset Hardness ”, Harvard University, Department of Economics Working Paper.
Claessens, S. and Tzioumis, K. (2006), “ Measuring firms’ access to finance ”, World Bank. Das, S., Roberts, M. J. and Tybout, J. R. (2007), “ Market Entry Costs, Producer Heterogeneity,
and Export Dynamics ”, Econometrica, vol. 75 no 3: pp. 837–873.
Eaton, J., Kortum, S. and Kramarz, F. (2004), “ Dissecting Trade: Firms, Industries, and Export Destinations ”, American Economic Review Papers and Proceedings, vol. 94 no 2: pp. 150–154.
Forlani, E. (2008), “ Firms Credit Constraints and Export Propensity ”, Mimeo CORE/Universit´e Catholique de Louvain.
Froot, K. A. (1989), “ Consistent covariance matrix estimation with cross-sectional dependence and heteroskedasticity in financial data ”, Journal of Financial and Quantitative Analysis, vol. 24: pp. 333–335.
Greenaway, D., Guariglia, A. and Kneller, R. (2007), “ Financial Factors and Exporting Deci-sions ”, Journal of International Economics, vol. Forthcoming.
Gujarati, D. (2004), Basic Econometrics, 4th edition, The McGraw-Hill Company.
Harrison, A. and McMillan, M. (2003), “ Does direct foreign investment affect domestic firm credit constraints? ”, Journal of International Economics, vol. 61 no 1: pp. 73–100.
Harrison, A., McMillan, M. and Love, I. (2004), “ Global Capital Flows and Financing Con-straints ”, Journal of Development Economics, vol. 75 no 1: pp. 269–301.
Helpman, E., Melitz, M. and Rubinstein, Y. (2008), “ Trading Partners and Trading Volumes ”, Quarterly Journal of Economics, vol. 123.
Hubbard, G. (1998), “ Capital Market Imperfections and Investment ”, Journal of Economic Liter-ature, vol. 36 no 3: pp. 193–225.
King, R. G. and Levine, R. (1993), “ Finance and Growth: Schumpeter Might Be Right ”, The Quarterly Journal of Economics, vol. 108 no 3: pp. 717–37.
Manova, K. (2005), “ Credit Constraints in Trade: Financial development and export composition ”, Harvard University, Department of Economics Working Paper.
Manova, K. (2007), “ Credit Constraints, Heterogeneous Firms and International Trade ”, Mimeo Harvard University.
Melitz, M. (2003), “ The Impact of Trade on Intra-Industry Reallocations and Aggregate Industry Productivity ”, Econometrica, vol. 71 no 6: pp. 1695–1725.
Moulton, B. (1986), “ Random Group Effects and the Precision of Regression Estimates ”, Journal of Econometrics, vol. 32 no 3: pp. 385–397.
Moulton, B. (1990), “ An Illustration of a Pitfall in Estimating the Effects of Aggregate Variables on Micro Units ”, The Review of Economics and Statistics, vol. 72 no 2: pp. 334–338.
Pagan, A. (1984), Model Evaluation by Variable Addition, in D.F. Hendry and K.F. Wallis (eds) Econometrics and Quantitative Economics,Blackwell: Oxford, chapter 5,103-134.
Rajan, R. G. and Zingales, L. (1998), “ Financial Dependence and Growth ”, American Economic Review, vol. 88 no 3: pp. 559–86.
Schiantarelli, F. (1996), “ Financial constraints and investment: Methodological issues and inter-national evidence ”, Oxford Review of Economic Policy, vol. 12.
Staiger, D. and Stock, J. (1997), “ Instrumental Variables Regression with Weak Instruments ”, Econometrica, vol. 65.
Stock, J. H. and Yogo, M. (2002), “ Testing for Weak Instruments in Linear IV Regression ”, NBER Technical Working Papers 0284.
Verbeek, M. (2004), Guide to Modern Econometrics, London: John Wiley and Sons, 2nd edition. Wooldrigde, J. (2002), Econometric Analysis of Cross Section and Panel Data, Cambridge, MA:
VII
Appendix
Table 1: Descriptive Statistics
Variable Obs. Mean S.D Q1 Median Q3
Non-Exporters
No Employees 10950 246.42 1736.36 18.00 46.50 150.00
Labor Productivity 9927 3338.84 17308.60 4.44 14.98 99.36
Cash Flow / Total Assets 7305 0.36 0.61 0.04 0.21 0.50
Tangible Assets / Total Assets 10074 0.04 0.06 0.00 0.01 0.04
Exporters
No Employees 8750 556.13 1190.35 66.00 200.00 541.00
Labor Productivity 8381 8485.30 33013.93 8.65 31.47 2960.01
Exports/Total Sales 10890 59.58 38.20 20.00 60.00 100.00
Cash Flow / Total Assets 5544 0.40 0.67 0.07 0.24 0.52
Tangible Assets / Total Assets 6340 0.04 0.08 0.00 0.01 0.04
Source: Authors’ computations from the World Bank Enterprize Surveys.
Table 2: Variance Inflation Factors
Variable VIF 1 VIF 2 VIF 3
Size 4.58 4.94 1.36
Productivity 4.57 4.91 1.35
Foreign 1.06 1.01 1.11
Total Asset / Total Debt 1.06
Cash Flow / Total Asset 1.06
Tangible Asset / Total Asset 1.06
T able 3: Financial constrain ts and exp orting probabilit y Dep. V ar P (X > 0) P (X > 0) P (X > 0) (a) (b) (c) (d) (e) (f ) (g) (h) (i) (j) (j) (l) Size 0.084 a 0.087 a 0.093 a 0.099 a 0.081 a 0.085 a (0.005) (0.005) (0.005) (0.006) (0.005) (0.005) Pro ductivit y 0.035 a 0.033 a 0.037 a 0.029 a 0.028 a 0.027 a (0.007) (0.007) (0.008) (0.009) (0.007) (0.007) F oreign 0.301 a 0.293 a 0.299 a 0.292 a 0.270 a 0.267 a 0.279 a 0.277 a 0.284 a 0.268 a 0.279 a 0.265 a (0.025) (0.025) (0.027) (0.027) (0.026) (0.026) (0.026) (0.026) (0.027) (0.027) (0.027) (0.028) Size(t-1) 0.093 a 0.096 a 0.100 a 0.103 a 0.090 a 0.095 a (0.005) (0.005) (0.006) (0.006) (0.006) (0.006) Pro ductivit y(t-1) 0.028 a 0.026 a 0.030 a 0.026 a 0.021 b 0.020 b (0.008) (0.008) (0.008) (0.009) (0.008) (0.008) T otal Assets / T otal Debt 0.032 a (0.009) (T otal Assets / T otal Debt)(t-1) 0.046 a (0.011) Cash flo w/T otal Assets 0.074 a (0.017) (Cash Flo w / T otal Assets)(t-1) 0.046 b (0.020) T angible Assets / T otal Assets 0.949 a (0.167) (T angible Assets / T otal Assets)(t-1) 0.981 a (0.187) No. Obs. 9083 9083 6643 6643 7759 7759 6125 6125 9138 9138 6149 6149 Estimation Probit Probit Probit Fisher statistic 1.25 14.26 2.00 10.94 0.58 1.23 p-v alue 0.53 0.002 0.37 0.012 0.75 0.75 R-Squared 0.34 0.34 0.31 0.32 0.31 0.31 0.30 0.30 0.36 0.37 0.37 0.37 Note: Marginal effects computed at means. All estimations include year, coun try and sector dummies. Robust standard errors in to paren theses. Significance lev els: c 10%, b 5%, a 1%. In tercept not rep orted. F ro ot (1989) correction for firm-lev el cluster correlation. 25
Table 4: Financial constraints and entry probability (1/3) Dep. Var P (X > 0) P (X > 0) Xt−1= 0 Xt−1> 0 (a) (b) (c) (d) (e) (f) (g) (h) Size 0.005a 0.006a 0.001 0.001 (0.001) (0.001) (0.001) (0.001) Productivity 0.003b 0.002c 0.003b 0.003b (0.001) (0.001) (0.001) (0.001) Foreign 0.019c 0.017c 0.017 0.016 0.008a 0.008a 0.005b 0.005b (0.010) (0.009) (0.012) (0.012) (0.003) (0.003) (0.002) (0.002) Size (t-1) 0.006a 0.006a 0.001c 0.001c (0.001) (0.001) (0.001) (0.001) Productivity(t-1) -0.000 -0.001 0.001 0.001 (0.002) (0.002) (0.001) (0.001) Total Assets /TD 0.003c 0.001 (0.002) (0.001) (Total Assets / TD)(t-1) 0.005b 0.001 (0.002) (0.001) No. Obs. 5079 5079 3553 3553 3335 3335 2486 2486
Estimation Probit Probit
Fisher statistic 4.09 8.12 0.75 3.27
p-value 0.13 0.043 0.68 0.35
R-Squared 0.23 0.24 0.22 0.22 0.15 0.15 0.19 0.19
Note: TD: Total Debt. Marginal effects computed at means. All estimations include year, country and sector dummies. Robust standard errors into parentheses. Significance levels: c10%, b5%, a1%. Intercept not reported. Froot (1989)
Table 5: Financial constraints and entry probability (2/3) Dep. Var P (X > 0) P (X > 0) Xt−1= 0 Xt−1> 0 (a) (b) (c) (d) (e) (f) (g) (h) Size 0.006a 0.007a 0.001c 0.002cc (0.001) (0.001) (0.001) (0.001) Productivity 0.003c 0.002 0.002 0.001 (0.002) (0.002) (0.001) (0.001) Foreign 0.013 0.013 0.011 0.012 0.008b 0.007b 0.005c 0.005c (0.009) (0.009) (0.010) (0.010) (0.003) (0.003) (0.003) (0.003) Size (t-1) 0.005a 0.006a 0.002b 0.002c (0.001) (0.001) (0.001) (0.001) Productivity(t-1) 0.001 -0.000 0.003b 0.003b (0.002) (0.002) (0.001) (0.001) CF/Total Assets 0.003 0.005c (0.003) (0.003) (CF/Total Assets)(t-1) 0.011a -0.001 (0.004) (0.002) No. Obs. 4297 4297 3142 3142 2928 2928 2505 2505
Estimation Probit Probit
Fisher statistic 5.34 1.01 0.05 2.22
p-value 0.07 0.79 0.97 0.53
R-Squared 0.21 0.21 0.21 0.22 0.16 0.17 0.18 0.18
Note: CF: Cash Flow. Marginal effects computed at means. All estimations include year, country and sector dummies. Robust standard errors into parentheses. Significance levels: c10%, b5%, a1%. Intercept not reported. Froot (1989)
Table 6: Financial constraints and entry probability (3/3) Dep. Var P (X > 0) P (X > 0) Xt−1= 0 Xt−1> 0 (a) (b) (c) (d) (e) (f) (g) (h) Size 0.004a 0.004a 0.001c 0.002b (0.001) (0.001) (0.001) (0.001) Productivity 0.003a 0.003a 0.002c 0.002 (0.001) (0.001) (0.001) (0.001) Foreign 0.010 0.009 0.005 0.004 0.007a 0.007b 0.009b 0.008b (0.007) (0.007) (0.007) (0.007) (0.003) (0.003) (0.004) (0.004) Size (t-1) 0.005a 0.005a 0.002c 0.003b (0.001) (0.001) (0.001) (0.001) Productivity(t-1) 0.002 0.002 0.002 0.002 (0.001) (0.001) (0.002) (0.002) TA / Total Assets 0.049a 0.063b (0.018) (0.031)
(TA / Total Assets)(t-1) 0.051b 0.059c
(0.023) (0.030)
No. Obs. 5271 5271 3282 3282 3510 3510 2392 2392
Estimation Probit Probit
Fisher statistic 2.15 4.84 0.22 2.68
p-value 0.34 0.18 0.89 0.44
R-Squared 0.28 0.29 0.31 0.32 0.17 0.18 0.11 0.13
Note: TA: Tangible Assets. Marginal effects computed at means. All estimations include year, country and sector dummies. Robust standard errors into parentheses. Significance levels: c10%,b5%,a1%. Intercept not reported. Froot
Table 7: Liquidity, Productivity, and Exporting Decisions
Dep. Var P (X > 0) P (X > 0) P (X > 0)
(a) (b) (c) (d) (e) (f) (g) (h) (i) (j) (k) (l) Size 0.087a 0.087a 0.099a 0.099a 0.085a 0.086a (0.005) (0.005) (0.006) (0.006) (0.005) (0.005) Productivity 0.033a 0.033a 0.029a 0.028a 0.027a 0.018b (0.007) (0.007) (0.009) (0.009) (0.007) (0.008) Foreign 0.293a 0.293a 0.293a 0.294a 0.267a 0.267a 0.268a 0.268a 0.268a 0.267a 0.274a 0.263a (0.025) (0.025) (0.027) (0.027) (0.026) (0.026) (0.027) (0.026) (0.027) (0.027) (0.028) (0.027) Size(t-1) 0.096a 0.096a 0.104a 0.106a 0.095a 0.101a (0.006) (0.006) (0.006) (0.006) (0.006) (0.006) Productivity 0.027a 0.028a 0.028a 0.019b 0.022a 0.007 (0.008) (0.008) (0.009) (0.010) (0.009) (0.010) Total Assets / TD 0.032a 0.016 (0.009) (0.018) (Total Assets/TD)*Prod. 0.004 (0.004) (Total Assets / TD)(t-1) 0.046a 0.008 (0.012) (0.022) (Total Assets/TD)(t-1)*Prod.(t-1) 0.008c (0.004) CF / Total Assets 0.074a 0.069b (0.017) (0.032) (CF / Total Assets )*Prod. 0.001
(0.007)
(CF / Total Assets )(t-1) 0.052b -0.031
(0.021) (0.040) (CF / Total Assets )(t-1)*Prod.(t-1) 0.022b
(0.009)
TA / Total Assets 0.949a 0.254
(0.168) (0.268) (TA / Total Assets)*Prod. 0.237a
(0.085)
(TA / Total Assets)(t-1) 0.957a 0.393
(0.200) (0.305) (TA / Total Assets)(t-1)*Prod.(t-1) 0.231b
(0.105) No. Obs. 9083 9083 6436 6436 7759 7759 5814 5820 9138 9138 5976 6808 Estimation Probit Probit Probit
Fisher statistic 14.26 12.43 10.94 11.03 1.23 1.53 p-value 0.002 0.014 0.012 0.023 0.75 0.82
R-Squared 0.32 0.32 0.31 0.32 0.30 0.30 0.30 0.30 0.37 0.37 0.37 0.35
Note: Marginal effects computed at means. Prod.: Productivity; TD: Total Debt; TA: Tangible Assets; CF: Cash Flow. low and high means respectively below the first and above the last quartiles of each financial proxy. All estimations include year, country and sector dummies. Robust standard errors into parentheses. Significance levels: c10%, b5%, a1%. Intercept not reported. Froot (1989) correction for firm-level cluster correlation.