HAL Id: hal-00691671
https://hal.archives-ouvertes.fr/hal-00691671
Submitted on 26 Apr 2012HAL is a multi-disciplinary open access archive for the deposit and dissemination of sci-entific research documents, whether they are pub-lished or not. The documents may come from teaching and research institutions in France or
L’archive ouverte pluridisciplinaire HAL, est destinée au dépôt et à la diffusion de documents scientifiques de niveau recherche, publiés ou non, émanant des établissements d’enseignement et de recherche français ou étrangers, des laboratoires
Didier Vray, A. Discher, J. Lefloc’H, W. Mai, Patrick Clarysse, Q. C. Pham,
Johan Montagnat, Marc Janier
To cite this version:
Didier Vray, A. Discher, J. Lefloc’H, W. Mai, Patrick Clarysse, et al.. 3D Quantification of Ultrasound Images: Application to Mouse Embryo Imaging In Vivo. Ultrasonics, Ferroelectrics, and Frequency Control Society (UFFC02), Oct 2002, Munich, Germany. pp.1-10. �hal-00691671�
3D QUANTIFICATION OF ULTRASOUND IMAGES :
APPLICATION TO MOUSE EMBRYO IMAGING IN VIVO
D. Vray1,2, A. Discher1, J. Lefloc’h1,2, W. Mai2, P. Clarysse1, Q.C. Pham1, J. Montagnat1, M. Janier1,2
1
CREATIS, Research Unit associated to CNRS (UMR#5515) and affiliated to INSERM, INSA 502, 69621 Villeurbanne Cedex, France. Email: didier.vray@creatis.insa-lyon.fr
2
ANIMAGE, CERMEP, 59 Bd Pinel, 69003 Lyon, France
Abstract - High frequency ultrasound imaging
has become an effective tool for anatomical mice studies. This work is focused on 3D quantification of mouse embryo development to extract pertinent information of its evolution. A series of B-Scan ultrasound images was acquired at different spatial positions along the embryo. A 3D deformable model was used to segment the images. A pregnant female mouse at embryonic day 14.5 was imaged with an ATL HDI 5000, 7-15MHz linear array. The probe was moved by a step by step motor along the abdomen of the mouse. 3D segmentation results are presented including volume quantification of the embryo.
I. INTRODUCTION
Studies of mouse embryo development are now possible with the development of new ultrasound imaging systems [1-3]. Although 2D ultrasound imaging is a very useful tool for physicians, 3D ultrasound imaging methods have been developed since 30 years [4]. Recent studies show a large number of approaches for the acquisition of the volume of data [5-6]. We have chosen to mount the conventional ultrasound 2-D linear array to an external step-by-step motor. The main advantages are the accurate positioning and the parallel slices obtained from the investigated volume. The paper will present first the acquisition method. In section III, the segmentation method is applied to the data. Results are discussed in section IV.
II.ACQUISITION METHODS
Two series of parallel ultrasound images were acquired using two different scanners. First, series was performed on a gel-based phantom containing
an ellipsoidal inclusion and second on a pregnant female mouse at embryonic day (ED) 14.5.
Data acquisition on a gel-based phantom
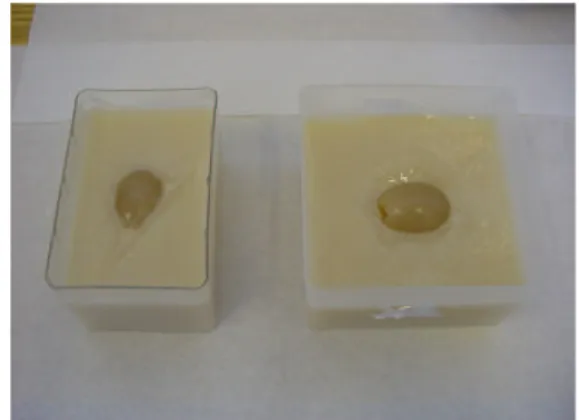
The phantom was made of a mixture of agar (4% by weight) and gelatin (8%). The phantom contains an ellipsoidal inclusion which has an egg shape (fig.1) with the same agar properties. To have different scattering properties, 6% Carborundum particles (Silicon-Carbide), with an average diameter of 15µm, were added into the area of the phantom surrounding the inclusion. The inclusion appears with a lower echogeneicity (fig. 2). The real volume of the inclusion was 10.60cm3. The major axis was 33mm and the minor axis was 26mm.
Figure 1: Agar-gelatin phantom with the inclusions
3D data were acquired as a series of 2D images, incrementing the position of the linear array by steps of 330µm using a step by step motor. 3D data set consisting of 100 B-Scan ultrasound images were acquired on the phantom with a linear array 5.5-8MHz of B&K 3535 ultrasound system. The size of each image was 256x256 pixels corresponding to 59.65mm width and depth. The axial and lateral
resolution were 233µm/pixel. The distance between 2D images was 330µm.
Figure 2: Ultrasound image of the egg shape inclusion phantom.
Data acquisition on a pregnant female mouse
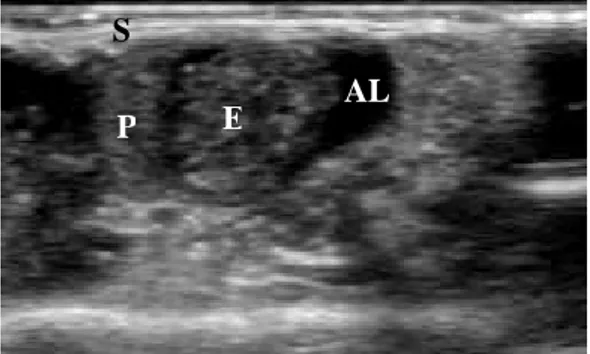
For this experiment, a pregnant mouse (OF1, IFFA CREDO, L’Arbresles, France) at ED 14.5 was imaged with a 7-15MHz linear array (CL 15-7). Before scanning the embryo, the mouse was anesthetized using a dedicated system for small animal anesthesia (Minerve, Esternay, France) and then gently shaved with a hair remover (Veet ND, Reckitt Benckiser, France). The probe was mounted on a bench allowing an horizontal displacement over the mouse abdomen. A gel (Acquasonic 100, Parker lab., Orange, USA) was used as a coupling medium between the mouse abdomen and the linear array. Special care was taken to have, at least the whole body of one embryo when acquiring data. A total of 536 B-Scan ultrasound images were recorded on the scanner (ATL HDI 5000, Philips, France). One focal zone was selected and fixed at 5mm. The size of each image was 160x256 pixels. The axial and lateral resolution were 100µm/pixel and 90µm/pixel respectively. The distance between 2D images was 25µm. Each recorded image was then 2.56cm width and 1.4cm height. The HDIlab software was used to read the images and to save them in raw format to perform the segmentation. Figure 4 presents a B-Scan image of the selected embryo.
Figure 3: Shaved and anesthetized mouse on a thermoregulated table.
E
S
AL P
Figure 4: Transabdominal image of the embryo with a 7-15MHz linear probe. E : Embryo, AL : Amniotic Liquid, P : Placenta, S : Mouse skin (and image artefacts).
III. 3D SEGMENTATION METHOD
An elastic deformable template for 3D automatic image segmentation of the heart has been developed in our laboratory [6]. This flexible model has been adapted to segment the mouse embryo. The elastic deformable template is a combination of :
- a topological and geometric model of the object to be segmented. In this context, this a priori model is a 3D ellipsoid (Fig. 5)
- a constitutive equation (linear elasticity) defining its dynamical behavior under applied external image forces that push the model's interfaces towards the image edges.
The equilibrium of the model is obtained through the minimization of the following global energy functional:
data elastic E
E
where Eelastic represents the deformation energy of the model and Edata is the energy due to the external image forces.
Figure5 : Initial template, a 3D ellipsoid Internal Energy term
The ellipsoid is considered as a linear elastic body. Its elastic energy can be expressed as [7]:
Ω =
∫
Ω d Eelastic σ tε 2 1 (2)Where σ, ε are the 3D strain and deformation vectors, respectively. Moreover, the material is considered as isotropic and is completely defined by the Young modulus Y and the Poisson coefficient ν (or the Lamé coefficients λ and µ). Then, with the small displacement assumption,
( )
=∫
Ω Ω u)d ( u) ( u E S T S D 2 1 elastic (3)where 6 is a differential operator, D(λ,µ) the elasticity matrix and u the displacement vector.
External Image Energy
The object is submitted to a boundary force field
t. The expression of the external energy Edata is :
( )
=
−
∫
Γ
Γd
u
u
E
datat
.
(4)with Γ the border of the object domain Ω. The force field is either derived from the gradient of a potential function P (t =−grad
( )
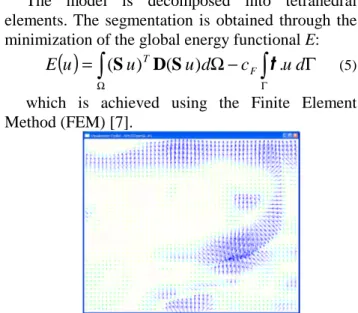
P ) computed from an edge map, or a specific force field called gradient vector flow (GVF) [8] which is sometimes more efficient regarding the initialization and the convergence to edges (Fig 6).Global energy minimization
The model is decomposed into tetrahedral elements. The segmentation is obtained through the minimization of the global energy functional E:
( )
∫
∫
Γ ΩΓ
−
Ω
=
u
u
d
c
u
d
u
E
(
S
)
TD
(
S
)
Ft
.
(5) which is achieved using the Finite Element Method (FEM) [7].Figure 6 :2D projection onto an image plane of the force field (GVF algorithm) acting onto the template
Template initialization
The segmentation procedure requires a rough positioning of the initial ellipsoid into the data. This was manually performed.
IV. EXPERIMENTAL RESULTS
3D data acquired on the egg shape phantom were segmented by the algorithm. The measurements made on the model were 32.1mm for major axis, and 27.5mm for minor axis. The volume measured on the model was 11.30cm3. These values were compared to direct measurements of the egg shape phantom presented in section II. They showed good agreement with the real sizes of the egg and the volume occupied effectively by the egg since an accuracy better than 10% was found with the automatic segmentation of the 3D images. Accuracy is 1.1% in the acquisition plane.
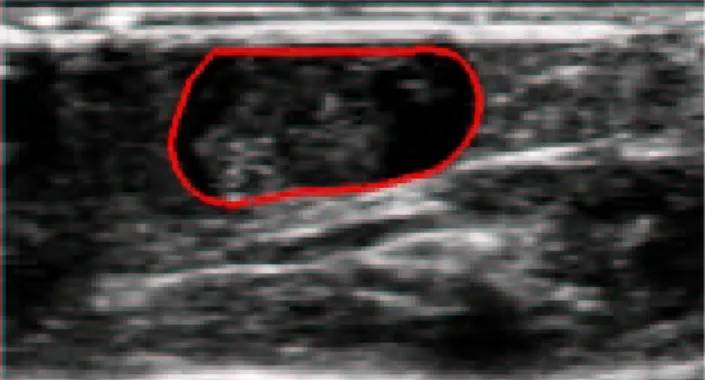
The segmentation obtained for the 3D data of the pregnant mouse in vivo are presented in figure 7, 8 and 9. The 3D model (Fig 9) was adjusted for the segmentation. It included the embryo, the amniotic liquid but not the placenta (see Fig 4).
Figure 7 : Segmentation results obtained for a transversal cut of the embryo.
Figure 8 : Segmentation results obtained for a longitudinal cut of the embryo.
Figure 9 : 3D model after convergence.
Sizes of the embryo estimated from the segmentation process were : 11.5mm for the major axis, 6mm for the minor axis and the volume was
estimated to be 0.48cm3. These preliminary results were obtained fully automatically after convergence of the model and seemed to be in agreement with data performed using an histological approach (M.H. Kaufman, “the atlas of mouse development”, Academic Press, New York, p512, 1992).
Next step of this work will include the evaluation of growth of embryo by acquiring a set of 3D data at each day of the embryo development.
REFERENCES
[1] O. Arizabal, A. Christopher, S. Foster, D. Turnbull, “ 40MHz echocardiography scanner for cardiovascular assessment of mouse embryos”, Ultrasound. Med. Biol., 1998, 24(9), pp1407-1417.
[2] D. Turnbull, T. Bloomfield, H. Baldwin, S. Foster, A. Joyner, “Ultrasound backscatter microscope analysis of early mouse embryonic developement”, Proc. Natl. Acad. Sci. USA, 1995, vol.92, pp.2239-2243.
[3] F.S. Foster, G. Liu, J. Mehi, B. Starkoski, L. Adamson, Y. Zhou, K. Harasiecwicz, L.Zan, “ High Frequency Ultrasound Imaging: from man to mouse“, In Proc. of IEEE Ultrasonics
Symposium, 2000, pp. 1633-1638
[4] J. Szilard, “An improved three-dimensional display system”, Ultrasonics, 1974, 12(6), pp273-276.
[5] T. Nelson, D. Pretotius, “3-D ultrasound imaging”, Ultrasound. Med. Biol., 1998, 24(9), pp1243-1270.
[6] Q.C. Pham, F. Vincent, P. Clarysse, P. Croisille, I.E. Magnin, A FEM-Based Deformable Model for the 3D Segmentation and Tracking of the Heart in Cardiac MRI, in Image and Signal Processing and Analysis (ISPA 2001), Pula, Croatia, 2001, pp. 250-254.
[7] Zienkiewicz, O.C. and Taylor, R.L. The Finite
Element Method, (ed.), McGraw Hill Book Co.,
1987.
[8] Xu, C. and Prince , J.L. Snakes, shapes, and gradient vector flow. IEEE Trans. Image