HAL Id: hal-01281684
https://hal.sorbonne-universite.fr/hal-01281684
Submitted on 3 Feb 2017
HAL is a multi-disciplinary open access archive for the deposit and dissemination of sci-entific research documents, whether they are pub-lished or not. The documents may come from teaching and research institutions in France or abroad, or from public or private research centers.
L’archive ouverte pluridisciplinaire HAL, est destinée au dépôt et à la diffusion de documents scientifiques de niveau recherche, publiés ou non, émanant des établissements d’enseignement et de recherche français ou étrangers, des laboratoires publics ou privés.
Structure of Bolaamphiphile Sophorolipid Micelles
Characterized with SAXS, SANS, and MD Simulations
Sabine Manet, Anne-Sophie Cuvier, Claire Valotteau, Giulia C. Fadda, Javier
Perez, Esra Karakas, Stéphane Abel, Niki Baccile
To cite this version:
Sabine Manet, Anne-Sophie Cuvier, Claire Valotteau, Giulia C. Fadda, Javier Perez, et al.. Struc-ture of Bolaamphiphile Sophorolipid Micelles Characterized with SAXS, SANS, and MD Simula-tions. Journal of Physical Chemistry B, American Chemical Society, 2015, 119 (41), pp.13113-13133. �10.1021/acs.jpcb.5b05374�. �hal-01281684�
IMPORTANT NOTE : Please be aware that slight modifications occurring after Proof correction may occur between this version of the manuscript and the version on the Publisher’s website---
Structure of Bolaamphiphile Sophorolipid Micelles Characterized
with SAXS, SANS and MD Simulations
Sabine Manet,1 Anne-Sophie Cuvier,1 Claire Valotteau,1 Giulia C. Fadda,2 Javier Perez,3
Esra Karakas,4,5 Stéphane Abel,5 and Niki Baccile1*
[1] Sorbonne Universités, UPMC Univ Paris 06, CNRS, Collège de France, UMR 7574, Chimie de la Matière Condensée de Paris, F-75005, Paris, France.
[2] Laboratoire Léon Brillouin, LLB, CEA Saclay, F-91191 Gif-sur-Yvette Cedex, France [3] SWING, Synchrotron Soleil, BP 48, F-91192 Gif-sur-Yvette
[4] Maison de la Simulation, USR 3441, CEA – CNRS – INRIA – Univ. Paris-Sud – Univ. de Versailles, 91191, Gif-sur-Yvette Cedex, France
[5] Institute for Integrative Biology of the Cell (I2BC), Commissariat à l’Energie Atomique et aux Energies Alternatives (CEA), Centre National de la Recherche Scientifique (CNRS), Université Paris-Sud, CEA-Saclay, F-91191 Gif-sur-Yvette, France
* Corresponding author : Laboratoire de Chimie de la Matière Condensée de Paris, Collège de France, 11, Place M. Berthelot, F-75005, Paris, France. Tel. +33 1 44 27 15 44 ; Email : niki.baccile@upmc.fr
Abstract
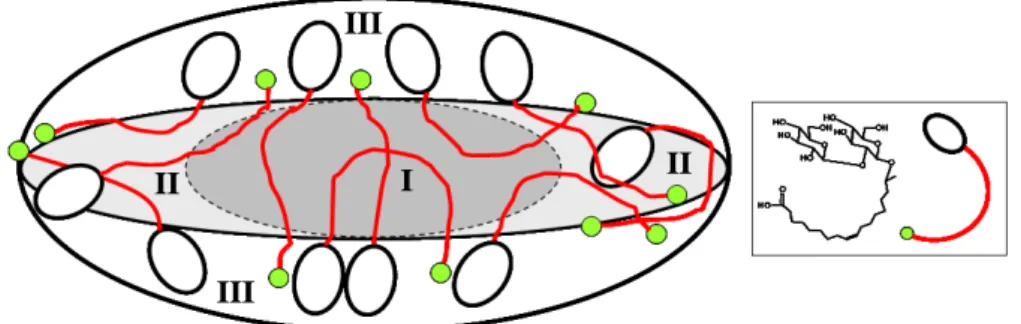
The micellar structure of sophorolipids, a glycolipid bolaamphiphile, is analyzed using a combination of Small Angle X-ray Scattering (SAXS), Small Angle Neutron Scattering (SANS) and Molecular Dynamics (MD) simulations. Numerical modeling of SAXS curves shows that micellar morphology in the non-charged system (pH< 5) is made of prolate ellipsoids of revolution with core-shell morphology. Opposed to most surfactant systems, the hydrophilic shell has a non-homogeneous distribution of matter: the shell thickness in the axial direction of the ellipsoid is found to be practically zero, while it measures about 12 Å at its cross-section, thus forming a “coffee bean” like shape. The use of contrast matching SANS experiment shows that the hydrophobic component of sophorolipids is actually distributed in
a narrow spheroidal region in the micellar core. These data seem to indicate a complex distribution of sophorolipids within the micelle, divided into at least three domains: a pure hydrophobic core, a hydrophilic shell and a region of less defined composition in the axial direction of the ellipsoid. To account for these results, we make the hypothesis that sophorolipid molecules acquire various configurations within the micelle including bent and linear, crossing the micellar core. These results are confirmed by MD simulations which do show the presence of multiple sophorolipid configurations when passing from spherical to ellipsoidal aggregates. Finally, we also used Rb+ and Sr2+ counterions in combination with Anomalous SAXS experiments to probe the distribution of the COO- group of sophorolipids upon small pH increase (5 < pH < 7), where repulsive intermicellar interactions become important. The poor ASAXS signal shows that the COO- groups are rather diffused in the broad hydrophilic shell rather than at the outer micellar/water interface.
Keywords
Self-assembly; Biosurfactants; Glycolipid; Starmerella bombicola; ASAXS; Bolaform
Introduction
Surfactants are compounds employed in a very large panel of applications in which amphipathic interfaces are made compatible. The formation of micelles above a critical micellar concentration is one of the most common aspects among amphiphilic molecules in water and a thorough description of their structure is one of the first steps when studying the properties of new compounds.1 If the aggregation of classical cationic (e.g., alkylammonium
salts),2- 4 anionic (e.g., alkylsulfates salts) or non-ionic (e.g., block copolymers)5 surfactants
into micelles has been studied, both experimentally and theoretically, for decades, less conventional compounds are much less looked at. Among these, bolaform lipids6 constitute a
class of interesting molecules with two functional end-groups. If the end-groups are chemically equivalent, one speaks of symmetric bolaamphiphiles (bolas), otherwise one refers to asymmetric bolas. The atypical distribution of amphiphilic and lypophilic regions within the same molecule is often responsible of interesting aggregation phenomena which lead to the formation of micelles, bicelles,7 vesicles,8 cones,9 fibers,10 tubes,11,12 etc... Many significant systems have been reviewed in 2004 by Fuhrhop,6 while Fariya et al.13 have recently reviewed bolaamphiphiles in the context of pharmaceutical applications. If a large amount of work has been dedicated to the synthesis and characterization of bola systems,
composed of bolaamphiphiles,8,10,14- 20 advanced structural considerations of the micellar
packing and bola distribution are rare.19.20 Indeed, Nagarajan21 predicted since 1987 the
formation and structure of micelles composed of bolaamphiphiles basing his hypotheses on the analysis of the packing parameter. Interestingly, he predicted the formation of spherical, cylindrical and discoidal micelles, in which he imagined that the bolaform compound has various configurations: elongated, which induces transradial crossing of the end-groups; folded, under which the end-groups lie both on the same side. If Yan et al.14 have proceeded with macroscopical verification of Nagarajan’s assumptions by observing a pH/cosolvent-driven tube-to-vesicle-to-micelle transition in disodium phenyl-1,4-bis(oxyhexanoate) solutions, the actual bola distribution within the micelle was never elucidated. Additional insights in the structural composition of bola-composed micelles have been discussed in Ref. 7,14-20 mainly using Small Angle Neutron Scattering (SANS) and/or self-diffusion Nuclear Magnetic Resonance (NMR) experiments. However, in practically all cases, these experiments have been used to describe the micellar shape and size. Only few authors, with little consensus in their conclusions, have tried to determine the molecular distribution of the bolaamphiphile within the micellar aggregate. Caponetti et al.16, for instance, have used advanced modelling analyses of SANS spectra to study the bola N-aza-18-crown-6 ether compound. If Davey et al.19 and Shinde et al.20 agree on the fact that their respectively studied asymmetric bolaamphiphiles, alcohol derivatives of alkylammonium and oleate salts, form uniform spherical/cylindrical micelles in which both polar groups are in contact with the solvent (water), they do not agree on the molecular arrangements. Davey proposes an elongated cross-micellar conformation, while Shinde proposes a bent configuration. Interestingly, these recent studies disagree with older works in which it was proposed that only one of the two polar groups is actually located at the micellar/solvent palisade.22,23
Such a lack of deep characterization of bola-micelles, and disagreement on their structure and molecular conformation, is quite odd because of the importance in terms of applications for many bola systems. In fact, the chemical nature of end-groups in bolas can be as wide as imagination can allow: polymerizable,24 complexing,16,25 pH-responsive,11,14 fullerenic,26 chiral,27 glycosidic,18 functions are just some examples of the broad variety that one can find in the literature. The range of applications of bolas in general goes from one-pot porous material synthesis24 to supramolecular materials with temperature-driven ferroelectric-paraelectric transitions,25 ion-channel supramolecular membranes,28 metallo-hydrogels for dye adsorption and water purifier,16,29 viscoelastic fluids,30 biomedical carriers13 and much more. For this reason, it is of paramount importance to characterize the spatial distribution
and accessibility of end-functions within the supramolecular aggregates and, in particular, within micelles. Laying one of the end-groups within the interior of the micellar aggregate can be of relevance for drug-delivery systems and conception of nanoreactors. Whether charged end-groups concentrate at the micellar surface or not can be of relevance in nanomaterial synthesis procedure in which charge matching drives the material formation, such as mesostructured oxides or layer-by-layer approaches, but it can also have drastic relevance in gelling properties, for instance. The distribution and accessibility of biologically-relevant moieties like peptides or carbohydrates is important for biomedical applications like gene-antigene recognition for cancer treatment. Even in the system studied by Caponetti,16 in which authors looked at metal-binding affinity of the crown ether end-groups, it is necessary to know the distribution of the crown ether groups and their accessibility in view of metal ion removal in solution.
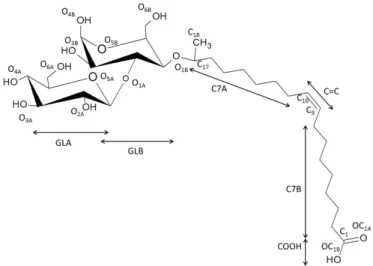
For these reasons, in the present work, we try to set up a combination of complementary analytical approaches based on advanced small angle scattering techniques in order to prove both indirectly (by way of model functions) and directly the spatial distribution of a glycolipid asymmetric bolaamphiphile. We study here the micellar structure of sophorolipids, a yeast-derived bolaform glycolipid composed of sophorose (glucose β(1,2)) attached to the C17 atom of oleic acid via an ether bond, the carboxylic group being free of access at the opposite side of the molecule (Figure 1).31 This compound is part of the glycolipid family and the presence of sophorose-COOH end-groups make it, de facto, a bolaform compound with pH-responsive properties,32 which confer to it a double neutral/anionic or neutral/neutral nature.33 Recent works on the self-assembly of the acidic
open chain form of sophorolipids have shown its ability to form assemblies such as fibers34,35
and micelles.32,36 In the latter case, our group has shown that the micellar charge can be adjusted using pH.33 However, no information on the charge distribution could be obtained.
Considering the fact that this compound is easily accessible and considering its importance in various fields like detergency,37 cosmetics,38 nanoscience,39 disinfection,40 medicine,41 it becomes a valuable candidate to use for a detailed study of the sophorose/COOH end-groups distribution within the micelle. To do so, we combine several small-angle scattering techniques: Small Angle X-ray Scattering (SAXS) is used to precisely define the micellar morphology and its size; Anomalous-SAXS (ASAXS), a technique that probes the distribution of counterions around a charged macroion, is employed to follow the distribution of the carboxilate end-group in the presence of specific ASAXS probe counterions, Rb+ and
distribution of the hydrophobic fraction of the molecule. This approach shows that, in the mild acidic pH region (pH< 5), the micelle is likely to be described as an ellipsoid of revolution having a “coffee bean” like morphology. In this structure, the hydrophobic region only occupies a small inner spheroidal core. The outer shell in the central region of the ellipsoid is mainly made of sophorose and COOH groups. The electron density distribution in the axial direction is more difficult to define and it probably reflects a more complex distribution of matter. We identify at least two different configurations of the sophorolipid molecules: bent and elongated, with possibility of crossing the ellipsoid section. We also show that these hypotheses, based on experimental work, are confirmed by Molecular Dynamics (MD) simulations specifically performed in this work. Upon formation of COO -groups in the neutral pH range (5 < pH < 7), micelles become negatively charged: ASAXS experiments seem to indicate that the carboxylates are rather diffused in the broad hydrophilic shell rather than localized at the micelle/solvent palisade. To the best of our knowledge, such a complex analysis has never been carried neither on glycolipid-based nor on any other bolaamphiphile compound.
Experimental
Acidic sophorolipids (SL) have been prepared from a commercial batch of a sophorolipid mixture (Sopholiance, Soliance, France; sophorolipids are derived from rapeseed oil, batch number: 11103A, dry content: 60 ± 6 %) using alkaline hydrolysis to convert the lactonic/acidic mixture into a fully acidic sophorolipid compound. Extraction and purification have been performed using the method N°2 described in ref. 42, to which one should refer for a typical 1H solution NMR spectrum of the compound used. As a general observation on
purity, one should note that our compound has a very low content of residual fatty acids (typically less than 5 mol% by 1H NMR). Nevertheless, biobased glycolipids in general are
known to contain residual congeners. In the case of sophorolipids, mainly composed of a C18:1 fatty acid tail attached to sophorose, congeners generally represent a low fraction of the actual compound, generally being C16 and/or C18:2 fatty acids variations. A typical HPLC chromatogram was reported in ref. 43, showing that C18:1 does constitute the large majority of our sample (> 90 %), thus being in agreement with the 1H NMR data. Congeners are also detected but in the present work we make the hypothesis that, given the low amount, their influence on the self-assembly of C18:1 sophorolipid is negligible.
Sophorolipid solutions are generally prepared by simply dispersing the compound in water (50 mg/mL ≡ 80 mM). If needed, a slightly warm (30-35°C) ultrasonic bath is used for few
seconds to help solubilize the sample. After solubilization, the solutions are clear and stable over time. Specific sample preparation is detailed in each sub-section below. MilliQ quality water was used for the experiments and all solutions are freshly prepared. RbCl, SrCl2, RbOH
and Sr(OH)2 have been purchased at Sigma-Aldrich.
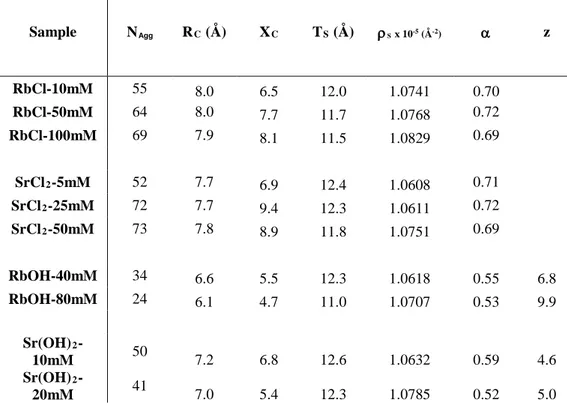
Small Angle X-ray Scattering (SAXS). The sample composition is presented in Table 1 and for all of them the concentration of SL is 50 mg/mL. Rb+ and Sr2+ have been used instead of the more classical Na+ and Ca2+ ions due to their activity in the ASAXS experiments, presented later. Each sample is prepared by mixing the salt in water; this solution is eventually split in half, one half is used for background acquisition and the indicated amounts of SL are introduced in the second half.
Table 1 – List of samples studied in this work. Sophorolipid concentration is constant (80 mM) for all samples Sample Compound [Sr2+] mM [Rb+] mM 1 RbCl - 10 2 RbCl - 50 3 RbCl - 100 4 RbOH - 40 5 RbOH - 80 6 SrCl2 5 - 7 SrCl2 25 - 8 SrCl2 50 - 9 Sr(OH)2 10 - 10 Sr(OH)2 20 -
These experiments have been done at the SWING beamline of the SOLEIL synchrotron at Saint-Aubin (France). Sample-to-detector distance was set to 2526 mm and energy of the X-ray beam was E= 14.6 keV. The experimental environment was provided at the beamline and consisted of a flow-through quartz capillary which it was possible to fill using a syringe. The X-ray beamline hits the same capillary position, which does not change between background and sample acquisitions, thus making the background subtraction highly accurate. For the background, we used the same solution used to prepare a given sophorolipid sample, as also mentioned above. Absolute scaling was calibrated on the signal of water. All data have been divided by the sample transmitted intensity. Data treatment (mask generation, integration) was done using the Foxtrot software provided at the beamline.
The analysis of the SAXS profiles for the determination of micelle size and shape parameters has been made with the models displayed by default in the SASview software, provided free of charge on the developer’s website.44 The general equation treating the scattered intensity
versus the momentum transfer q is (Eq. 1)
(
ρ ρ)
P(q)S(q) bkg s I(q)= − solv 2 + V cale Eq. 1 where, scale is the volume fraction, V is the volume of the scatterer, ρ is the scattering length density (SLD) of the object, ρsolv is the SLD of the solvent, P(q) is the form factor of the object, S(q) is the structure factor and bkg is a constant accounting for the background level.Form factor
The analytical expressions of the P(q) discussed below are directly implemented in the SASview software and their analytical form is provided in Ref. 45. The χ2 test is employed to characterize the quality of the fit, the lower value indicating the best fit. χ2 is defined as the Pearson's cumulative test statistic,
∑
= − =Npts 1 i i 2 i i 2 E ) E (O
χ , where Oi is an observed measured
value; Ei is an expected (theoretical) value, asserted by the null hypothesis. The χ2 is then normalized by the number of points in the distribution, χ2/Npts. Some fit parameters can be simply estimated from the sample composition and have been fixed for the fitting process. Among them, the volume fraction of scattering objects has been set at 0.05, reflecting the SL mass concentration of 50 mg/mL (80 mM) used for all samples.
The core and solvent SLD’s have been fixed and calculated using Eq. 2:
M j i e i V r Z = ρ
∑
Eq. 2where Zi is the atomic number of the ith of j atoms in a molecule of molecular volume VM and
re is the classical electron radius or Thomson scattering length (2.8179 x 10⁻¹⁵ m). Sophorolipids are mainly composed of a C18 aliphatic chain with one unsaturated C=C bond (position C9,10), one COOH group (position C1), the CH in position C17 covalently bonded to
sophorose and a CH3 in position C18 (Figure 1). Considering the fact that C17 and C18 atoms
are located at the sophorose/aliphatic frontier, it is a difficult choice to decide which is their exact location. For this reason, we simplify our model and make the assumption that the hydrophobic core starts at the C16 carbon, neglecting the contribution of the C17 and C18
chain to be 13 mic 2, CH V + 2VCH, where mic 2, CH
V is the volume of one CH2 group inside a
micelle, 27.5Å3, and VCH is the volume of a CH group, 22.0Å3.46 These estimations provide a SLD core value, constant for all fitting procedures in this study, of 8.3 x 10⁻⁶ Å-2 (294 e-/nm3). The solvent SLD has been calculated taking into account the salt or base concentration influencing the molecular volume.47 The resulting SLD values are very close and lie between 9.4 and 9.5 x 10⁻⁶ Å-2, (334 and 337 e-/nm3, see full list in Table S1 in the Supporting Information). For core-shell models, the shell SLD is always a variable parameter. We make the hypothesis that the shell is most likely composed of hydrated sophorose; in this case, the shell SLD value should lie between the solvent and hydrated sophorose SLD values, roughly between 1.0 and 1.2 x 10⁻⁵ Å-2, (355 to 425 e-/nm3). As a result, the electron density profile from the center of the micelle to the solvent can be drawn as a hat-like shape, in which the shell SLD is the highest value. The choice of the form factor has been determined by comparing the best fits on the basis of the lowest χ2/Npts among different model functions, as critically discussed on Page S2 in the Supporting Information and shown in Figure S1. We find that a core-shell prolate ellipsoid of revolution, schematized in Figure 2, best describes our SAXS data.
Structure Factor
The structure factor, S(q), which quantifies the intermicellar interactions/correlations, is included in our fitting process using the “Hayter-MSA-Structure” model displayed in the SASview software. This accounts for a repulsive screened Coulombic intermicellar interaction potential,48,49 as previously used on similar systems.33 S(q) has only been used for samples containing RbOH (samples 4,5) and Sr(OH)2 (samples 9,10) according to the
previously discussed assumption that deprotonation of the COOH introduces negative charges at the micellar/solvent palisade,33 thus being responsible of the broad interaction peak observed in small angle neutron scattering spectra, and reproduced in this work. S(q) has been set equal to 1 for base-free samples only containing salts (samples 1-3 and samples 6-8 in Table 1). Six parameters are needed to compute the Hayter and Penfold structure factor: the dielectric constant, the volume fraction, the effective radius of interacting objects, the temperature, the surface charge of the micelle, and the salt concentration, used to calculate the ionic strength of the solution, which in turn is used to compute the Debye screening length. As this model is made for monovalent ions, we modified the salt concentration parameter of the samples, otherwise fixed and equal to the experimental concentration, with divalent ions
so that the resulting Debye length is correct. The volume fraction of the scatterers is calculated from Vmic and nmic (η=Vmicnmic ), defined more precisely later on in this same
section, and inserted in the Hayter-MSA-Structure routine with RE, effective radius of
interacting objects ( 1/3 mic E πn 6η 2 1 = R
, see Ref. 48) as fixed parameters. The temperature, dielectric constant and salt concentration are also fixed parameters so that the micelle charge is the only refinable parameter for the calculation of S(q).
Fit strategy using a core shell prolate ellipsoid of revolution model and a Hayter-MSA structure factor
In order to reduce the number of parameters used for the fitting process, we used a customized version of the core-shell prolate ellipsoid form factor proposed in the 3.0.0 version of SASview. In particular, we introduce some molecular constraints inspired by the work of Hayter and Penfold.4 By making some assumptions described thereafter, only 5 fitting parameters are needed: Nagg (aggregation number), RC (equatorial core radius, see Figure 2), ρS (scattering length density of the shell, see Figure 2), XC (axial core ratio, see Figure 2) and z, the surface charge of the micelle. A small background correction (<0.005 cm -1) has also been applied. In the Hayter and Penfold model, if N
agg is greater than the one expected to accommodate a sphere, the radius of which is Rc= lc (length of the fully extended hydrocarbon chain of the surfactant), then the object is allowed to become elliptical so to accommodate the molecular excess. This model has been adapted to the sophorolipid surfactants as follows. For a given Nagg, the spherical hard core micelle radius Rhc is defined as:
(
)
1/3 CH mic 2, CH agg hc 4π 2V + 13V 3N = R Eq. 3If Rhc> lc, RC is set to lc, and a parameter α is introduced, defined as the fraction of CH2
inserted in the dry core of the micelle :
mic 2, CH agg CH C 13V N 2V V = α − Eq. 4 with C πRC3 3 4 = V . If Rhc<lc, RC is set to Rhc and α= 1.
Sophorolipids are bolaform amphiphiles with two different polar heads (carboxylic acid and sophorose sugar moiety) connected to a 18:1 carbons lipid chain (Figure 1), which reduces to a C16:1 chain if one makes the hypothesis that C17 (CH) and C18 (CH3) do not
contribute to lc, which in this case can be estimated to be around 10 Å, half the length of the 16 carbons chain. We first try to use this value of lc as Rtest, but the results obtained were not reliable, leading to high χ2/Npts values, so we let this constraint to relax, and R
C and XC have been set as refinable parameters. Recently, Penfold et al.36 have made the same choice when analyzing the SANS profiles of sophorolipid micelles, arguing that the particular alkyl chain geometry of the sophorolipid introduces some uncertainty into what value the inner radius should be constrained to.
Once α is known, the number of water molecules per sophorolipid in the shell, nw/SL, and consequently the composition of the shell, can be calculated using the shell scattering length densityρ as a refinable parameter, assuming that the shell hydration should not be a S
fixed parameter, because it depends on many effects like the number of hydrated CH2 or the
micelle surface charge. From Eq. 5 we calculate the molar volume, Vm,hg, and hence the SLD,
ρhg, of the total dry headgroup. Composition of the dry headgroup is not easy to estimate; it certainly includes sophorose, as stated earlier, and most likely the COOH group, but it can also include the C17 (CH) and C18 (CH3) atoms, previously excluded from the core region of
the micelle, as well as the fraction of the CH2 aliphatic chain excluded by the α parameter
presented in Eq. 4. This is not surprising as hydration of the CH2 groups close to the
hydrophilic head was reported before both experimentally50,51 and predicted theoretically using MD simulation52. In all cases, the ionic species coming from the added salts or bases are neglected. The general expressions for the headgroup volume and SLD are then:
(
)
w 2, CH i i hg m, = V +131 αV V∑
− Eq. 5(
)
hg m, w 2, CH CH i i i hg V V α 1 13 + V ρ = ρ 2,w ρ −∑
Eq. 6where i denotes the sophorose, carboxylate and the aliphatic moieties, CH, CH3 and possibly
CH2 groups.
w 2, CH
V is the molar volume of hydrated CH2 smaller than
mic 2, CH V , taken as 26.7Å3,53 while w 2, CH
shell xv,w and the number of water molecules per sophorolipid in the shell nw/SL are obtained by considering the fraction of water molecules (nw/SL) needed to equalize the calculated ρhg (Eq. 6) and the experimental ρshell (obtained from the fit). This is summarized in Eq. 7 and Eq. 8: hg w hg shell w v, ρ ρ ρ ρ = x − − Eq. 7
(
v,w)
m,w hg m, w v, SL w V x 1 V x = n − / Eq. 8with Vm,w the molar volume of water (29.9 Å3) and ρw the water SLD taken as 9.4 x 10⁻⁶ Å-2. As it did not seem straightforward to evaluate the ionic composition and concentration within the shell, the presence of ions coming from added salts, acid or base has been neglected. However, the same fitting process applied using ρsolv instead of ρw in Eq. 7 did not show a deep impact of the ionic composition of the shell on the results (results not shown).
The total micelle volume Vmic is then calculated as the sum of all the components in the core and in the shell:
(
CH ,mic CH m,hg w SL m,w)
agg
mic=N 13αV +2V +V +n V
V
2 / Eq. 9
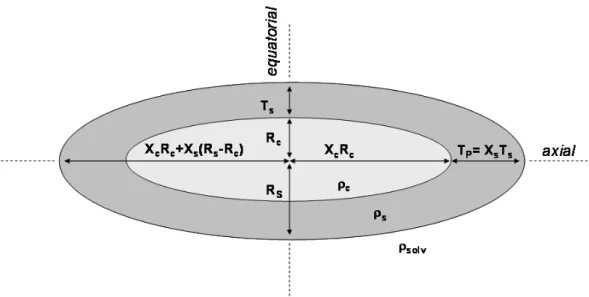
As Vmic can also be defined as the volume of an ellipsoid described by the equatorial core radius Rc, the axial core ratio XC, the axial shell ratio XS (see Figure 2) and the equatorial shell radius RS [ mic πRS2
(
RCXC+(
RS RC)
XS)
3 4 =
V − , see Figure 2], the latter geometric
parameter can then be obtained as the real root of this polynomial equation:
(
)
=0 π 4 V 3 R X X R + R X 2 mic S S C C 3 S S − − Eq. 10The core-shell prolate ellipsoid form factor is finally calculated by:
( )
q =n|
F( )
q,μ|
dμ+background P 1 0 2 mic∫
( )
(
)
( )
(
)
( )
− − S S 1 solv S mic C C S C C x x 3j ρ ρ V + x x 3j1 ρ ρ V = μ q, F Eq. 11( )
2 1 x xcosx sinx = x j − Eq. 12( )
(
2(
2)
)
C 2 2 C 2 C C q,µ =q R X µ +R 1 µ x − Eq. 13( )
(
2(
2)
)
S 2 2 C 2 S S q,µ =q R X µ +R 1 µ x − Eq. 14The intensity scattered by interacting micelles defined as I
( )
q =nmicP( ) ( )
q S q can be calculated by relating the micelle density nmic to the known sophorolipid surfactant concentration [SL] (80 mM) and the refinable aggregation parameter Nagg, with Na being the Avogadro’s number:[ ]
agg a mic N N SL = n Eq. 15Anomalous Small Angle X-ray Scattering (ASAXS).
Elements of theory. Extraction of the counterion scattering contribution around sophorolipid micelles was done via recording the anomalous scattering contribution of rubidium and strontium cations. The anomalous effect is measured when the energy of the X-ray beam approaches the absorption edge of a given element. In this case, the scattering factor becomes a complex function and it is no more a constant. The contribution of the scattering factor far from the absorption edge is
ion m 0 ion f ρ V
f = − Eq. 16
where f0 equals the atomic number of the element, ρm is the electron density of water and Vion is the volume of the counterion. Upon approaching of the edge, fion becomes
( )E if''( )E f'
V ρ f
fion= 0 − m ion+ + Eq. 17
where f′(E) and f′′(E) are, respectively, the real and imaginary part of the energy-dependent scattering vector. Values for f′(E) and f′′(E) are tabulated,54,55 but they can also be calculated from the experimental absorption spectrum.56 When approaching the absorption edge by tuning the synchrotron incident beam energy, fion is neither constant nor negligible anymore
and the scattered intensity must take that into account. The resulting general expression for the scattering intensity then becomes
( )
q,E F( )
q 2f'( ) ( ) ( )
E F q v q[
f'( )
E f''( )
E]
v( )
qI 0 2 2 2
2 0
0 = + + + Eq. 18
where F02(q) is the nonresonant intensity of the macroion (= micelle, polymer, etc...) measured far from the absorption edge; F0(q) and v(q) are the nonresonant and resonant amplitudes respectively of the macroion and the counterion; v2(q) is the pure resonant curve of the counterion measured at the absorption edge. A constant term due to fluorescence, affecting the intensity above the absorption edge, has been omitted. For a more extended discussion on the SAXS theory near the absorption edge of a given element, one can refer to references 57-59. From Eq. 18, one is generally interested into extracting the pure resonant curve v2(q), which gives the scattering profile of the counterion alone. Since I0(q,E) contains three independent variables, one cannot extract directly v2(q). Two complementary methods are proposed in the literature to operate in such a way. In all cases, one must record the I0(q,E) at various values of the incident beam energy, far and close to the absorption edge. The classical SAXS experiment described in the previous section must then be repeated by changing the value of E. The first method, called the “matrix” method, consists of a numerical solution of I0(q,E) needing at least three different energy values.60 The second approach, called the “fit” (or “Ballauf”) method,61 consists of neglecting the f′′(E) term before the absorption edge and performing a quadratic interpolation of I0(E) for each value of the scattering vector. For a detailed discussion on the problem of solving I0(q,E), one can refer to Ref. 60- 63. The experimental approach and data treatment used to treat our ASAXS experiments is detailed on Page S6 in the Supporting Information.
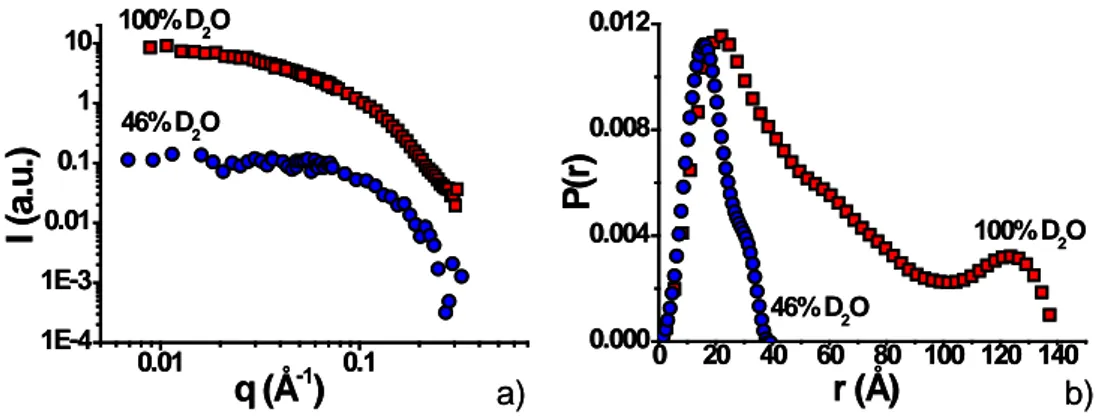
Contrast matching Small Angle Neutron Scattering (SANS). These experiments have been performed to look at the contribution of the micellar core only, thus matching the scattering of the sophorose headgroup (molecular formula: C12H21O11, molar mass: 341.30 g/mol) in the
simple ion-free sophorolipid micellar system at 80 mM. For the SLD calculations, we used the bulk sophorose density (1.68 g/mL)64 and we considered the fact that labile COH groups could be exchange into COD. The estimated SLD for sophorose under these conditions is ~ 2.6 x 10⁻⁶ Å-2, corresponding to a ~46:54 = D2O:H2O mixture. These values are to be
exactly known. Two samples have then been prepared at concentration of the sophorolipid of 50 mg/mL: a) in fully deuterated water (100:0 = D2O:H2O) and b) in 46:54 = D2O:H2O
mixture.
SANS experiments have been performed on the PACE beamline at the Laboratoire Léon Brillouin (LLB) facilities at CEA-Saclay (France). 1 mm quartz cells have been used as sample holder. The low-q portion of the data was recorded using a sample-to-detector distance of 4565.95 mm and wavelength of 6 Å while the high-q portion was recorded using 866.14 mm and 6 Å. The scattering intensity is obtained from the determination of the number of neutrons in the incident beam and the detector cell solid angle. Data were corrected for the ambient background, empty cell scattering, neutron beam transmission and detector efficiency and normalized to the neutron beam flux to get the scattered intensity I(q) in absolute units according to ref. 65. Incoherent signal was substrated by measuring the background value at high-q values for both, sample-free, 100:0 = D2O:H2O and 46:54 = D2O:H2O mixtures. All
data have been treated using the Pasinet 2 software66 provided at the beamline free of charge. Pair distribution function analysis, P(r), was done using the SASView software package44 using estimated Dmax values of 40 Å and 140 Å, respectively for the 46:54 and 100:0 = D2O:H2O mixtures.
Molecular dynamics simulations.
All the MD simulation discussed in this paper were carried out with GROMACS (v4.6.6)67,68 and with the protonated acidic sophorolipid (SL) molecule presented in Figure 1.
Since the SL ionization degree is found to be < 5 % (see the experimental section) and similar to Prasad et al.,69 we only simulated the protoned form of the SL and without ions. As in a
previous work69 to model the surfactant, we used an “united-atom” force field based on the GROMOS53A670. In particular, the parameters of the sophorose group were taken from the
GROMOS53A6 force field for carbohydrates (56A6CARBO) developed by Hansen et al.71
Concerning the alkyl chain (with the double bond) and the COOH groups, the parameters were taken from Kukol72 and the glutamic acid parameters available in the GROMOS53A670 force field, respectively. To be consistent with the GROMOS force field, we used the simple charge water model (SPC)73 to model water with the SETTLE algorithm74 to keep its geometry rigid.
Figure 1 - Acidic sophorolipid surfactant with the atom-numbering scheme and part used in the work (see main text for details).
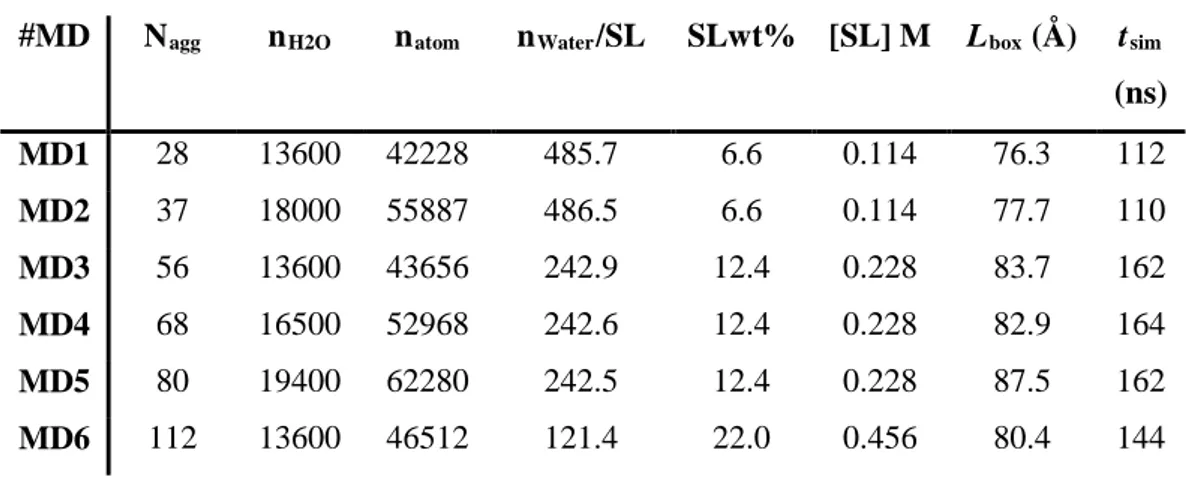
We have to mention that by not taking into account in the simulation the effects of the pH and presence of the ions in the solution, our simulations may have some limitations. However, as we will see further, the simulation results are consistent with the reported experimental data and we think they provide a good model basis of the micelle as a function of their aggregation numbers. To have a large overview of the micelle characteristics as a function of the SL aggregation number, Nagg, we carried out 6 MD simulations with different SL Nagg values (Table 2). Specifically, we chose 28 and 37, values obtained by Penfold et
al.36 for mixture of sophorolipids (sample S4 in ref. 36: 52.2% non acetylated, 39%
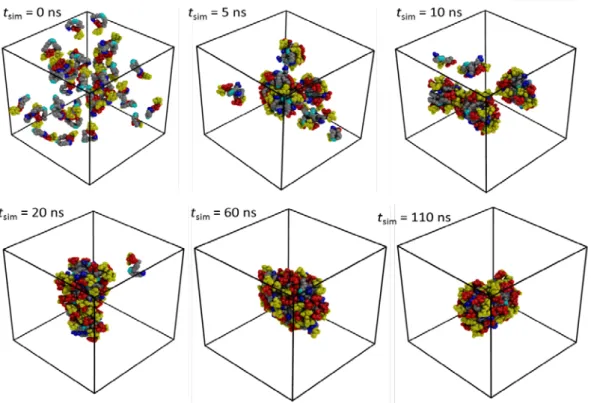
mono-acetylated and 8.5% di-mono-acetylated) respectively at 5 mM and 30 mM; 56 and 68 adapted from the SAXS data in this work (Table 3, RbCl system). In addition to these simulations, we also performed two more simulations with Nagg = 80 and 112, to examine the effect of high Nagg values of the SL aggregate structure. These two Nagg values correspond to an intermediary point between 56 and 68 and a value estimated by Penfold.36 The effective concentrations of the simulated systems are in a range of 110 mM and 456 mM (given SL mass fraction, SL wt% of 6.2 – 12.6 %), larger than the experimental concentration (80 mM) to reduce the number of water molecules and, consequently, the computational cost of the simulations. To construct the system for simulation, we used a self-assembled approach, where the corresponding number of sophorolipids with a random orientation was inserted in a SPC water cubic box. All the systems were minimized, equilibrated and finally simulated at ambient conditions (P = 1.015 bar and T = 303 K). Specifically, the temperature and the pressure were controlled with the Bussi et al.75 thermostat (τ
T = 0.1 ps) and the Parrinello-Rahman76,77 barostat (τ
equilibration stages, the SL molecules were harmonically restrained with a force constant of 1000 kJ.mol.nm-1 to equilibrate the solvent around the sophorolipids. SL and water molecules
were coupled separately with two thermostatic baths as a standard rule. To integrate the equations of motions, we used a time step of 2 fs with the P-LINCS algorithm78 to restrain bond lengths to their equilibration values. Electrostatic interactions were treated with the reaction field approach79 with the non-bonded interactions evaluated with a twin range cutoff scheme, with a short- and long-range cutoff distances of 8 Å and 14 Å, respectively and an update frequency of 2 timesteps for the short-range pair list. To correct the truncation of electrostatic interactions outside the cutoff of 14 Å, a reaction field term79 corresponding to a relative dielectric permittivity of the SPC water (61)80 was added. Finally, the production simulations were performed during 110 – 162 ns with the atomic data collected every 2 ps for subsequent analysis
Table 2 - Overview of the simulated systems. Nagg, nH2O and natom are the numbers of sophorolipid
monomers, water, and atoms composing each systems. nWater/SL, SLwt% [SL], Lbox and tsim are the
number of water per sophorolipid molecule, the sophorolipid concentration, the total mass fraction, the box size and the simulation time (in ns), respectively.
#MD Nagg nH2O natom nWater/SL SLwt% [SL] M Lbox (Å) tsim
(ns) MD1 28 13600 42228 485.7 6.6 0.114 76.3 112 MD2 37 18000 55887 486.5 6.6 0.114 77.7 110 MD3 56 13600 43656 242.9 12.4 0.228 83.7 162 MD4 68 16500 52968 242.6 12.4 0.228 82.9 164 MD5 80 19400 62280 242.5 12.4 0.228 87.5 162 MD6 112 13600 46512 121.4 22.0 0.456 80.4 144
Results and Discussion
Description of the “coffee bean” like prolate ellipsoid of revolution model
As critically discussed on Page S2 in Supporting Information, the best shape model to fit SAXS data is the core-shell prolate ellipsoid of revolution function, which gives good χ2/Npts values below 15. The geometric parameters of this model are the equatorial core radius, RC, the axial core ratio XC (XC>1 for prolate micelles), the equatorial shell thickness,
Figure 2 – Core-shell prolate ellipsoid of revolution model chosen to fit the SAXS data
For a constant shell thickness, XS= 1, the fit gives a χ2/Npts value around 13. However, the best fit (χ2/Npts = 6.7) is obtained for a slightly negative X
S value (XS ~ -0.2) corresponding to a small and negative polar shell thickness in the axial direction, TP, of the core-shell ellipsoid of revolution model.
Figure 3: SAXS curve recorded on the SrCl2-25mM system: influence of XS (polar shell ratio) value on the
calculated curves obtained with a core-shell ellipsoid of revolution form factor. Best fit is given in red.
In Figure 3, we report a typical SAXS curve recorded on sample 7 (SrCl2-25mM), which
shows a series of fits using the same core-shell prolate ellipsoid of revolution form factor model and a variable XS, allowed to vary between 0 and 1. It can be clearly seen that the bottom of the first minimum is best fitted with a negative XS value, a fact which has no clear
physical meaning, as it supposes that there is a small part of the hydrocarbon core which is in close contact with the aqueous solvent at the end-tips of the ellipsoid in the axial direction. However, as the best fit is always obtained for XS< 0, we impose XS= 0 for all samples’ profiles. We interpret this assumption as follows: the end-tips in the axial direction of the sophorolipid aggregates are somewhat difficult to describe and may consist of a quite disorganized assembly, containing COOH groups, sophorose, salt, water and part of the aliphatic chain.
It is important to note that whatever the absolute value of XS, the trends obtained for the other variables is unchanged, as it can be seen from the comparison between the fit parameters for XS= 0 presented in Table 3 (discussed later in more detail) and the fit parameters obtained for XS= 0.3, shown in Table S2/Table S3 in the Supporting Information. Except the surprising feature of XS= 0, all other variable parameters give realistic values: the equatorial core radius and shell thickness are around 7.7 and 12.3 Å respectively, and the shell SLD is 1.1 x 10⁻⁵ Å-2 (387 e-/nm3), corresponding roughly to 73 % v/v of water in a simple water-sophorose composition of the shell (Table 4). The XC ratio of 9.4 characterizing the elongation of the ellipsoid is slightly high, if it compared with previous results33 and will be discussed thereafter.
The resulting shape that best describes the sophorolipid micelles is very close to a “coffee bean” like, with a variable shell thickness from TS to 0, which is quite atypical with respect to the majority of both ionic, non-ionic and bolaform16 surfactant systems, generally
described by core-shell form factors with a homogeneous shell thickness.19-21 Nevertheless,
this peculiar shape is the best suited to fit at best all systems described in this work and a large number of complementary other systems.
All SAXS measurements were made at the same sophorolipid concentration, 80 mM, and at concentrations of salt and/or base in the range from 5 to 100 mM. Table 3 shows the model parameters (Nagg, Rc, Xc, z, ρs) for core-shell ellipsoidal micelles of the sophorolipids with either salt or a base at various concentrations, but also the calculated shell thickness (TS) and volume fraction of CH2 in the dry core (α). Table 4 presents the volume fraction of water
(xv,w), and number of water molecules per sophorolipid (nw/SL) in the shell; these have been indicated for three possible headgroup (hg) scenarios: hg_1 considers only sophorose and COOH (or COO-); hg_2 includes the hg_1 hypothesis and the C17 and C18 atoms; hg_3
excluded from the core (13(1-α), where α has been defined in Eq.4 and experimental values given in Table 3).
First of all, the results show that the equatorial core radius RC, which corresponds to the dry part of the micelle, is relatively small, between 6.0 and 8.0 Å, a value which is the lower limit of what is acceptable for the model. In return, the thickness of the shell, between 11.0 and 12.5 Å, is quite large if this value is compared with those reported in the literature for similar systems studied by SANS (~8 Å, ~3 Å), 33,36 a discrepancy that may be explained by the different contrasts inherent in each technique. At the same time, the value of α is contained in the range between 0.52 and 0.72 depending on the system and it mainly indicates that a significant proportion of the hydrocarbon chain is in an aqueous environment and that is the counterpart of the small core and large shell of these aggregates. This is expected for a bolaamphiphile, as quantitatively demonstrated here below.
Table 3 – Fit parameters obtained from the core-shell ellipsoid of revolution form factor using Xs= 0
(defined in Figure 2). Nagg= aggregation number; RC= equatorial core radius; XC= axial core ratio; TS=
equatorial shell thickness; ρs= scattering length density of the shell; α= fraction of CH2 inserted in the dry
core of the micelle (Eq. 4); z= charge per micelle.
Sample NAgg RC (Å) XC TS (Å) ρS x 10-5 (Å-2) α z RbCl-10mM 55 8.0 6.5 12.0 1.0741 0.70 RbCl-50mM 64 8.0 7.7 11.7 1.0768 0.72 RbCl-100mM 69 7.9 8.1 11.5 1.0829 0.69 SrCl2-5mM 52 7.7 6.9 12.4 1.0608 0.71 SrCl2-25mM 72 7.7 9.4 12.3 1.0611 0.72 SrCl2-50mM 73 7.8 8.9 11.8 1.0751 0.69 RbOH-40mM 34 6.6 5.5 12.3 1.0618 0.55 6.8 RbOH-80mM 24 6.1 4.7 11.0 1.0707 0.53 9.9 Sr(OH)2 -10mM 50 7.2 6.8 12.6 1.0632 0.59 4.6 Sr(OH)2 -20mM 41 7.0 5.4 12.3 1.0785 0.52 5.0
Table 4 - xv,w= volume fraction of water in the shell (Eq. 7) and nw/SL= number of water molecules per
sophorolipid (Eq. 8). Several compositions of the headgroup are considered: headgroup 1, hg_1≡ sophorose + COOH; headgroup 2, hg_2≡ sophorose + COOH + CH (C17) + CH3 (C18); headgroup 3,
hg_3≡ sophorose + COOH + CH (C17) + CH3 (C18) + 13(1-α)CH2. Grey-shaded area refers to the
Sample xv,w n w/SL hg_1 hg_2 hg_3 hg_1 hg_2 hg_3 RbCl-10mM 0.70 0.65 0.54 32 29 23 RbCl-50mM 0.69 0.64 0.54 31 28 22 RbCl-100mM 0.68 0.63 0.51 29 26 20 SrCl2-5mM 0.73 0.68 0.59 37 34 28 SrCl2-25mM 0.73 0.68 0.59 37 34 28 SrCl2-50mM 0.70 0.65 0.54 32 29 22 RbOH-40mM 0.73 0.68 0.53 37 34 24 RbOH-80mM 0.71 0.66 0.49 33 30 21 Sr(OH)2 -10mM 0.72 0.68 0.54 36 33 24 Sr(OH)2 -20mM 0.69 0.64 0.46 31 28 18
Shell hydration vs. ion condensation
nw/SL gives an estimate of the number of water molecules per sophorolipid in the shell. As shown in Table 4, this parameter strongly depends on the supposed composition of the dry headgroup. If one only considers the sophorose and COOH groups to be part of the shell (hg_1 hypothesis in Table 4 ), nw/SL varies between 29 and 37. In the hg_2 scenario (hg_1 plus CH and CH3), nw/SL does not vary much, as it is comprised between 26 and 34, indicating that inclusion of CH and CH3 in the headgroup does not have a substantial impact on the shell
hydration. Finally, if one includes the fraction of CH2 not included in the core (13(1-α)), hg_3
hypothesis in Table 4, the hydration is sensibly lower and nw/SL now varies between 18 and 28. As first comment, we must state that these estimations should be taken with caution, because our SAXS model does not include the presence of ions in the shell, which can also be responsible for the variation of the shell SLD. The proportion of ions in the shell could be controlled in the fit through, for example, an adjustable parameter k= number of cations per sophorolipid in the shell. However, k cannot be determined without fixing the number of water molecules per sophorolipid, both parameters influencing the value of ρS in opposite ways: ionic species increase the value of ρS, whereas water molecules decrease it. By neglecting the influence of ion concentration, the number of water molecules per sophorolipid is adjusted to account for both effects, so that an increase of ρS leads to a decrease of nw/SL even if it can come in reality from an increase of the ion condensation. As a result, the number
of water molecules per sophorolipid reported in this case can be interpreted as minimum values, even if the space filling requirement may also have an influence. This approximation will be confirmed by the ASAXS experiments, which will show that the amount of counterions in the shell is practically negligible, unless their concentration becomes important.
Secondly, values of nw/SL above ~25 are higher than expected from the literature about glycolipids and disaccharides. It is well-known that hydration properties of disaccharides with the same chemical formula as sophorose (maltose, sucrose and trehalose, C12H22O11) but
different structures, are different, depending on the solute-water interactions.81,82 Effects coming from the linkage type between the two glucose unit (sophorose is a glucose β(1,2) saccharide), the position of hydroxyl groups, the number of intracellular hydrogen bonds may influence the hydration properties of disaccharides and have been extensively studied. For example, the headgroup hydration number of maltoside surfactants is reported to be 8 in the case of SAXS studies83 and in Abel et al.84 with MD simulations. For the trehalose, which is known as being slightly more hydrated than maltose,81,82 Lupi et al.85 report values taken from literature that lie between 4 and 18. It is well-known that hydration numbers reported depend on the experimental method and/or assumption adopted. Ultrasonic measurements give values among the highest, and MD simulations for which the hydration number is defined as the number of H-bound water leads to similar values (around 15 to 18) suggesting that these experimental hydration numbers mainly refer to water molecules directly involved in H-bonds with the solute. In contrast, in their study on hydration and mobility of trehalose in aqueous solution, Revsbech Winther et al.86 used a geometric hydration number, identified as
the number of water molecules required to cover the solute with one layer (47 water molecules per trehalose).
The values obtained in this work are for a micellar shell composed of a sophorose group, that is a disaccharide and the hydration properties of which, if they are reasonably expected to differ from maltose and trehalose, should still not be excessively high. For this reason, the hg_3 hypothesis provided in Table 4 is most likely to be real, as reasonable values are certainly the ones including the COO- (or COOH), the CH and CH3 groups but also
13(1-α)CH2 groups and an unknown, and variable, number of ions, depending on the sample
composition. More than reasonable, hg_3 hypothesis is actually expected: if hydration numbers of COOH, CH2 and CH3 are reported to be small, 1.153, 0.999 and 0.586
respectively,87 it is expected the aliphatic chain portion close to the headgroup to be hydrated. Typical estimations (both experimental and theoretical) for alkylammonium salt and SDS
surfactants are that up to 3 CH2 groups from the polar head can be hydrated.50-52 In this work,
we find between 4 and 7 hydrated CH2 groups per sophorolipid (calculated as 13(1-α)CH2,
where α is given in Table 3); these values can reasonably be expected for a system containing two polar headgroups. On the other hand, hydration number of ions is higher and, depending on the ionic concentration, it can influence the SLD of the shell quite heavily: reported hydration numbers lie between 6 and 8 for Rb+, between 4 and 8 for Na+,88 and between 7.3 to 10.3 for Sr2+.89 According to the ASAXS experiments reported in the next section and showing a negligible amount of counterions in the shell, one can consider the amount of hydration water to be also negligible.
If the contribution to the hydration from all species can reasonably explain the experimental values of nw/SL found here, one should still take these values with caution, given the wide range of variation of the theoretical values. Moreover, there is no indication that the micelle shell does not contain free water that is not accounted for in the hydration numbers reported. The shell hydration may also be strongly related to the conformation of sophorolipids within the micelle, depending on the molecular structure of the sophorolipid and its impacts on the micellar structure.
As we can see from Table 3, the shell thicknesses reported here are always greater than 10.5 Å and usually between 11.0 and 12.5 Å, a range of values which seems to be high compared to the size of the sophorose alone, estimated to be below 10 Å,32 7.3 Å in
poly-sophorolipids,90 or 9 Å for trehalose.86 The shell thickness of SL micelles determined by
SANS was also reported to be around 8 Å.33 The quite thick shell found here may take into
account the “roughness”4, confirmed by the MD simulation in the next sections, of the apolar
core and hydrated shell interface coming from the presence of CH2 in the hydrated shell
environment. We can estimate the typical separation distance between sophorose molecules in the shell from the sophorose molar concentration (0.93-1.34 mol.L-1.) to be around 3.5-5.1 Å, by using molecular parameters of trehalose (see Ref 86). This space, filled by the other components of the shell, can accommodate one water layer, and even if there are some alkyl groups in close contact with the sophorose, regarding the geometric hydration number of 47 for trehalose in water, the number of water molecules per sophorolipid in the shell presented here, which lie from 20 to 30, in the hg_3 hypothesis, does not seem outrageous.
Table 5: Area parameters; Amic,w/SL= area per sophorolipid at the micelle/solvent interface; AC,S/SL= dry
Sample AC,S/SL (Å) Aalkyl/sopho (Å) Amic,w/SL (Å) L (Å) RbCl-10mM 75 104 196 3.76 RbCl-50mM 76 103 194 3.69 RbCl-100mM 74 102 187 3.49 SrCl2-5mM 78 108 213 4.21 SrCl2-25mM 79 106 208 4.19 SrCl2-50mM 75 103 193 3.72 RbOH-40mM 71 124 219 4.04 RbOH-80mM 75 141 231 3.72 Sr(OH)2-10mM 70 111 204 4.03 Sr(OH)2-20mM 64 112 190 3.48
Area per sophorolipid
Another interesting piece of information is given by the analysis of the area per sophorolipid at the micelle/solvent interface (Amic,w/SL), and at the dry core/hydrated shell interface (AC,S/SL, see Table 5). These are calculated using the classical formula for the surface area of a prolate ellipsoid divided by Nagg; the values of the semi-axes, as defined in Figure 2,
are given in Table 3. Micellar structure of dodecyl maltoside has been described by Cecutti et al.91 showing that ellipticity of the micelle comes from the bulky hydrated maltose headgroups and their perpendicular conformation to the interface. Area per dodecyl maltoside at the micelle/solvent interface and at hydrophobic core/sugar headgroup interface are 87 and 50 Å2, respectively. In the case of sophorolipids, however, one must keep in mind that there is one alkyl chain and two different polar heads per surfactant, leading to values lying from 187 to 230 Å2 per sophorolipid at the micelle/water interface, and from 64 to 79 Å2 per SL at the core/shell interface, depending on the sample composition. Another point to consider is that the core/shell interface in our case is located quite far from the sugar headgroup, considering the α value lying around 0.52 - 0.72. If the alkyl chains are perpendicular to the core/shell interface, we can estimate the area per sophorolipid between the alkyl chain and the sugar/carboxylate headgroup Aalkyl/sopho to be the surface per SL of an ellipsoid of equatorial radius RC+6.5(1-α)1.265 and axial radius RCXC+6.5(1-α)1.265 (noticing that this surface may be slightly overestimated as the influence of the XS parameter is neglected). In this case, areas
reported lie between 102 to 141 Å2 for the most ionized micelles, comparable to that reported by Chen et al.92 for SL at air-water interface (104 Å2).
Ionic and basic effects
According to the results in Table 3, some general observations can be made regarding the effect of salts on sophorolipids micelles. First, the salts cause an elongation of the micellar aggregates and subsequent increase of the aggregation number, while the diameter of the core remains constant. For instance, increasing RbCl from 10 mM to 100 mM, it produces an increase of XC from 6.5 to 8.1, whereas RC is practically 8 Å. However, it appears that the elongation due to the presence of salt has a limit, observed through Nagg and XC values which increase rapidly between 10 and 50 mM of RbCl (5 and 25 mM of SrCl2) and then seem to
reach a plateau at higher concentration, around 73 for Nagg and 8.5 – 9.0 for XC. Another fairly clear effect of adding salt is the slight shell shrinkage and the concomitant dehydration observed through the shell thickness (TS), the volume fraction of water in the shell (xv,w) and the decreasing number of water molecules per sophorolipid (nw/SL).
The shell SLD, ρS, is in the range between 1.06 and 1.09 x 10⁻⁵ Å-2, where the smaller value is systematically observed for the SrCl2 salt system. Small differences between the two
salts is also observed on the values of RC, TS, xv,w and nw/SL. The sophorolipids micelles in the presence of SrCl2 have slightly smaller cores, a shell slightly thicker and hydrated than in the
presence of RbCl. These differences have no impact on the value of α that remains constant for all the salt systems, and quite high (around 0.69 - 0.72). The aggregation number Nagg is slightly smaller for SrCl2 at low salt concentration (52 vs 55), while at higher concentration
the elongation of sophorolipids micelles is more pronounced with SrCl2 than with RbCl (XC
reached a value of 8.9 for SrCl2 and 8.1 only for RbCl). Areas per sophorolipid and the
average length between the headgroups, L, reflect these small differences, being slightly higher for SrCl2 than for RbCl (Table 5).
Adding a base to sophorolipids micelles solutions considerably changes the physico-chemical parameters. First of all, one observes the appearance of intermicellar interactions, accounted here with the introduction of a structure factor described with a repulsive screened Coulombic intermicellar interaction potential. This is consistent with what it was previously reported.33 In terms of micellar size, the equatorial core radius is dramatically reduced, from 7.2 Å for the less basic system (Sr(OH)2 – 10 mM) to 6.1 Å for the most basic system (80
mM RbOH) while the XC ratio is much smaller than those reported above, decreasing to values smaller than 6 for all [OH-] higher than 40 mM. The aggregation number follows this trend, decreasing to 24 for RbOH 80 mM. α also undergoes a fall, reaching values around
0.52, which indicates that in basic medium, half of the total amount of CH2 are located in an
aqueous environment. These trends are consistent with an increase of the micelle curvature due to the increased electrostatic repulsion taking place between more ionized headgroups. The shell thickness is practically invariable (12.3 Å) for the less basic samples (RbOH-40 mM and Sr(OH)2-20 mM) and substantially decreases (11.0 Å) at high concentration of RbOH.
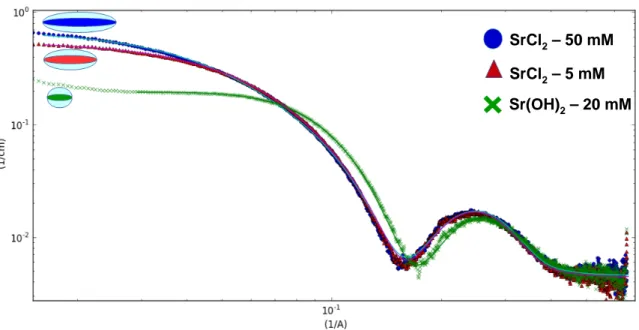
Finally, Figure 4 shows the typical SAXS profiles of sophorolipids in the presence of SrCl2
and Sr(OH)2, showing the experimentally found spectral differences and a pictorial imaging
of the salt and base effect on the micellar size.
SrCl2– 50 mM SrCl2– 5 mM Sr(OH)2– 20 mM SrCl2– 50 mM SrCl2– 5 mM Sr(OH)2– 20 mM
Figure 4 – SAXS spectra of sophorolipids in the presence of SrCl2 and Sr(OH)2. The pictures represent
the ellipsoidal nature of the micelle with a Xs= 0, as commented before. The difference in longitudinal
dimension among the ellipsoids is based on the data obtained from the best fits and presented in Table 3
Counterion distribution in the salt systems studied by ASAXS
ASAXS is a powerful method to put in evidence the distribution of counterions in soft matter, and in particular around polyelectrolytes and micelles.57-62 It was employed to describe the charge distribution around charged polymers,58,61 DNA and RNA93 and CTAB micelles. 60,62 In this study, ASAXS is employed with the goal of revealing indirectly the distribution of the COO- groups, if one assumes that its negative charge is neutralized by a counterion upon increasing the solution pH. In this case, the SAXS spectrum shows a broad scattering hump, which can be nicely fitted using a Screened Coulomb potential, as it was previously done in SANS experiments.33 The resulting negative charge of the micelles settles between -5 and -10 (Table 3) and it clearly increases upon increasing the amount of base for
both Rb+ and Sr2+. ASAXS can be used both in a qualitative and quantitative way.62,63 If the
former tells about the space distribution of counterions, the latter provides data on the amount of counterion in the proximity of charged macroions and even their binding degree. However, the quantification process can be very delicate60,61,94 and it was mainly used so far on either polyelectrolytes or robust micellar systems.
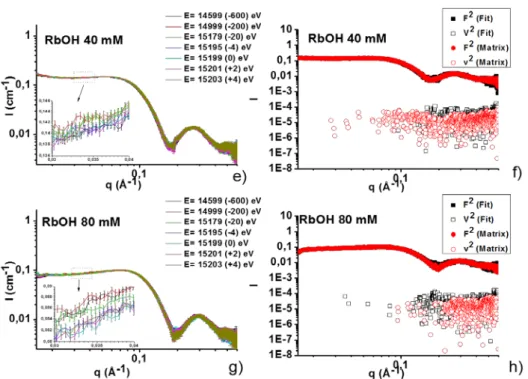
Figure 5 – a, c, e, g) Energy-dependent SAXS spectra for the sophorolipid - RbCl (10, 100 mM) and RbOH (40, 80 mM) systems. The energies at which the spectra have been recorded are indicated in the
figure. b, d, f, h) F2(q) and v2(q) scattering profile of the cation (Rb+ and Sr2+) as obtained from the
ASAXS treatment of the spectra. More experimental details are presented on Page S6 in the Supporting Information.
Figure 5 shows the typical scattering profile, I(q), recorded for the RbCl (10, 100 mM) and RbOH (40, 80 mM) systems at the incident energy E= 14599, 14999, 15179, 15195, 15199, 15201, 15203 eV, corresponding to the ∆ERb+= -600, -200, -20, -4, 0, +2, +4 eV
(treatment of background is shown in Figure S2 in the Supporting Information). The ASAXS results are only shown for the RbCl system but very similar conclusions can be drawn for the SrCl2-containing samples, and for this reason they will not be reported here. As explained in
the experimental section, fluorescence contribution has been subtracted for all spectra. At a first glance, spectra are very close to each other but a closer look in the inset of Figure 5a,c, for instance, indicate that I(q) appreciably (with respect to the error bars) increases with increasing energy (colour sequence: black, red, green, blue...) for both the RbCl 10 mM and 100 mM systems. This effect is expected in the case of an anomalous effect upon varying energy through the edge and it demonstrates that Rb ions decorate the micellar outer surface. Nevertheless, variation in I(q,E) is very mild; at 100 mM RbCl (Figure 5c), a concentration in counterions at which the anomalous effect was reported to be very important for polyelectrolytes and ionic surfactants systems,62,63 I(q,E) only varies by a factor 1.04 when
measured far below and at the absorption edge [I(0.03,14599)= 0.47 cm-1 compared to
I(0.03,15199)= 0.49 cm-1 at the Rb+ edge], while expected variations should not be less than a
factor 2. This is further demonstrated by the splitting of I(q) into the F02(q) and v2(q) components, respectively, the nonresonant intensity of the macro-ion and the pure resonant contribution of the counterion, shown in Figure 5b,d. The splitting shows no noticeable effect on the 10 mM system using both the matrix and fit methods, and a mild anomalous effect on the 100 mM system, but only employing the matrix method. This last result is coherent with the higher salt amount present in this system, thus indicating that part of Rb+ cation in solution decorate the micellar shell. This result helps better understanding the evolution of the shell SLD (ρs) commented in the SAXS section (Table 3). One can now affirm that the amount of salt in the shell is below the limit of detection of the ASAXS technique, which can reasonably be settled in the mM range. This shows that the very small increase in the ρs, found for the RbCl, but also the SrCl2 systems, is most likely due to a true variation in the
number of water molecules per sophorolipid. However, for the higher RbCl concentrations (e.g., 100 mM), one cannot exclude the presence of larger amounts of salt in the shell, a fact which may also, as commented before, account for the mild increase in ρs. Interestingly, in the presence of salt alone, the equilibrium pH of a sophorolipid solution is slightly below 5. The corresponding experimental ionization degree (
[
]
[
]
[
−]
−
+ COO COOH
COO
), calculated from the titration curve (Figure S3 in the Supporting Information), is below 5 %. This means that at high salt content, counterions decorate the hydrophilic shell independently from the presence of carboxylate groups. In terms of quantification, the mild anomalous effect recorded does not allow a reasonable quantification of the amount of counterions-per-sophorolipid.
Upon addition of RbOH, carboxylic groups deprotonate into carboxylates, which carry their respective counterions, our hypothesis33 being that the negative charges are settled at the
micellar/water palisade. Under these assumptions, this effect should be detectable by ASAXS at a larger extent with respect to the base-free medium. The corresponding experiments in Figure 5e,g show, on the contrary, that I(q) undergoes no sensible evolution with the incident energy, as all curves practically lie with in a small range comprised in the error bars. The poor anomalous scattering effect is confirmed by the signal splitting using both the fit and matrix methods (Figure 5f,h), which do not provide a significant v2(q) component. Since similar results are obtained with Sr(OH)2, these will not commented further. How to interpret this
![Table 1 – List of samples studied in this work. Sophorolipid concentration is constant (80 mM) for all samples Sample Compound [Sr 2+ ] mM [Rb + ] mM 1 RbCl - 10 2 RbCl - 50 3 RbCl - 100 4 RbOH - 40 5 RbOH - 80 6 SrCl 2 5 - 7](https://thumb-eu.123doks.com/thumbv2/123doknet/13321972.399951/7.892.103.491.529.764/samples-studied-sophorolipid-concentration-constant-samples-sample-compound.webp)