HAL Id: halshs-00112525
https://halshs.archives-ouvertes.fr/halshs-00112525
Submitted on 8 Nov 2006HAL is a multi-disciplinary open access archive for the deposit and dissemination of sci-entific research documents, whether they are pub-lished or not. The documents may come from teaching and research institutions in France or abroad, or from public or private research centers.
L’archive ouverte pluridisciplinaire HAL, est destinée au dépôt et à la diffusion de documents scientifiques de niveau recherche, publiés ou non, émanant des établissements d’enseignement et de recherche français ou étrangers, des laboratoires publics ou privés.
Firm investment and monetary policy transmission in
the Euro Area
Jean-Bernard Chatelain, Andrea Generale, Ignacio Hernando, Ulf von
Kalckreuth, Philip Vermeulen
To cite this version:
Jean-Bernard Chatelain, Andrea Generale, Ignacio Hernando, Ulf von Kalckreuth, Philip Vermeulen. Firm investment and monetary policy transmission in the Euro Area. Angeloni I., Kashyap A., Mojon B. Monetary Policy Transmission in the Euro Area, Cambridge University Press, pp.100-130, 2003. �halshs-00112525�
FIRM INVESTMENT AND MONETARY POLICY
TRANSMISSION IN THE EURO AREA
J.B. Chatelain1, A. Generale2, I. Hernando3, U. von Kalckreuth4, P. Vermeulen5
2003
Abstract
This paper presents a comparable set of results on the monetary transmission channels on firm investment (the interest rate channel and the broad credit channel) for the four largest euro-area countries (Germany, France, Italy and Spain), using particularly rich micro datasets for each country containing over 215,000 observations from 1985 to 1999. For each of those countries, investment relationships are estimated explaining investment by its user cost, sales and cash flow. A first result is that investment is sensitive to user cost changes in all those four countries. This implies an operative interest channel in these euro-area countries. A second result is that investment in all countries is quite sensitive to cash flow movements. However, only in Italy do smaller firms react more to cash flow movements than large firms, implying that a broad credit channel might not be equally pervasive in all countries.
JEL Classification numbers: E22, E50
Keywords: Investment, Monetary Transmission Channels, User Cost of Capital
Résumé
Cet article présente un ensemble de résultats comparables sur les canaux de transmission de la politique monétaire via l’investissement des entreprises (canal du taux d’intérêt et canal large du crédit) pour les quatre pays les plus grands de la zone Euro (l’Allemagne, l’Espagne, la France et l’Italie) en utilisant des bases de données particulièrement riches pour chaque pays, contenant plus de 215 000 bilans d’entreprises de 1985 à 1999. Pour chacun de ces pays, une fonction d’investissement est estimée où l’investissement est expliqué par le coût du capital, les ventes et l’autofinancement. Une premier résultat est que l’investissement dépend effectivement du coût du capital dans ces quatre pays. Ceci montre que le canal du taux d’intérêt via l’investissement a des effets non négligeables dans ces pays de la zone Euro. Un second résultat est que l’investissement dépend de l’autofinancement dans ces quatre pays. Cependant, c’est uniquement en Italie que l’investissement des entreprises de petite taille dépend plus fortement de l’autofinancement par rapport à l’investissement des autres entreprises. Ceci suggère que le canal large du crédit n’a pas nécessairement la même vigueur dans ces quatre pays.
Mots clés : Investissement, canaux de transmission de la politique monétaire, coût du capital.
1
Laboratoire d’économie d’Orléans (LEO), Université d’Orléans; E-mail:
jean-bernard.chatelain@univ-orleans.fr ; 2 Banca d’Italia; E-mail
generale.andrea@insedia.interbusiness.it;3 Banco de España; E-mail hernando@bde.es; 4 Deutsche
Bundesbank; E-mail: ulf.von-kalckreuth@bundesbank.de; 5 European Central Bank: E-mail:
philip.vermeulen@ecb.int. This paper represents the authors’ personal opinions and does not necessarily reflect the views of the institutions they are affiliated to. We would like to thank the members of the Eurosystem’s Monetary Transmission Network, the participants of the monetary economics workshop at the NBER Summer Institute 2001 and Robert Chirinko for helpful discussions and feedback, and especially Daniele Terlizzese for his very helpful comments. Forthcoming in “Monetary Policy Transmission in the Euro Area”, Angeloni I., Kashyap A. and Mojon B., editors, Cambridge University Press.
I. Introduction
Monetary policy is generally thought to be able to affect business investment through multiple channels. First, a traditional interest-rate channel is identified, whereby changes in market interest rates imply changes in the cost of capital, which in turn affect investment. However, the difficulties of using aggregate data to find clear evidence of this channel are well known. Second, changes in market interest rates affect the net cash flow (i.e. cash flow after interest payments) available to a firm. Given imperfect capital markets, the availability of net cash flow will have an effect on investment. This is generally referred to as the “broad credit channel”.
This paper provides an investigation of those two channels based on results from a unique comparative study of the four largest euro-area countries.2 Using rich firm databases for each country, standardised regressions were run to make comparison across countries feasible. Although, for confidentiality reasons, individual data could not be pooled – making formal statistical testing impossible – the standardisation of the analysis should still allow asymmetries in the working of the above channels to be detected. In particular, reliance on firm data should make it possible to identify whether there are differences in the behaviour of firms with otherwise similar characteristics. This has a distinct advantage over the inference based on aggregate data in which “true” differences in behaviour are potentially confounded by differences due to composition of the firms in the aggregate.
The rest of the paper is structured as follows. In section 2 we motivate the analysis and spell out the relevant questions that can be answered by comparing the results across countries. In section 3 we describe the theoretical framework. In section 4 we present our data. In section 5 we present the regression results. In section 6 we test whether a broad credit channel is operative in the euro area. In section 7 we investigate the link between monetary policy, user cost and cash flow.
II. Motivation of the analysis
Since the beginning of monetary union in Europe, a large body of empirical analysis has been devoted to the transmission mechanism of monetary policy. These
2
Mojon, Smets and Vermeulen (2001) investigate the elasticity of investment with respect to its user cost using industry data on the same four countries. The MTN project has led to a number of complementary companion papers on investment and monetary policy: Butzen, Fuss and
Vermeu-len (2001), Chatelain and Tiomo (2001), Gaiotti and Generale (2001), von Kalckreuth (2001), L
analyses are usually justified by the observation that a common monetary policy affects economies characterised by a high degree of heterogeneity.
This paper is a contribution to the discussion of monetary policy transmission in the euro area; it focuses on the four major euro-area countries by using data collected at the national level. Our perspective is at once wider and narrower than the one motivating previous research. It is narrower in that we limit our attention to a specific channel of monetary policy, firms’ investment spending. It is wider in that, by using micro data, we try to take into account the relevance of firms’ balance-sheet conditions in the transmis-sion of monetary policy. The contribution of the paper consists mainly in an assessment of the main determinants of investment spending in each of the countries.
Interest in the transmission mechanism is motivated by a variety of reasons that also can have policy implications. First, for a careful assessment of the monetary stance in the area, it is important to know if the pure interest channel is the only channel at work. If agents’ financial conditions are shown to be important, then knowing these conditions proves to be important for the policy maker; at the same time this knowledge helps to better forecast the likely effects of a monetary policy decision.
As it is well known, the main channels of monetary policy transmission have been thoroughly examined mainly using macro information (see the survey in Guiso, Kashyap, Panetta and Terlizzese, 1999). These kind of analyses have, on the one hand enabled regularities and differences across the countries of the euro area to be uncovered; on the other hand, they have proved to be limited in many respects. First of all, it is known that aggregation can blur the differences in the transmission of monetary policy and impede the identification of important parts of the transmission mechanism. Hence, recourse to micro data is often motivated in the literature by the recognition of the limits of aggregate studies. In their U.S. study on the relationship between investment spending and the user cost of capital, Chirinko, Fazzari and Meyer (1999) motivate the use of micro data by the very fact that studies at the aggregate level often fail to find an economically significant relationship between these two variables. As the authors note, this failure could have been due “to biased estimates due to problems of simultaneity, capital market frictions, or firm
heterogeneity that may be better addressed with micro data”.
Moreover, micro data are also needed because of the “extensive variation [in micro data that] will likely provide better instruments [for instrumental variable estimation] than can be obtained at the aggregate level.” The motivation for employing micro data can be generally ascribed to the advantages of panel data estimation versus time series estimation, that is to use “information on both the intertemporal dynamics and
the individuality of entities being investigated” (Hsiao, 1995). Moreover, in our analysis
user cost, sales and cash flow, thus taking into account the fact that the transmission of monetary impulses occurs at the firm level.
In fact, as is well known and indeed very well explained by Chirinko, Fazzari and Meyer (1999), one of the difficulties found in the empirical analysis of the relationship between investment and the user cost is that these estimates usually turn out to be very low. They report that this may be due to simultaneity bias, arguing that “investment
comprises a volatile component of aggregate demand, positively correlated with the business cycle, and business cycle movements correlate with interest rates. Positive investment shocks, for example, can cause positive movements in output and the demand for credit that affect the required rates of return on debt and equity. Conventional wisdom suggests that simultaneity between investment shocks and interest rates biases the user cost elasticity towards zero.” In this respect, the cross-sectional variation coming from the
tax component in the user cost variable that we use in the estimation can be regarded as an exogenous source of variation, thus allowing us to identify the effects of the cost of capital on investment. Moreover, simultaneity problems are reduced by IV or GMM estimation. Hence, the combination of instrumental variable estimation and the exogenous source of variability ensured by tax variations should improve our ability to properly identify user cost effects.3
Finally, micro data permit us to uncover the existence of a broad credit channel, i.e. the second channel of monetary transmission.
The literature on the broad credit channel of monetary policy has emphasised the relevance of information asymmetries in the transmission of monetary policy. In particu-lar, the difficulty faced by lenders in monitoring the projects of “opaque” firms implies that firms’ financial conditions are important for the availability and cost of external finance. The result that, given information asymmetries, the Modigliani-Miller theorem does not hold implies also that firms that are likely to be more exposed to problems of asymmetric information might react more to a monetary tightening (Gilchrist and Zakrajsek, 1995). Analysing the reaction to a common shock of groups of firms characterised by weaker balance sheets and comparing it to other firms that are in a better financial position solves the identification problems encountered with the use of macro-data.
There are also drawbacks in using micro data. They mainly consist in the difficulty of recovering aggregate effects from micro estimations. This is mainly caused by the fact that usually shorter time periods are available in panels, thus
3
It has to be clarified that we are not pursuing the strategy of research adopted by Cummins et al. (1994, 1996) that stretched this line of identification as far as to measure investment elasticities to the user cost in years of major tax reform. At any rate, it is important for us to be sure of having a sufficient amount of variability in the data due to this tax component.
implying that variation in the monetary policy stance can be more limited than with time series data, and that samples are often biased towards specific types of firms. We are aware of these difficulties: as documented in the data set description, we are confident that the sample chosen is quite representative of the firms’ characteristics in each country; moreover, in comparison to other contributions on panel analysis, we have panels that are quite long. A high degree of heterogeneity seems to characterise these economies, in particular with regard to firms’ financial structure, the availability of external funds and the industrial structure. Table 1a illustrates some of these differences.
On the real side, the distribution of firms by size turns out to be quite dissimilar: in Germany only 48 per cent of total turnover of non-financial firms pertained to firms with less than 250 employees, whereas, at the other extreme, in Italy such firms accounted for 71 per cent.
As to financial structure, firms differ markedly with respect to both the availability of external funds and the composition of their financial debt. Table 1a shows that reliance on bank credit is highest in Italy, partly reflecting the more limited role of equity in firm financing; it is much more limited in the other countries. Spain, a country in an intermediate position as to dependence on bank debt, also shows a high share of equity financing, in terms of both capital’s and reserves’ share of firms’ total liabilities and of stock market capitalisation as a percentage of GDP. More importantly, for the transmission of monetary policy impulses, the share of short-term debt differs markedly across countries, with higher values in Italyand Spain. Looking at recent transaction data, flows in bank loans have substantially exceeded flows in shares and other equity in Germany, Italy and Spain. France is the exception to this pattern. It seems to be the country with a lower dependence on bank debt, corroborated by its relatively high stock market capitalisation.
One obvious question that arises when looking at cross-country differences, then, is whether these broad institutional characteristics are conducive to a different reaction to monetary policy. It needs to be clarified that the research strategy adopted in this paper is able to address only partially the issue of asymmetries across countries. We are in fact mainly interested in documenting the importance of the different transmission mechanisms in each country. Our research strategy is the following: we first estimate investment equations for each country, giving us the sensitivity of investment to its main determinants: the user cost, sales and cash flow. This permits an assessment of the relative importance of the different channels in each country. Moreover, by calculating the response of investment determinants to monetary policy we obtain a measure of the elasticity of investment to monetary policy. The comparison of the results obtained across
countries is needed to understand how the transmission of monetary impulses takes place at the country level. Moreover, it gives a rough indication of the existence or absence of asymmetries. For confidentiality reasons, cross-country comparisons cannot are not performed on a pooled data set, thus impeding a formal test on the significance of the differences.
We believe, though, that examining the main channels of transmission in each country is only a first step in assessing the relevance of asymmetries. Consider the case of the broad credit channel: if financial variables prove to be important in a given country, then there is evidence that differences in access to financial markets in this country play a role. But, at the country-by-country analysis stage, finding larger effects of financial variables in one country does not mean that a broad credit channel is at work. One way to partly address this issue consists in performing a test of the differences in reaction to investment determinants for firms that are more likely to be subject to information asymmetries. The detection of significant differences within each country permits us to highlight how widespread heterogeneous behaviour is in the countries we examine. Future research in the field should seek to carefully assess the quantitative importance of the eventual differences found and try to trace the observed differences back to the presence of heterogeneity in behaviour or in the composition of the firms in the economy.
Table 1a: Financial structure, capital markets and real indicators in the euro area
Germany France Italy Spain
Financial structure of manufacturing firms (1)
as a per cent of total liabilities; 1997
Bank credit 6.2 7.2 21.2 11.0
Of which:
Maturity of less than 1 year 3.7 3.3 14.3 6.6
Maturity of more than 1 year 2.5 3.9 6.9 4.4
Bonds 0.2 1.9 0.9 0.1
Capital and reserves 32.9 38.0 28.1 45.7
External financing transactions of non-financial corporations (2)
as a per cent of nominal GDP; Average 1996-1999
Loans 4.5 2.0 2.0 5.4
Securities other than shares -0.1 0.6 0.0 -0.1
Shares and other equity 1.5 3.4 1.3 2.7
Other liabilities 0.8 0.7 1.2 6.3
Capital markets (2)
As a per cent of nominal GDP; 1997
Total financial liabilities of non-financial
firms 128.8 268.4 135.0 209.6
Stock-market capitalisation 39.9 49.5 30.6 56.2
Bonds of non-financial firms 0.1 . 1.6 2.7
Real indicators
Investment/GDP per cent average
1996-2000 (3)
22.2 19.0 19.4 23.3 Share of total non-financial firms turnover
attributable to firms with less than 250 employees 1997 (2)
48.0 56.0 71.0 62.0
(1) Source: BACH data set (European Commission). (2) Source: Eurostat.
(3) Source: OECD and Eurostat.
III. The theoretical framework
The investment model we use is derived from the neo-classical demand for capital. It has recently been estimated using panel data by, among others, Bond, Elston, Mairesse and Mulkay (1997), Chirinko, Fazzari and Meyer (1999), and Mairesse, Hall and Mulkay (1999, 2001). Abstracting from irreversibility, uncertainty, delivery lags and adjustment costs, the first order condition for a firm’s optimisation problem leads to the equality be-tween the marginal product of capital and the user cost of capital UCit:
(
it it)
itK K L UC
F , = , (1)
where i stands for firm, and t stands for time.
Following Auerbach (1983) and Hayashi (2000), we obtain a weighted-average definition of the user cost of capital where the cost of debt and equity are weighted with
their respective share of the total liabilities of the firm. We use the accounting proportions of debt and equity which affects taxation:
] ) 1 ( ) )( ( ) 1 )( ( [ ) 1 ( ) 1 ( 1 s st I I st s it it it t t it it it it t s t t st I st it P P E D E LD E D D AI z itc p p UC τ δ δ ττ + − + + − − ∆ + −− − = + (2)
where s is the sector-specific index, the price of final goods, the price of capital goods of sector s;
st
p
p
stIt
τ
the corporate income tax rate, against which interest payments and depreciation are assumed to be deductible, z the present value of depreciation allowances, and itc the investment tax credit. AI is the apparent interest rate, measured as interest payment over gross debt, LD the long-term debt rate used as a proxy for the opportunity cost of equity, E the book value of equity, andδ
s the industry-specific rate of economic depreciation.In contrast to the King and Fullerton (1984) approach, as used by Harhoff and Ramb (2001) and von Kalckreuth (2001), this user cost of capital does not take into account the differences for dividends and retained earnings for households income tax and the distinction between different capital goods for the computation of the net present value of depreciation allowances.4
Following Eisner and Nadiri (1968), we parameterise the production function by a constant elasticity of the substitution production function:
(
)
σ ν σ σ σ σ σα
β
1 1 1 , − − − + = i t i it i it it it L TFPA L K K F ,α
i +β
i =1, (3)where σ is the elasticity of substitution between capital and labour, ν represents returns to scale, is total factor productivity which we assume to have two components: a firm-specific one and a year-specific one. Substituting the marginal productivity of capital in equation (1) yields: t i
A
TFP
it it it itY
UC
H
K
log log loglog =
θ
−σ
+ , (4) where
ν
σ
−
+
σ
=
θ
1
and ν( )
σ σνα
i t i tTFP
A
H
=
⋅
−1)
(
. (5) itY
represents sales. The variable depends on the time-varying term and the firm-specific termTFP
. The elasticity of capital to sales is unity (it
H
A
ti θ=1), if the
pro-duction function has constant returns to scale (ν=1), or if its elasticity of substitution is unity (σ=1), that is, in the Cobb-Douglas case.
4
The user cost variable in von Kalckreuth (2001) models additional details of the German tax code. However, results in that paper are qualitatively similar to the results presented here.
We do not assume that (4) always holds; instead, we assume that the firm changes its capital stock in the direction of a long-run target value K*:
it it
it
it
Y
UC
H
K
log
log
log
log
*=
θ
−
σ
+
,
(6)
The long-run target value for capital, K*, is not observable, which means that to go from (6) to an empirical specification, we need to specify an adjustment process. We specify an auto-regressive distributed lag model (ADL(3,3). 5):
3 3 2 2 1 1 0 3 3 2 2 1 1 0 3 3 2 2 1 1 0 3 3 2 2 1 1 − − − − − − − − − − − −
+
+
+
+
−
−
−
−
+
+
+
+
+
+
=
it it it it it it it it it it it it it it it ith
h
h
h
uc
uc
uc
uc
y
y
y
y
k
k
k
k
φ
φ
φ
φ
σ
σ
σ
ω
ω
ω
θ
θ
θ
θ
σ
(7)
where we have used lower case letters to refer to the corresponding level variables in logs. In the long run, the effects of a permanent change in the explanatory variables in (7) are assumed to add up to the effect given by (6). This implies that we can identify the long-run elasticities of sales and user cost. The long-long-run user cost elasticity with respect to the stock of capital is given by
σ
=
(
σ
0+
σ
1+
σ
2+
σ
3)
/(
1
−
ω
1−
ω
2−
ω
3)
)
3 2 1
and the long-run sales elasticity with respect to the stock of capital is
1
/(
)
(
θ
0θ
1θ
2θ
3ω
ω
ω
θ
=
+
+
+
−
−
−
. Some caution has to be taken ininterpreting these long run coefficients. The ADL is a reduced form of some underlying unknown structural model of adjustment of the capital stock. As such the long-run coefficients can contain both expectational and technology parameters. At this stage, there are two possible strategies. The first one transforms the ADL model into an error-correction model (Hall, Mairesse and Mulkay, 1999). The second strategy consists of first differencing the ADL model (Chirinko, Fazzari and Meyer, 1999). The possibility of firm-specific effects not only on the level of productivity but also on its growth rate may justify this second strategy on panel data. For simplicity, we will only use the second strategy. We leave the possible comparison between the two approaches to companion country papers of the Monetary Transmission Network. First-differencing and using the approximation
log
K
t− log
K
t−1=
I
t/
K
t−1−
δ
, and replacing productivity by time dummies, a firm-specific effect f and a random term ε yields:it it it it it it it it it it it it it it it i it it dummies time uc uc uc uc y y y y K I K I K I f K I
ε
σ
σ
σ
σ
θ
θ
θ
θ
ω
ω
ω
+ + ∆ − ∆ − ∆ − ∆ − ∆ + ∆ + ∆ + ∆ + + + + = − − − − − − − − − − − − − 3 3 2 2 1 1 0 3 3 2 2 1 1 0 4 3 3 3 2 2 2 1 1 1(8)
5Hall, Mairesse and Mulkay (1999) consider an ADL(2,2) but do not include the user cost of capi-tal.
We estimate this equation (8). In addition, to be in line with the literature, we also estimate an extension of equation (8). It has been argued frequently that a measure of liquidity should enter the model to account for access to internal funds that might affect investment in the presence of financing constraints. Liquidity is usually measured as cash flow (CF). For comparison with the existing literature, and to avoid unit problems, cash flow enters relative to the existing capital stock.
it t i I t s t i t i I t s t i t i I t s t i t i I st it it it it it it it it it it it it it it it i it it K p CF K p CF K p CF K p CF dummies time uc uc uc uc y y y y K I K I K I f K I
ε
φ
φ
φ
φ
σ
σ
σ
σ
θ
θ
θ
θ
ω
ω
ω
+ + + + + + ∆ − ∆ − ∆ − ∆ − ∆ + ∆ + ∆ + ∆ + + + + = − − − − − − − − − − − − − − − − − − − − − − − 4 , 3 , 3 , 3 3 , 2 , 2 , 2 2 , 1 , 1 , 1 1 , 0 3 3 2 2 1 1 0 3 3 2 2 1 1 0 4 3 3 3 2 2 2 1 1 1 (9)The parameters
φ
measure the sensitivity of investment with respect to cash flow movements.IV. Data set description
In this section an overview is given of the individual country data used in the regressions. Definitions of the variables used were made as comparable as possible between the different countries. National data sets do differ in many respects. First of all, the way in which data are collected in each country is not the same. The fact that the prerequisites for entering in the sample are different implies that the representativeness of each sample differs across countries. In general, the samples are skewed towards larger firms. Moreover, every sample is unbalanced and differs in the degree in which firms enter and leave the sample.
In Germany, the Bundesbank's corporate balance sheet database constitutes the largest collection of accounting data for German non-financial firms;6 the collection of financial statements originated from the Bundesbank's function of performing credit assessments within the scope of its rediscount operations. On the whole, every year around 70,000 annual accounts were collected, on a strictly confidential basis, by the Bundesbank's branch offices. The German data set is probably skewed towards large firms since, according to the turnover tax statistics, these firms represented roughly 75 per cent
6
A detailed description is contained in Deutsche Bundesbank (1998); see also Friderichs and Sauvé (1999) and Stöss (2001).
of the total turnover of the West German manufacturing sector, albeit only 8 per cent of the total number of firms.
In France, the data source consists of compulsory accounting tax forms7 and of additional information taken from surveys collected by the Banque de France (the database “Centrale des Bilans”'). Since these data are collected only from firms who are willing to provide them, French data are likewise skewed towards large firms.8
Data for Italy are drawn from the Italian Company Accounts Data Service (Centrale dei bilanci), that, considering the whole period 1983-1999 and all non-financial enterprises, contains around 692,000 observations, for around 40,000 firms per year. Also for Italy there exists a bias towards large firms, since firms are not randomly drawn: in fact, the prerequisite for entering the sample is that each firm has to be indebted with a bank; moreover, preference is given to firms with multiple lending relationships.9
The Spanish data were obtained from the Central Balance Sheet Office of the Banco de España (CBBE), and, in particular, from the Annual Central Balance Sheet Da-tabase (CBA); this daDa-tabase is compiled through the voluntary collaboration of non-finan-cial firms and is edited by means of contacts with them. Thus, it only covers those firms that voluntarily complete the questionnaire and is biased towards large and manufacturing firms. The initial database included 115,980 observations corresponding to 22,014 firms over the 1983-1999 period. In 1994, its coverage of the non-financial firms sector, in terms of value added, was around 35 per cent.10
For the econometric analysis, a smaller data set was used in each country. The loss in observations was due to the following reasons. First, we limited the analysis to the manufacturing sector.11 Second, applying the perpetual inventory formula and using investment over lagged capital as a regressor meant dropping the first year-firm observations. Third, trimming and selecting firms which are consecutively present in the sample at least during five years in order to use a sufficient number of lags as explanatory variables led to the final sample in each country.12
7
They are collected by the Banque de France in the database FIBEN.
8
Small firms of less than 20 employees are underrepresented. No statistical sampling procedure has been used to correct this bias.
9
Moreover, since the information collected is meant to be a service for banks in deciding their credit policies, the sample is biased towards firms that are creditworthy.
10
For a more detailed description of this database, see Banco de España (2000).
11
The calculation of the capital stock at replacement cost presumably is more reliable for the manufacturing sector.
12
Some specificities in each country are worth mentioning: for the German sample, which originally contained unincorporated businesses, we have excluded sole proprietorships and unincorporated partnerships because of differences in accounting rules; All publicly-owned enterprises were discarded, too, as they might not be profit-oriented. Again for reasons of comparability, we only consider West German manufacturing firms, and we confine ourselves to the years 1988 - 1997. Earlier years are affected by the radical regulatory changes in accounting introduced in 1985, triggered by an EU directive on the harmonisation of financial statements. In
In general, we ended up with samples that, though skewed towards larger firms, are still representative of the manufacturing sector of each economy. Their coverage, calculated on the total number of employees in the manufacturing sector, ranges from 19 per cent for Spain to somewhat less than 45 per cent for Germany. The corresponding figures for France and Italy are 27 per cent and 21 per cent, respectively. Moreover, very often, balance sheet data only contain large and listed firms, whereas in our sample the median number of employees is 118 in Germany, 31 in Italy, 50 in Spain, and 55 in France. This means also that the data set covers unlisted companies, which are probably the best candidates to test for balance-sheet effects, quite well; listed companies represent less than 4 per cent of the sample in Spain, less than 2 in Italy, and less than 6 in Germany and France. Moreover, firms are spread throughout the sectors of manufacturing13.
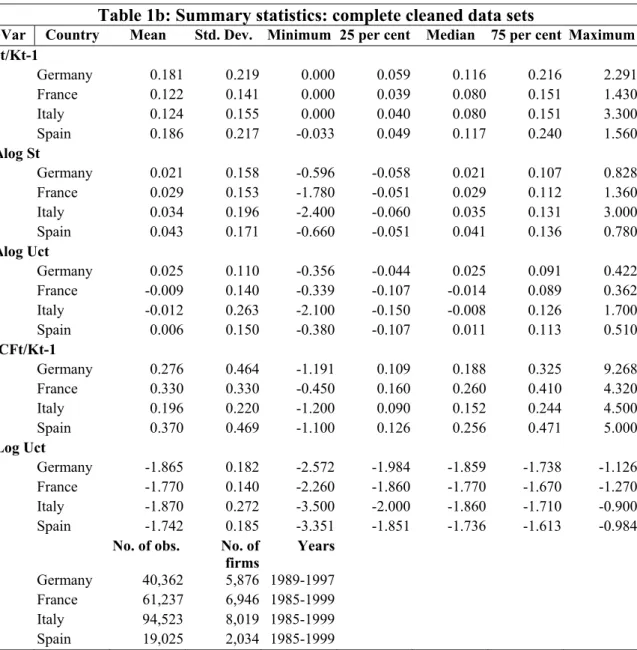
In each country, the period covered by the samples used in estimation is 1985-1999, with the exception of Germany for which the time period available for estimation is 1988-1997. The total number of observations and the number of years available are comparable to or higher than those of the sample used by Chirinko et al. (1999) for US firms.14 For the European samples, coverage, calculated on the total number of employees in the manufacturing sector, ranges from 19 per cent for Spain to 45 per cent for Germany. Table 1b shows the investment-capital ratio, real sales growth, real user cost growth, cash flow on capital, and log of the user cost level in each country. Overall, as is usually the case with panel data, there is a wide dispersion of the variables used in all countries. The mean of the investment capital ratio is higher in Germany (0.181) and Spain (0.186) than in France (0.122) and Italy (0.124). The high mean of the investment capital ratio in Spain is matched by a high average sales growth (0.043). This contrasts with Germany where average sales growth is the lowest of all four countries (0.021). Average user cost growth over the period differs quite substantially across the four countries. In Germany user costs increased on average by 2.5 percent, while in Italy they decreased on average by 1.2 percent. On average, the ratio of cash flow over capital is higher in Spain (0.37) and France (0.33) than in Germany (0.276) and Italy (0.196).
Italy, we discarded the firms for which information to construct the user cost (i.e. fiscal data) was not available.
13
The wider time dimension of these databases makes them preferable to other data sets containing a larger number of firms, which are often available in the countries examined. For example, in Italy the CERVED database contains information on balance sheet and profit and loss accounts of all firms excluding sole proprietorships (roughly 500,000 firms), but the first year available is 1993.
14
They had a sample of 26,071 observations ranging from 1981 to 1991 with a total number of firms of 4,095.
Table 1b: Summary statistics: complete cleaned data sets
Var Country Mean Std. Dev. Minimum 25 per cent Median 75 per cent Maximum It/Kt-1 Germany 0.181 0.219 0.000 0.059 0.116 0.216 2.291 France 0.122 0.141 0.000 0.039 0.080 0.151 1.430 Italy 0.124 0.155 0.000 0.040 0.080 0.151 3.300 Spain 0.186 0.217 -0.033 0.049 0.117 0.240 1.560 ∆log St Germany 0.021 0.158 -0.596 -0.058 0.021 0.107 0.828 France 0.029 0.153 -1.780 -0.051 0.029 0.112 1.360 Italy 0.034 0.196 -2.400 -0.060 0.035 0.131 3.000 Spain 0.043 0.171 -0.660 -0.051 0.041 0.136 0.780 ∆log Uct Germany 0.025 0.110 -0.356 -0.044 0.025 0.091 0.422 France -0.009 0.140 -0.339 -0.107 -0.014 0.089 0.362 Italy -0.012 0.263 -2.100 -0.150 -0.008 0.126 1.700 Spain 0.006 0.150 -0.380 -0.107 0.011 0.113 0.510 CFt/Kt-1 Germany 0.276 0.464 -1.191 0.109 0.188 0.325 9.268 France 0.330 0.330 -0.450 0.160 0.260 0.410 4.320 Italy 0.196 0.220 -1.200 0.090 0.152 0.244 4.500 Spain 0.370 0.469 -1.100 0.126 0.256 0.471 5.000 Log Uct Germany -1.865 0.182 -2.572 -1.984 -1.859 -1.738 -1.126 France -1.770 0.140 -2.260 -1.860 -1.770 -1.670 -1.270 Italy -1.870 0.272 -3.500 -2.000 -1.860 -1.710 -0.900 Spain -1.742 0.185 -3.351 -1.851 -1.736 -1.613 -0.984
No. of obs. No. of firms Years Germany 40,362 5,876 1989-1997 France 61,237 6,946 1985-1999 Italy 94,523 8,019 1985-1999 Spain 19,025 2,034 1985-1999 V. Regression results
In this section we present regression results for the specifications reported in equations (8) and (9). We first present estimation results using the WITHIN estimator. We then present estimation results using the GMM estimator developed by Arellano and Bond (1991).
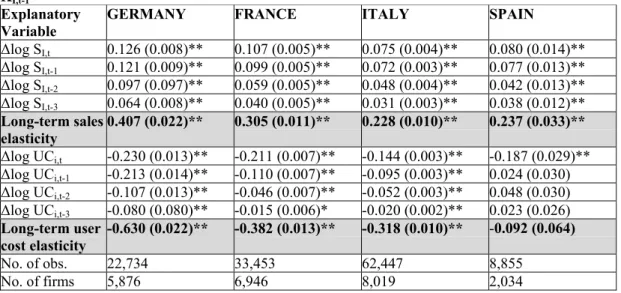
Table 2 reports the results obtained with the WITHIN estimator. We include a full set of time dummies. These will capture the effect of macro influences on firm-specific investment. We dropped the lagged dependent variable for two reasons. First, it is known that the WITHIN estimator is biased with certainty when lagged dependent variables are present (Nickell, 1981). This bias is due to the correlation of the transformed residual with the transformed lagged dependent variable. Second, in this way we can directly compare
our WITHIN estimation results with those obtained for US data by Chirinko, Fazzari and Meyer (1999) using a panel of 4,095 manufacturing and non-manufacturing firms from 1981-91 representing 48 per cent of aggregate US non-residential investment in 1987. (See their Table 2, p. 62, for the WITHIN results.)
For all countries, sales have a substantial effect in the long run on the
capital stock. We obtain long-term sales elasticities ranging from 0.407 in
Germany to 0.228 in Italy. Also for all countries, the contemporaneous effect of
sales is the largest, ranging from 0.126 in Germany to 0.075 in Italy. All lags of
sales growth (up to t-3) have a significant effect on investment. This could be due
to many different reasons, including installation lags or adjustment cost. Chirinko
et al. (1999) found a rather similar long-run sales elasticity of 0.322 with a
contemporaneous effect of 0.120 for the U.S. Note that our specification abstracts
from possible irreversibility of investment. Under irreversibility the sales growth
and the user cost growth could have a non linear effect on investment. For all
countries except Spain, also the user cost has a significant effect on the capital
stock in the long run. We obtain user cost elasticities ranging from –0.63 in
Germany to –0.318 in Italy.
15Chirinko et al. (1999) found a long-run user cost
elasticity of -0.721. In every country (including the U.S.), except for Spain, these
long-term user cost elasticities are even higher than the long-term sales elasticities.
Again, the contemporaneous effect is the largest and past user cost changes are
generally significant. This provides evidence against simple sales-accelerator
models that only include sales and exclude user costs. It is important to note that
even for Spain, although the long-run user cost elasticity (UCE) is not significant,
the contemporaneous user cost effect is clearly negative and significant. Moreover,
in a more parsimonious specification, removing the insignificant lags, the point
estimates of the remaining regressors do not significantly change and the long-run
user cost elasticity is larger, in absolute value, and significant.
Owing to simultaneity between investment and the user cost, the WITHIN estimates might be biased towards zero. This problem, of course, can be generalised to a potential simultaneity between all variables in the regression.
15
The sign and dimension of these two effects are similar to those obtained using specifi-cations with a different lag structure and are similar to those reported in the paper by Gaiotti and Generale (2001) that employ a data set that contains non-manufacturing Italian firms as well.
Table 2: Models of Investment Demand – 3 lags WITHIN estimates, Dependent Variable: II,t/ KI,t-1
Explanatory Variable
GERMANY FRANCE ITALY SPAIN
∆log SI,t 0.126 (0.008)** 0.107 (0.005)** 0.075 (0.004)** 0.080 (0.014)** ∆log SI,t-1 0.121 (0.009)** 0.099 (0.005)** 0.072 (0.003)** 0.077 (0.013)** ∆log SI,t-2 0.097 (0.097)** 0.059 (0.005)** 0.048 (0.004)** 0.042 (0.013)** ∆log SI,t-3 0.064 (0.008)** 0.040 (0.005)** 0.031 (0.003)** 0.038 (0.012)** Long-term sales elasticity 0.407 (0.022)** 0.305 (0.011)** 0.228 (0.010)** 0.237 (0.033)** ∆log UCi,t -0.230 (0.013)** -0.211 (0.007)** -0.144 (0.003)** -0.187 (0.029)** ∆log UCi,t-1 -0.213 (0.014)** -0.110 (0.007)** -0.095 (0.003)** 0.024 (0.030) ∆log UCi,t-2 -0.107 (0.013)** -0.046 (0.007)** -0.052 (0.003)** 0.048 (0.030) ∆log UCi,t-3 -0.080 (0.080)** -0.015 (0.006)* -0.020 (0.002)** 0.023 (0.026) Long-term user cost elasticity -0.630 (0.022)** -0.382 (0.013)** -0.318 (0.010)** -0.092 (0.064) No. of obs. 22,734 33,453 62,447 8,855 No. of firms 5,876 6,946 8,019 2,034
* Significant at the 5 per cent level. ** Significant at the 1 per cent level. Time dummies are included.
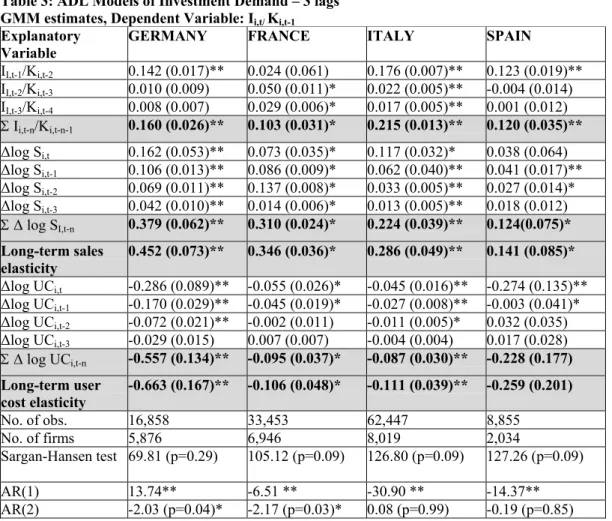
Therefore, we also present the results using the GMM first difference estimator of Arellano-Bond (1991). This time we include the lagged dependent variable. We use as instruments the lagged variables used in the regression from t-2 onwards. The results are in Table 3.
For all countries, with the partial exception of Spain, the long-run sales elasticities are similar to the WITHIN results. The point estimates increase somewhat for Germany, France and Italy, and decrease for Spain, but the effect of sales on capital remains statistically significant. The effect of sales on investment is clearly a robust feature in every country.
What is striking, however, is how the point estimates of the long-run user cost elasticities change when moving to GMM. These differences are non-uniform across countries. The GMM results show a slightly higher point estimate of the long-run user cost elasticity for Germany (-0.663), a dramatically lower one for France (-0.106) and Italy (-0.111) and a dramatically higher one for Spain (-.259).
So far, these are the results obtained by means of a common specification. Before proceeding it is worth mentioning some robustness checks made for each country. Comparison with other results is obtained either by running regressions with a slightly modified set of instruments (results not shown) or by taking stock of the results presented in the companion papers of the Monetary Transmission project.
For Germany, the AR(2) statistics in the specification presented in Table 3 show that there might be an autocorrelation problem in the residuals. It is interesting to note that, using King-Fullerton user costs, von Kalckreuth (2001) obtains a smaller user cost
elasticity of 0.522 for the same model. For France, the significance level of the elasticity of I/K to the user cost turns out to be dependent on the choice of instruments. For Italy, a sensitivity analysis of the results obtained with this specification was conducted by trying different instrument sets. By using a more parsimonious set of instruments, excluding lags 2 and 3 of the user cost, the long-run effect of the user cost is -.234, more similar to the outcome of the WITHIN regression. Moreover, the Sargan test accepts the set of instruments at a higher confidence level. The effect of sales is similar to the one observed in table 3. For Spain, the use of a more parsimonious specification leads again to more precise estimates. When removing insignificant lags, the point estimates of the remaining regressors do not significantly vary and the standard errors for the long-run elasticities are significantly lower. In particular, the point estimate for the long-run sales elasticity is 0.098 with a standard error of 0.039, and the point estimate of the long-run user cost elas-ticity is – 0.273 with a standard error of 0.131.
Table 3: ADL Models of Investment Demand – 3 lags GMM estimates, Dependent Variable: Ii,t/ Ki,t-1 Explanatory
Variable
GERMANY FRANCE ITALY SPAIN
II,t-1/Ki,t-2 0.142 (0.017)** 0.024 (0.061) 0.176 (0.007)** 0.123 (0.019)** II,t-2/Ki,t-3 0.010 (0.009) 0.050 (0.011)* 0.022 (0.005)** -0.004 (0.014) II,t-3/Ki,t-4 0.008 (0.007) 0.029 (0.006)* 0.017 (0.005)** 0.001 (0.012) Σ Ii,t-n/Ki,t-n-1 0.160 (0.026)** 0.103 (0.031)* 0.215 (0.013)** 0.120 (0.035)** ∆log Si,t 0.162 (0.053)** 0.073 (0.035)* 0.117 (0.032)* 0.038 (0.064) ∆log Si,t-1 0.106 (0.013)** 0.086 (0.009)* 0.062 (0.040)** 0.041 (0.017)** ∆log Si,t-2 0.069 (0.011)** 0.137 (0.008)* 0.033 (0.005)** 0.027 (0.014)* ∆log Si,t-3 0.042 (0.010)** 0.014 (0.006)* 0.013 (0.005)** 0.018 (0.012) Σ ∆ log SI,t-n 0.379 (0.062)** 0.310 (0.024)* 0.224 (0.039)** 0.124(0.075)* Long-term sales elasticity 0.452 (0.073)** 0.346 (0.036)* 0.286 (0.049)** 0.141 (0.085)* ∆log UCi,t -0.286 (0.089)** -0.055 (0.026)* -0.045 (0.016)** -0.274 (0.135)** ∆log UCi,t-1 -0.170 (0.029)** -0.045 (0.019)* -0.027 (0.008)** -0.003 (0.041)* ∆log UCi,t-2 -0.072 (0.021)** -0.002 (0.011) -0.011 (0.005)* 0.032 (0.035) ∆log UCi,t-3 -0.029 (0.015) 0.007 (0.007) -0.004 (0.004) 0.017 (0.028) Σ ∆ log UCi,t-n -0.557 (0.134)** -0.095 (0.037)* -0.087 (0.030)** -0.228 (0.177) Long-term user cost elasticity -0.663 (0.167)** -0.106 (0.048)* -0.111 (0.039)** -0.259 (0.201) No. of obs. 16,858 33,453 62,447 8,855 No. of firms 5,876 6,946 8,019 2,034 Sargan-Hansen test 69.81 (p=0.29) 105.12 (p=0.09) 126.80 (p=0.09) 127.26 (p=0.09) AR(1) 13.74** -6.51 ** -30.90 ** -14.37** AR(2) -2.03 (p=0.04)* -2.17 (p=0.03)* 0.08 (p=0.99) -0.19 (p=0.85)
Estimation method: 2-step GMM estimates, including time dummies * Significant at the 5 per cent level. ** Significant at the 1 per cent level.
Instruments: Germany: lags 2 and earlier of I/K, ∆logS and ∆logUC; France: I/K lags 3 to 5; ∆logS lags 2 to 4 and ∆logUC lags 2 to 5 ; Italy: I/K lags 2 to 6; ∆logS and ∆logUC lags 2 to 4.; Spain: lags 2 to 5 of I/K, ∆logS and ∆logUC.
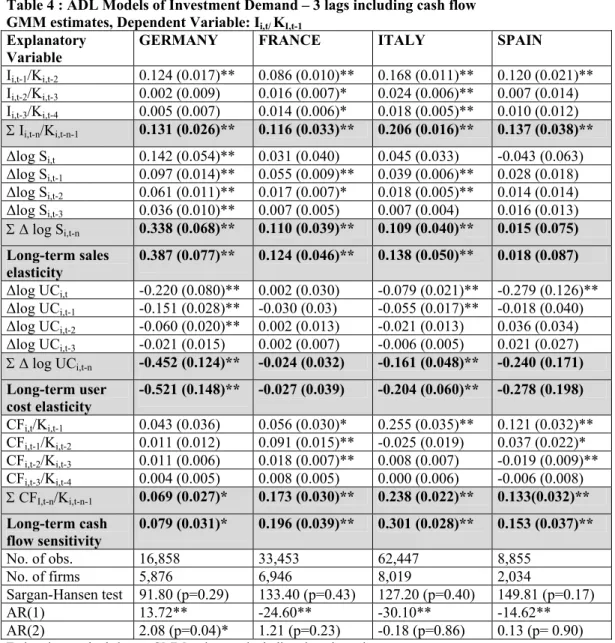
It is important to investigate whether the sales and user cost elasticities are sensitive to adding cash flow to the regression. Since Fazzari, Hubbard and Petersen (1988) it is usual to enter cash flow in the regression to allow for liquidity constraints. The results estimated by GMM are presented in table 4.
As is generally the case in the empirical literature, the cash flow capital ratio enters significantly and with a positive sign. The total effect of cash flow on I/K ranges from a low of 0.079 in Germany to a high of 0.301 in Italy. The higher coefficient with respect to those obtained in the other countries could indicate that firms’ balance-sheet conditions are relatively important in Italy.16 Also, the sales elasticity goes down substantively for all countries. Since cash flow might be a proxy for future profitability and future sales, this result was to be expected. Likewise, in the former regression, the sales variable might have picked up some effects that should really have been attributed to liquidity and profits. The long-run user cost elasticities are different with respect to the former GMM results. They are lower for Germany and Italy if for those countries we compare the results obtained using the same set of instruments; they are close to zero for France and turn out to be higher for Spain.
The change in the long-run user cost elasticity when cash flow is entered into the regression can be explained by how the user cost was constructed. The average interest rate variable used for constructing the user cost of capital is interest payments divided by the amount of debt. This induces a correlation with cash flow, of which interest payments also are an important part.17
Overall, the results in Tables 2, 3 and 4 suggest that sales, user cost and cash flow are all important determinants of investment. That user cost enters significantly in investment regressions is an important result, since it is the prerequisite for an interest-rate channel. The finding that (for most countries) the user cost elasticity varies substantially according to estimation method and specification is less satisfying. (Note that this is also the case for the U.S. in Chirinko, Fazzari and Meyer (1999).) However, given the difficulties encountered in the empirical literature for this kind of estimation, this is not
16
On the other hand, as is well discussed by Bond et al. (1997), a positive effect of cash flow on investment does not necessarily reflect the presence of financial constraints. If higher cash flows are a good predictor of high activity in the future, it may very well be that a positive relationship between investment and cash flow does not reflect the existence of financial constraints. To partially address this criticism, the regression for Italy was re-run using liquidity stock as a measure of firms’ balance-sheet conditions. This variable should be less correlated with expectations of future demand conditions: results (not reported) indicate that liquidity, too, has a positive and significant effect on capital formation; in the regression the sign and significance of sales and the user cost remain unchanged.
17
As noted by Chirinko, Fazzari and Meyer (1999) “in the regression without cash flow the
estimated sum of coefficients of the user cost captures both the conventional substitution effect as well as the income effect induced by financing constraints, which affect investment in the same direction”.
too surprising. In addition one needs to cautiously interpret the user cost elasticities as stemming from pure interest rate effects. Since the firm specific user cost could change with the firm’s risk premia changes over the cycle, part of the user cost change might reflect risk premia changes and hence be ascribed to a balance sheet channel. Adding additional collateral variables besides cash flow to the regression would potentially alleviate this problem.
Table 4 : ADL Models of Investment Demand – 3 lags including cash flow GMM estimates, Dependent Variable: Ii,t/ KI,t-1
Explanatory Variable
GERMANY FRANCE ITALY SPAIN
Ii,t-1/Ki,t-2 0.124 (0.017)** 0.086 (0.010)** 0.168 (0.011)** 0.120 (0.021)** Ii,t-2/Ki,t-3 0.002 (0.009) 0.016 (0.007)* 0.024 (0.006)** 0.007 (0.014) Ii,t-3/Ki,t-4 0.005 (0.007) 0.014 (0.006)* 0.018 (0.005)** 0.010 (0.012) Σ Ii,t-n/Ki,t-n-1 0.131 (0.026)** 0.116 (0.033)** 0.206 (0.016)** 0.137 (0.038)** ∆log Si,t 0.142 (0.054)** 0.031 (0.040) 0.045 (0.033) -0.043 (0.063) ∆log Si,t-1 0.097 (0.014)** 0.055 (0.009)** 0.039 (0.006)** 0.028 (0.018) ∆log Si,t-2 0.061 (0.011)** 0.017 (0.007)* 0.018 (0.005)** 0.014 (0.014) ∆log Si,t-3 0.036 (0.010)** 0.007 (0.005) 0.007 (0.004) 0.016 (0.013) Σ ∆ log Si,t-n 0.338 (0.068)** 0.110 (0.039)** 0.109 (0.040)** 0.015 (0.075) Long-term sales elasticity 0.387 (0.077)** 0.124 (0.046)** 0.138 (0.050)** 0.018 (0.087) ∆log UCi,t -0.220 (0.080)** 0.002 (0.030) -0.079 (0.021)** -0.279 (0.126)** ∆log UCi,t-1 -0.151 (0.028)** -0.030 (0.03) -0.055 (0.017)** -0.018 (0.040) ∆log UCi,t-2 -0.060 (0.020)** 0.002 (0.013) -0.021 (0.013) 0.036 (0.034) ∆log UCi,t-3 -0.021 (0.015) 0.002 (0.007) -0.006 (0.005) 0.021 (0.027) Σ ∆ log UCi,t-n -0.452 (0.124)** -0.024 (0.032) -0.161 (0.048)** -0.240 (0.171) Long-term user cost elasticity -0.521 (0.148)** -0.027 (0.039) -0.204 (0.060)** -0.278 (0.198) CFi,t/Ki,t-1 0.043 (0.036) 0.056 (0.030)* 0.255 (0.035)** 0.121 (0.032)** CFi,t-1/Ki,t-2 0.011 (0.012) 0.091 (0.015)** -0.025 (0.019) 0.037 (0.022)* CFi,t-2/Ki,t-3 0.011 (0.006) 0.018 (0.007)** 0.008 (0.007) -0.019 (0.009)** CFi,t-3/Ki,t-4 0.004 (0.005) 0.008 (0.005) 0.000 (0.006) -0.006 (0.008) Σ CFI,t-n/Ki,t-n-1 0.069 (0.027)* 0.173 (0.030)** 0.238 (0.022)** 0.133(0.032)** Long-term cash flow sensitivity 0.079 (0.031)* 0.196 (0.039)** 0.301 (0.028)** 0.153 (0.037)** No. of obs. 16,858 33,453 62,447 8,855 No. of firms 5,876 6,946 8,019 2,034 Sargan-Hansen test 91.80 (p=0.29) 133.40 (p=0.43) 127.20 (p=0.40) 149.81 (p=0.17) AR(1) 13.72** -24.60** -30.10** -14.62** AR(2) 2.08 (p=0.04)* 1.21 (p=0.23) -0.18 (p=0.86) 0.13 (p= 0.90)
Estimation method: 2-step GMM estimates, including time dummies * Significant at the 5 per cent level. ** Significant at the 1 per cent level.
Instruments: Germany: lags 2 and earlier of all explanatory variables; France: lags 2 to 5 of I/K, CF/K and ∆log S, and lags 3 to 5 of ∆log UC; Spain: lags 2 to 5 of I/K, CF/K and ∆log UC, and lags 2 to 4 of ∆log S; Italy: I/K lags 2 to 6; ∆logS lags 2 to 4; ∆logUC lag 4; CF/K lags 2 to 5.
VI. The broad credit channel in the euro area
In this section we test whether small and large firms show different investment behaviour. We are especially interested in differences in the coefficient estimates of the cash flow capital ratio. By testing whether the long-run effect of the cash flow capital ratio is significantly different for small firms than for large firms, we are able to compare the behaviour of firms that are likely to be characterised by weaker balance sheets with that of other firms.
It is well known that “models that incorporate financial frictions are more
rele-vant for certain types of agents, certain classes of borrowers, and certain sectors of the economy” (Gilchrist and Zakrajsek, 1995). Moreover, as these authors note: “because of the difficulties associated with formulating and estimating true structural models, empiri-cal exercises seeking to establish the validity of either a credit channel or a financial ac-celerator must make comparisons against benchmarks where such credit effects are less likely to be relevant”.
Sample comparisons using size as a discriminating characteristic of the balance-sheet conditions of firms are commonly used in the empirical literature that has examined the link between financial constraints and investment spending (see Schiantarelli, 1995 for a discussion). Smaller firms are more likely to be less collateralised, to be more opaque towards external investors and, insofar as age is correlated with small size, have less es-tablished contacts with lenders, thus making it more difficult to distinguish between good and bad firms. Other characteristics that have been commonly used in these tests are divi-dend payout behaviour, group membership, the nature of the bank-firm relationship, and the degree of ownership concentration. In particular circumstances and in some countries, these characteristics may very well be more important than size. In fact, as Schiantarelli (1995) notes, one problem with splitting the sample along one firm characteristic is that “[this] single indicator may or may not be a sufficient statistic for the existence of liquidity
constraints”.
Analysis of the institutional characteristics that in each country can blur the relevance of the size split is beyond the scope of this paper. In the companion papers that focus on single country evidence, other firm characteristics that might prove relevant for the transmission of monetary policy shocks via the balance sheet are analysed. (See, for example, Chatelain and Tiomo (2001) for France, von Kalckreuth (2001) for Germany, Valderrama (2001) for Austria, Butzen, Fuss and Vermeulen (2001) for Belgium and Gaiotti and Generale (2001) for Italy). We present here only the size split results since these are probably more easily comparable across countries.
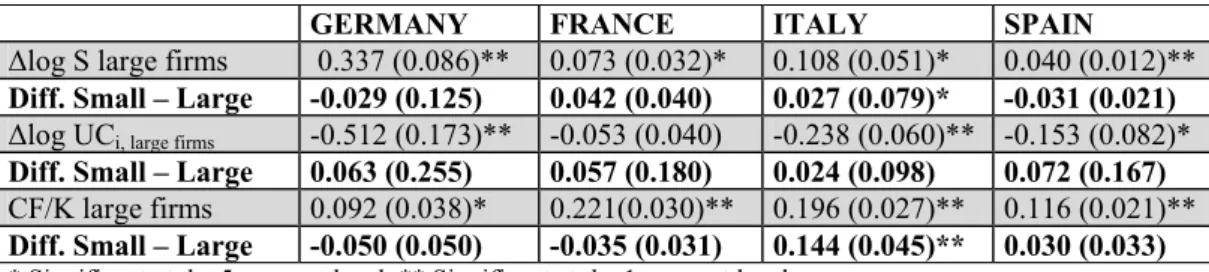
Table 5 : Long-term elasticity of sales and user cost and long-term effect of cash flow on large and small firms. GMM ADL3 with CF
GERMANY FRANCE ITALY SPAIN
∆log S large firms 0.337 (0.086)** 0.073 (0.032)* 0.108 (0.051)* 0.040 (0.012)**
Diff. Small – Large -0.029 (0.125) 0.042 (0.040) 0.027 (0.079)* -0.031 (0.021)
∆log UCi, large firms -0.512 (0.173)** -0.053 (0.040) -0.238 (0.060)** -0.153 (0.082)*
Diff. Small – Large 0.063 (0.255) 0.057 (0.180) 0.024 (0.098) 0.072 (0.167)
CF/K large firms 0.092 (0.038)* 0.221(0.030)** 0.196 (0.027)** 0.116 (0.021)**
Diff. Small – Large -0.050 (0.050) -0.035 (0.031) 0.144 (0.045)** 0.030 (0.033)
* Significant at the 5 per cent level. ** Significant at the 1 per cent level.
Table 5 contains the regression results of equation (9) when allowing for different coefficients for user cost growth, sales growth and the cash flow capital ratio for large and small firms. With the exception of Italy, we find no systematic differences between large and small firms across countries. This is the case for both the sales and user cost elasticities and for the effect of cash flow. The point estimates of the differences in elasticities are non-systematically positive or negative and usually non-significant.
For Italy, the sum of the cash flow coefficients for small firms is significantly higher than for large firms. The fact that balance-sheet conditions are more important for firms that are probably more exposed to problems of information asymmetries seems to confirm the existence of a broad credit channel in Italy. These results seem robust to dif-ferent model specifications, such as the error-correction model estimated in Gaiotti and Generale (2001).
We think however that it would be too early to conclude that the broad credit channel is only operative in Italy. Clearly, more sophisticated sample splits might provide significant differences across firms belonging to different groups. The results in Table 5 do indicate that identifying the broad credit channel by only taking into account the size classification might be an oversimplification in most euro-area countries. Size might not be a sufficient or even correct indicator for some countries of informational asymmetries that are the basis for broad credit channel effects.
Indeed, as already noted above, the companion papers to this research project address the issue of heterogeneity across firms under many other different dimensions. For Germany, when firms’ ratings are used as a proxy of financial constraints, it turns out that those with a lower rating are more sensitive to financial variables (von Kalckreuth, 2001). For France, firms belonging to the equipment goods sector, firms with a lower rating and firms with a high share of trade credit in the balance sheet are also more sensitive to cash flow (Chatelain and Tiomo, 2001). In addition, for France, the introduction of dummy variables which isolate firms that are more sensitive to cash flow has the effect of shifting back the user cost elasticity to its level obtained without cash flow, i.e. a significant value below -0.1. For Italy, firms with a high share of intangible assets over total assets, an
indication of the extent of asymmetric information, respond more to variables that approximate their financial condition (Gaiotti and Generale, 2001). Moreover, results for other countries that we do not analyse by means of a common specification point to the presence of heterogeneity. For Austria, the existence of a “Hausbank” (main bank) signifi-cantly affects the transmission of monetary impulses. Valderrama (2001) finds that firms having closer relationships with the main bank react less to cash flow and more to the user cost than firms with less “intense” relationships. In Luxembourg, younger firms seem more exposed to liquidity constraints, measured by means of various financial ratios (Lünnemann and Mathä, 2001). For Belgium, Butzen, Fuss and Vermeulen (2001) docu-ment a high degree of heterogeneity in firms’ reaction to monetary policy depending on the sectors in which the firms operate.
VII. User cost, cash flow, sales and monetary policy: a simulation exercise18
In this section, we first analyse the dynamics of the regression equation. We then perform a more complicated simulation exercise to determine the elasticity of investment with respect to user cost, sales and cash flow. We finally determine the elasticity of investment with respect to the market interest rate.
We use the point estimates of the coefficients as presented in table 4. In the following, we present the short run time profile of the investment ratio I/K in the presence of simple shocks to the explanatory variables and compare these profiles over the four European countries.
Consider the following experiment. Imagine a firm for which user cost growth, sales growth, CF/K and I/K are all at their steady state path. Next, imagine one single shock at time t to user cost growth, e.g. user cost growth at time t is equal to its steady state path value plus 0.01, and that after time t user cost growth is again at its steady state path. What happens to I/K at time t, t+1, etc., assuming the paths of the other variables i.e.
real sales growth and CF/K are held constant at their steady state path? A similar
experiment can be performed for real sales growth (again holding the other variables at their steady state), or for CF/K.
Note that one could object to this type of analysis on multiple grounds. First, user cost growth, sales growth and CF/K are all endogenous, implying that shocks to one variable might have immediate or lagged effects on the other variables. Basically, the regression equation is just one equation describing I/K. In reality, the behaviour of all
18
We want to thank Daniele Terlizzese for a patient and productive discussion of the issues involved.
relevant variables should be described with a multi-equation system. This, however, is outside the scope of this paper. Second, the regression equation contains the capital stock at both the left-hand side and right-hand side (I/K and CF/K). Since movements in I/K will ultimately move K, CF/K will also change (unless CF moves by the same amount as K). In this first exercise, we also abstract from this second objection (hence implicitly letting CF move at the same rate of K when holding CF/K constant.).
Given the above two objections, we still believe the experiment to be of value. First, it provides a description of the dynamics of the equation concentrating on one variable at a time. Second, more complicated experiments in which shocks to certain variables coincide with (lagged) shocks to other variables are just linear combinations of the above simple experiments. For instance, if one considers a simultaneous shock to sales growth and CF/K, then one can simply add the effects on I/K.
We consider two types of shocks for this experiment. We first consider a shock of 1 per cent (i.e. the explanatory variable at time t has the value of its steady state plus 0.01). It is necessary to see that such a transitory shock to the growth rates of the user costs or sales corresponds to a permanent shock to the level of this variable. We next consider a shock which has a magnitude of one standard deviation of the within-firm variation of the variable. We find this last shock especially appealing because it represents a shock relative to the ‘normal’ variation present in the variable in our data. We indeed find that the within-firm variation of user cost growth, sales growth and CF/K is much larger than 1 per cent and differs substantially across variables and across countries.
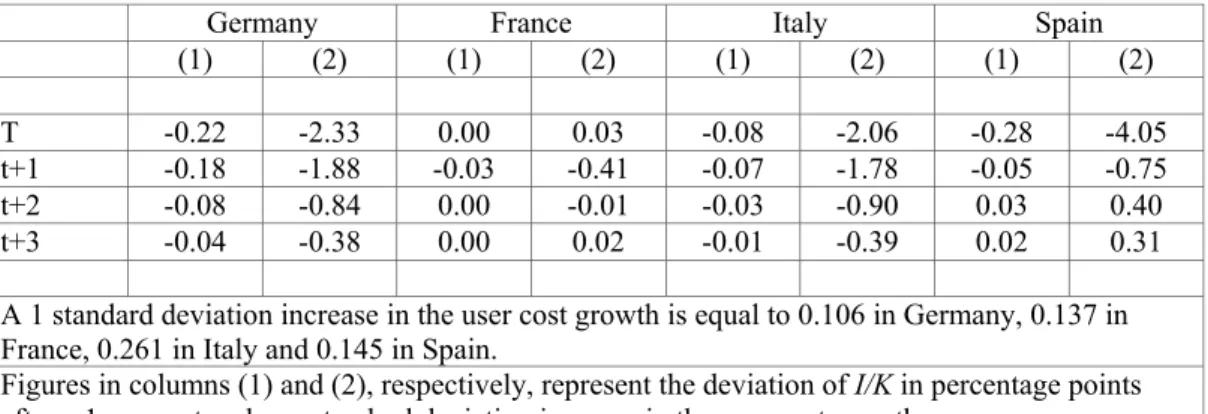
Tables 6.1-6.3 present the deviation of I/K from its steady state path after those two types of shocks, adopting as a benchmark the specification presented in Table 4. Table 6.1 shows the change in I/K after a 1 per cent (column 1) or one standard deviation shock (column 2) in user cost growth. Most of the effects take place within the first two years. A 1 per cent increase in user cost growth has the largest effect in Spain and Germany. Misleadingly, the magnitude of the effect seems small. However, in the data, a one standard deviation change in the user cost growth rate is much larger than 1 per cent; it is 10.6 per cent in Germany, 13.7 per cent in France, 26.1 per cent in Italy and 14.5 per cent in Spain. In the first period, a rise in the user cost growth in Germany of one standard deviation depresses I/K by 2.33 percentage points. Given the level of average gross investment per unit of capital of 0.181 in Germany, this translates into a drop to 0.1577 (i.e. 0.181-0.0233). Similar larger effects can be observed in Italy and Spain. The comparison between columns 1 and 2 reveal some interesting features of the data and the regression result. We can interpret the regression equation as a description of investment behaviour in the period of investigation. Then it is clear that two distinct features have determined this behaviour: the magnitude of the reaction of the I/K ratio to shocks to the
explanatory variables, and the magnitude of those shocks. For instance, whereas the contemporaneous reaction to identical user cost growth shocks in Italy was much smaller than in Germany (as evidenced in column 1), Italian user cost growth shocks were on average much larger than German shocks. Combining those two features implies similar behaviour of the I/K ratio after a one standard deviation shock (as evidenced in column 2). Note that our regressions are conditional on the historical variation in the data. This historical variation could be quite different from future variation.
Table 6.1. Change in I/K after a one-time 1 per cent or one standard deviation increase in the user cost growth at time t
Germany France Italy Spain
(1) (2) (1) (2) (1) (2) (1) (2)
T -0.22 -2.33 0.00 0.03 -0.08 -2.06 -0.28 -4.05
t+1 -0.18 -1.88 -0.03 -0.41 -0.07 -1.78 -0.05 -0.75
t+2 -0.08 -0.84 0.00 -0.01 -0.03 -0.90 0.03 0.40
t+3 -0.04 -0.38 0.00 0.02 -0.01 -0.39 0.02 0.31
A 1 standard deviation increase in the user cost growth is equal to 0.106 in Germany, 0.137 in France, 0.261 in Italy and 0.145 in Spain.
Figures in columns (1) and (2), respectively, represent the deviation of I/K in percentage points after a 1 per cent and one standard deviation increase in the user cost growth.
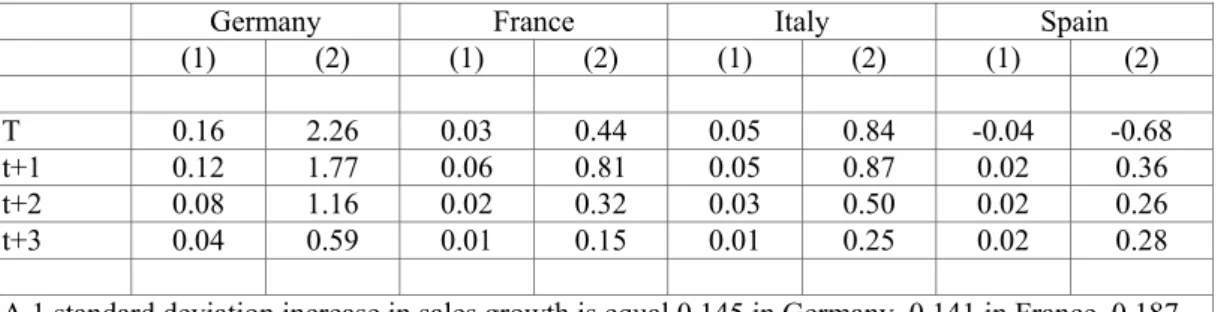
Table 6.2 shows the change in I/K after both a 1 per cent (column 1) or one standard deviation shock (column 2) in sales growth. Again, the largest effects can be observed in the first two years. The sales effect is largest in Germany. A one standard deviation increase in the growth rate of sales increases the investment ratio I/K by 2.26 per cent in the same year.
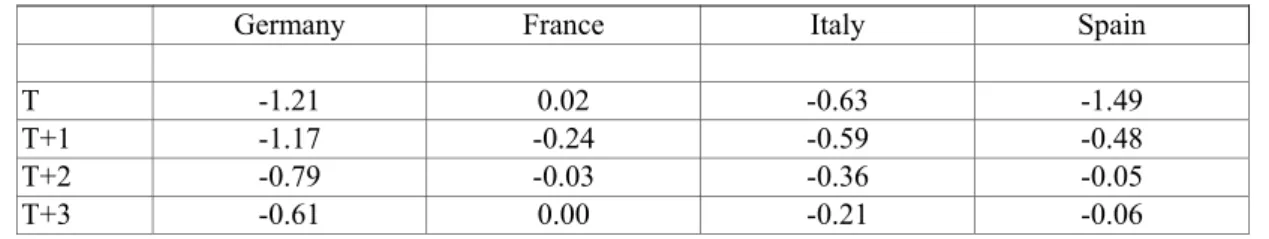
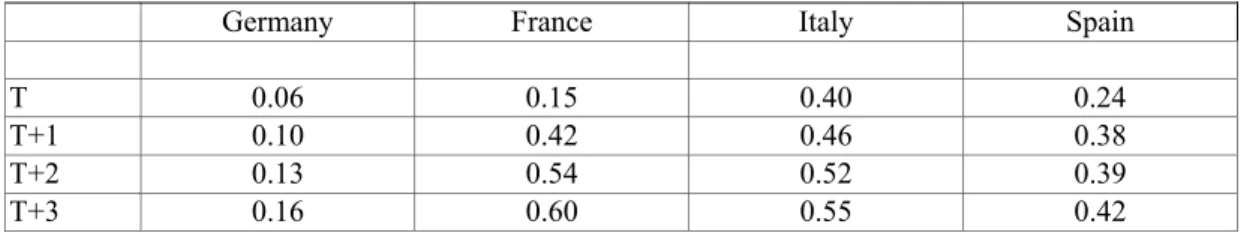
Table 6.3 shows the change in I/K after a 1 per cent (column 1) or one standard deviation shock (column 2) in the CF/K ratio. The contemporaneous effects are quite large. They are the smallest in Germany. Investment in Italian and Spanish firms, in particular, seems to move quite strongly simultaneously with CF/K movements.
Table 6.2. Change in I/K after a one-time 1 per cent or one standard deviation increase in sales growth at time t
Germany France Italy Spain
(1) (2) (1) (2) (1) (2) (1) (2)
T 0.16 2.26 0.03 0.44 0.05 0.84 -0.04 -0.68
t+1 0.12 1.77 0.06 0.81 0.05 0.87 0.02 0.36
t+2 0.08 1.16 0.02 0.32 0.03 0.50 0.02 0.26
t+3 0.04 0.59 0.01 0.15 0.01 0.25 0.02 0.28
A 1 standard deviation increase in sales growth is equal 0.145 in Germany, 0.141 in France, 0.187 in Italy and 0.159 in Spain.
Figures in columns (1) and (2), respectively, represent the deviation of I/K in percentage points after a 1 per cent and one standard deviation increase in sales growth.
Table 6.3. Change in I/K after a one-time 1 per cent or one standard deviation increase in CF/K at time t
Germany France Italy Spain
(1) (2) (1) (2) (1) (2) (1) (2)
T 0.04 1.28 0.06 1.29 0.26 3.90 0.12 3.74
t+1 0.02 0.47 0.10 2.21 0.02 0.27 0.05 1.59
t+2 0.01 0.40 0.03 0.63 0.02 0.26 -0.01 -0.37
t+3 0.01 0.17 0.01 0.29 0.01 0.12 -0.01 -0.18
A 1 standard deviation increase in the cash flow capital ratio is equal to 0.305 in Germany, 0.231 in France, 0.153 in Italy and 0.309 in Spain.
Figures in columns (1) and (2), respectively, represent the deviation of I/K in percentage points after a 1 per cent and one standard deviation increase in the cash flow capital ratio.
The regression equation ‘explains’ I/K in terms of user cost growth, sales growth and the CF/K ratio. However, the reader might find it more natural to think of the level of investment in terms of the level of user cost, sales or cash flow. After some algebra, the regression equation can also be used to calculate the elasticity of investment (I) with respect to the user cost, sales or cash flow. For example, by the elasticity of investment with respect to the user cost, we mean the percentage change of investment (i.e. I, not I/K) due to a ‘permanent’ 1 per cent change (from the base path) in the user cost level. The wording ‘permanent’ is important here. As in the first set of simulations given by the tables 6.1-6.3, a permanent change in the user cost level (from the base path) is given by a one-time 1 per cent change in the growth rate (from the base path) of user costs (see appendix).
Tables 7.1-7.3 provide the elasticity of investment with respect to (the levels of) user cost, sales and cash flow. A substantive elasticity of investment with respect to its user cost is a necessary condition for an interest channel to be operative. As evidenced in