HAL Id: halshs-00423944
https://halshs.archives-ouvertes.fr/halshs-00423944v2
Submitted on 10 Dec 2014
HAL is a multi-disciplinary open access
archive for the deposit and dissemination of
sci-entific research documents, whether they are
pub-lished or not. The documents may come from
L’archive ouverte pluridisciplinaire HAL, est
destinée au dépôt et à la diffusion de documents
scientifiques de niveau recherche, publiés ou non,
émanant des établissements d’enseignement et de
Private vs. Public Sector: Discrimination against
Second-Generation Immigrants in France
Clémence Berson
To cite this version:
Clémence Berson. Private vs. Public Sector: Discrimination against Second-Generation Immigrants
in France. 2009. �halshs-00423944v2�
Documents de Travail du
Centre d’Economie de la Sorbonne
Private vs. Public Sector: Discrimination against
Second-Generation Immigrants in France
Clémence B
ERSON2009.59R
Private vs. Public Sector: Discrimination
against Second-Generation Immigrants in
France
∗
Clémence Berson
PSE, CES, University of Paris 1, 106-112 bd de l’Hôpital 75647 Paris cedex 13 FRANCE E-mail: clemence.berson@univ-paris1.fr
∗I am grateful to Pierre Cahuc, three anonymous referees and the participants in seminars
at the Paris School of Economics and the Ecole Polytechnique for their useful remarks. All errors are my own.
Abstract
The integration of immigrants and their children is a burning issue in France. Governments build a large part of their assimilation policies on the labor mar-ket. The public sector is reputed to better assimilate minorities because of its entrance exams and pay-scales. In this paper, a comparison of the public and private sectors shows that second-generation immigrants are not treated equally. However, the wage gap is determined by the number and gender of immigrant parents and not by the country of origin.
JEL Codes: C35, J31, J45, J71
Keywords: Discrimination, wage gap, public-private sectors, France
Résumé
L’intégration des immigrés et de leurs enfants est un sujet important en France. Les différents gouvernements successifs ont principalement construit leurs poli-tiques d’assimilation sur le marché du travail et l’éducation. Le secteur public est réputé mieux intégrer les minorités en raison des concours d’entrée et des grilles salairales. Dans cet article, une comparaison des secteurs publics et privés montre que les immigrés de seconde génération ne sont pas traités de manière égale. Cependant, le différentiel de salaire est déterminé par le nombre et le sexe des parents de l’immigrés et non par le pays d’origine.
Mots clés : Discrimination, différentiels de salaire, secteurs public/privé, France
1
Introduction
France is traditionally a country of immigration, partly due to its colonial his-tory. The children of immigrants acquire French nationality by birth but real problems in the assimilation of this population are clearly visible, as the events of November 2005 have shown. Riots in the suburbs of big cities and particularly Paris, where many immigrants and their children live, showed up the assimi-lation issues in French society. Since this period, governments have tried to introduce policies to improve assimilation into the school system and the labor market. An administrative authority (Haute Autorité de Lutte contre les Dis-criminations) has been created to encourage equality between citizens and fight discrimination and some evidence has been collected of discrimination against workers of foreign origin in companies’ hiring processes (see notably Duguet et al. (2010)).
In economics, discrimination can be defined as differential treatment between two persons, whose productive characteristics are similar. In the labor market, three main forms are observable. The first appears in the hiring process, the second concerns occupations in the firm and the last is the wage gap between the reference population and the minority. Theoretically, Becker (1957) intro-duced discrimination in the economic field and for the first time this is studied from an economic point of view. Discrimination is assumed to be due to a taste of individuals (employer, worker and consumer) which leads to a higher cost of minority-workers for the employers. This discrimination should disap-pear with competition and time because it depends on profits. A second wave of theories comes from Arrow (1973) and Phelps (1972). In order to model a persistent discrimination, they introduced the concept of statistical discrimina-tion: discrimination is rational in a context of imperfect information due to the ignorance about the average productivity of minority groups. However, discrim-ination tends to disappear by a learning phenomenon of employers or because of self-fulfilling of a lower productivity by minorities. In both cases, imper-fect competition is necessary to perpetuate discrimination. Studies1 show that a negative correlation between competition and discrimination in the private
1See Heywood & Peoples (1994), Ashenfelter & Hannan (1986), Black & Strahan (2001)
sector exists. Nevertheless, the impact of competition in the public sector is not clear. An opposition between a competitive private sector and a non com-petitive public sector intuitively drive to a lower wage gap between majority and minority in the private sector. However, the public sector does not aim at maximizing its profit and competition may have no impact on wages. Existing empirical studies give different results by country and method of estimation. Johnson (1978) found a lower wage gap between Black and White workers in the public sector in the United-States whereas Shackett & Trapani (1987) did not observe differences between both sectors. In order to study the impact of competition on these sectors, Jolliffe & Campos (2005) focused on the economic liberalization in Hungary after the URSS fall. The gender gap decreases dra-matically after 1990. The authors put their results into perspective by the fact that public owned firms are large on average in Hungary and in their sample, the gender gap diminishes in all the large firms.
Nevertheless, there is a rich literature on the comparison of wages between the private and public sectors. Empirical studies usually use wage-decomposition à la Blinder-Oaxaca to identify a public sector premium. But there are many criticisms concerning the choice of independent variables and the specification of the model, which impact the estimates of discrimination. Recent literature estimates switching regression models in order to correct for bias due to the likelihood to work in a specific sector. Indeed it is highly likely that selection between the two sectors is non-random due to different characteristics (for in-stance Dustman & Van Soest (1998) for Germany, Hartog & Oosterbeek (1993) and Van Ophem (1993) for the Netherlands, Van der Gaag & Vijverberg (1988) for Ivory Coast, Fougère & Pouget (2003b) for France and Heitmueller (2006) for Scotland). The conclusions are very dependent on national characteristics. This study combines all these methods to highlight second-generation immi-grants’ situation in France.
Only four papers deal with this subject in France: Bargain & Melly (2008), Beffy & Kamionka (2010), Fougère & Pouget (2003b) and Meurs & Edon (2007). Bargain & Melly (2008) use quantile regressions on panel data to measure the wage gap between both sectors. They find that after controlling for unob-served heterogeneity, only small pay differences between sectors remain. Beffy
& Kamionka (2010) use a job search model and their estimation takes into ac-count selectivity and sector choice biases. The results show that a large public sector pay premium exists for women and for low wages, whereas men of the public sector would earn more in the private sector. Fougère & Pouget (2003b) aim to replicate the characteristics of the French public sector in their model by a tree of choices and try to identify the main determinants of entry into the public sector. The article by Meurs & Edon (2007) focuses on the comparison of public premium across regions. They find that, in spite of the recent devolution of power, the average wage gap does not differ widely throughout the country.
The papers in the recent literature, which focus on the comparison of discrim-ination against minorities in the public and private sectors, essentially concern gender issues. Ethnicity and race are subject to studies mainly in the United Kingdom and in the United States (see Gregory & Borland (1999) p.3616). In France, the public sector is renowned for more equity in wages and hiring, notably concerning gender. The pay differences between men and women are obviously lower in the public sector than in the private one. Studying discrim-ination against another minority in both sectors can illuminate debates on the fairness of the public sector.
Concerning second-generation immigrants, monographs have been written on wage discrimination and the topic is relatively recent. In France, this subject is essentially treated by sociologists due to the lack of census data. Indeed, the law forbids the collecting of data on ethnicity and INSEE, the French National Institute of Statistics, introduced questions about the nationality and the place of birth of parents in their interviews or questionnaires only in 2005. Three recent studies, Aeberhardt et al. (2010), Aeberhardt & Pouget (2007) and Meurs & Pailhé (2010), study the gap between the mean wage of the second-generation immigrants and their French counterpart in France. The former uses a new econometric method to conclude that one third of the wage gap between ’French natives’ (both of whose parents were born in France) and ’African natives’ (both of whose parents were born in an African country) is not explained by differences in observable covariates between the two groups. Then, Aeberhardt & Pouget (2007) conclude that occupational segregation rather than wage discrimination can be observed. Meurs & Pailhé (2010) focus on the likelihood to be employed
for the immigrants descents and, particularly, on the case of women. They compare second generation immigrants from Southern Europe and from North Africa and find than the latter have lower probability to be employed, and women cumulate this with the disadvantages of women in the French labor market. In addition, Belzil & Poinas (2010) estimate a flexible dynamic model of education choices and early career employment outcomes. Their study focuses on people of African origin and shows that schooling attainments explain mainly the differences in access to early career employment stability for this population. The parental background differences explain it to a lesser extent. The differences between French natives and second-generation immigrants in the labor market are partly due to education.
The aim of this paper is to compare discrimination against the second gen-eration immigrants in the public to the case of the private sector, to enhance the theoretical intuition about discrimination and both sectors. No discrimi-nation by origin is pointed out in both sectors. However, the comparison of two different origins highlights the importance of parents’ nationality in labor outcomes. To have a foreign mother decreases wage, as the nationality of the father is more neutral. In order to take into account a non-random distribution of workers in both sectors, a switching model is estimated. Then, the effect of parents is reinforced and results show a larger impact in the private sector than in the public sector.
This paper is organized as follows. Section 2 describes briefly the main characteristics of the French public sector. Data are presented in Section 3 and results in Section 4. Finally, Section 5 concludes.
2
The French public sector
The French public sector is break down in three subsectors: central administra-tion (51.3% in 2002), local government (29.6%) and public health(18.9%). Each subsector has the same hiring process and wage scale and they employ almost one fourth of the working population. 94.8% are public servants and workers with a fixed term contract, 5.6% are subsidized jobs, which are excluded of the study. On the one hand, civil servants are enrolled by a nationwide
competi-tive examination for which a given level of education is required. They have a lifetime contract and promotion is based on seniority or by internal competitive examinations. They cannot be laid off except for misconduct. On the other hand, workers with a fixed term contract are hired by interview like in the pri-vate sector. Their contract could last until three years and could be renewed. They represents 17.8% of the public sector employees in 2002. In both cases, wages are set up by a national wage scale. However, during the 2000s, a larger autonomy was given to the local authorities in hiring and human resources man-agement. For a more detailed description of public sector wages, see Meurs & Edon (2007).
A description of the French public sector has been made by Pouget (2005). He points out differences between public and private sectors. As in this sample, he notes that the skills structure varies across them. The public sector hires more managers, intermediate professionals and white-collar than blue-collar workers, who are more employed by the private sector. Moreover, in the public sector, workers are often over-qualified compared to the level required. This is partly due to the increase in unemployment in the eighties. Indeed, civil servants have a job for life. As Krueger (1988) and, in the French case, Fougère & Pouget (2003b) have observed, the application rate for government jobs increases as the ratio of public to private sector earnings increases or as unemployment rate rises. Consequently, the average quality of applicants in the public sector rises with the number of applicants. Public sector employment seems to attract more women because of its stability but they are often employed in low level or in part time jobs: the public sector is predominantly female apart from manager functions. Moreover, workers in the public sector are older than those in the private sector. Several explanations could be given: first, government budget constraint currently lead the state to hire fewer civil servants to reduce the number of workers in the public sector. As the state offers lifetime employment and then keeps workers whatever their age, the number of older workers is higher. Second, as workers are better qualified in the public sector they arrive later onto the labor market.
Concerning the diversity of the national origin of workers, South European or African natives are under-represented in the public sector. This has been
emphasized by Pouget (2005). He distinguishes workers with one immigrant parent from those with two immigrant parents. The latter are more under-represented in the public sector and, as North African natives tend to have their both immigrant parents, their proportion in this sector is small. There is a tendency for immigrants’ children to have a lower probability of finding a job in the public sector than French natives, even when they have the same age, qualifications and an equivalent father’s profession. These points are addressed in the following sections.
3
Data
The aim of this study is to observe a potential wage gap between natives and sec-ond generation immigrants. Several data bases are available to treat this topic but only the French Labor Force Survey is representative of population, gives information on productivity variables and origin and is a large enough sample to obtain significant results. Data are drawn from the French LFS (Enquête Emploi en Continu) collected by the French National Institute of Statistics, IN-SEE. Each quarter, around 45,000 households are interviewed, which represents roughly 70,000 individuals. All members of a household can be interviewed and carry the same weight in the sample. Only 1/6 of the sample is new each quar-ter and each household is inquar-terviewed six times in order to measure quarquar-terly changes. This survey contains information about education level, occupation, wage, region, industry, employment status, social background and sector of em-ployment.
Individuals’ origin appears only in the most recent versions through ques-tions about parents’ nationality. This is why only data from 2005 to 2010 are used in this paper. Individuals are considered as French second-generation immigrants when they possess French nationality and at least one parent has another nationality. Immigrants from Southern Europe and Maghreb constitute the largest minorities in France and their assimilation into the labor market is very different. Most studies on this subject compare them to find out why the North African immigrants are less assimilated in France than the South European (e.g. Domingues Dos Santos (2005)). Their children represent 72%
of French second-generation immigrants in this sample. Thereafter a ’North African native’ represents a French national with at least one parent who has a North African nationality at birth and is born in these countries. The same vocabulary is used for South European origin. The distinction between an indi-vidual with one or two immigrant parents is important. The sample allows us to introduce a dummy for the gender of the non-French parent in regressions. As we can see in descriptive statistics, North African natives are more likely to have both migrant parents while those of South European origin have the same probability to have only one or both non-French parents. Studies cited previ-ously underline differences between mixed and non-mixed couples on children outcomes. Regressions take into account the gender of the non-French parent in order to observe if one parent has more influence on its child’s later earnings than the other.
The regressions are based on a sample composed of individuals aged between 16 and 60, who are neither in education nor in retirement. The survey contains workers in both the private and public sectors. Self-employed workers are omit-ted because this article focuses on wages. Hourly wages are estimaomit-ted in the following section and are calculated using the weekly hours of a ‘’normal’ week. These wages are net of contributions but not of tax assessment. As the question on wages is only asked in the first and last interviews, data hold only the first declared wage per person during the sample period. However, this information is self-reported and subject to measurement errors, especially for professions with flexible working hours such as managers. It would not be an issue for the measurement of the wage gap between French natives and foreign natives as the measurement error should be the same in both groups. Monthly wages are estimated in robustness checks. Finally, hourly wages are assessed in Euros at 2005 prices.
After reducing the sample, it contains 87,251 French workers and around 11% are of foreign origin. The statistics in Table 1 show that they are more educated and skilled but also older than the French average. The first significant group comes from Southern Europe and accounts for 5.7% of the sample. This wave of immigration mainly came in France between the 1930s and 1960s. The second generation, now French, is lower skilled than the French average and
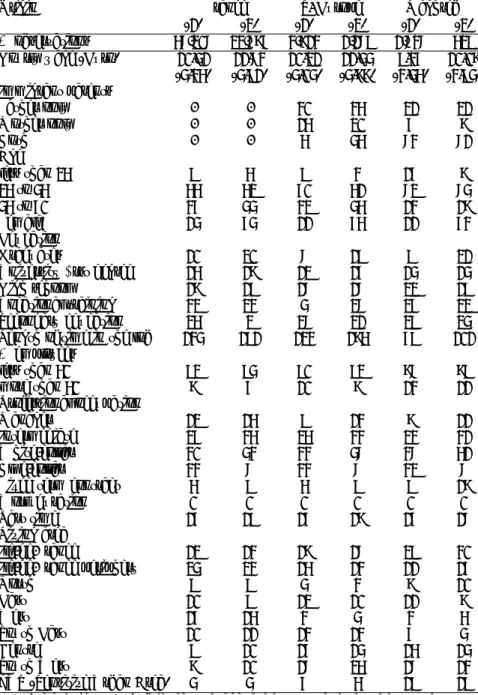
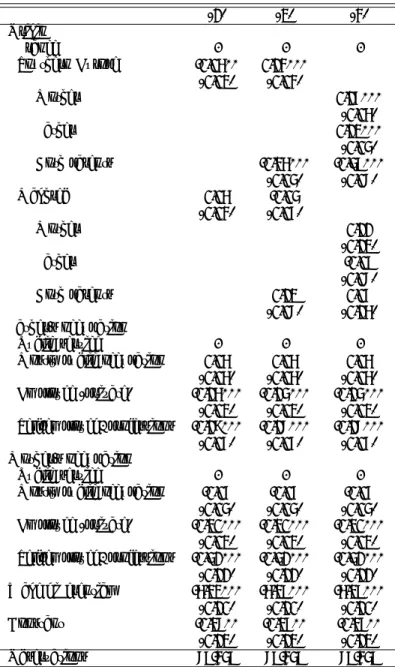
Table 1: Descriptive statistics by origin and sector in percentages
Origin France S. Europe Maghreb
(1) (2) (1) (2) (1) (2)
# observations 57,207 22,786 3,813 1,179 1,737 529
Hourly wage (Euro) 10.41 11.73 10.21 11.44 9.36 10.08
(4.35) (4.91) (4.04) (4.88) (3.45) (3.94) Immigrant parents Father only - - 30 35 21 21 Mother only - - 15 20 6 8 Both - - 5 45 73 71 Age less than 25 9 5 9 3 16 8 25 to 45 55 52 60 51 72 74 45 to 60 36 44 32 45 13 18 Female 14 64 11 65 11 63 Education Graduates 10 20 7 19 9 21
University first degree 15 18 12 16 14 14
High school 18 19 17 17 22 19
Vocational training 32 23 4 27 26 22
Secondary education 25 2 27 21 29 24
Length of time in the job 134 191 123 185 69 101
# employees less than 50 92 94 90 92 87 89 more than 50 8 6 10 8 13 11 Professional occupation Manager 12 15 9 13 8 11 Intermediate 26 35 25 33 23 31 White-collar 30 43 33 47 37 51 Blue-collar 33 7 33 7 32 7
Fixed term contract 5 9 5 9 9 18
Work duration 0 0 0 0 0 0 Part time 16 19 16 18 16 17 Living area Ile-de-France 12 13 18 17 29 30 Ile-de-France periphery 24 23 15 13 11 16 North 9 9 4 3 8 10 East 10 9 12 10 11 8 West 16 15 3 4 3 5 South East 10 11 13 13 6 4 Centre 9 10 16 14 15 14 South West 8 10 17 25 17 13
ZUS (Sensitive Urban Area) 4 4 6 5 19 19
(1) Private sector (2) Public sector. Wages are in Euros and tenure in months. Source: Enquête Emploi en Continu survey, INSEE, Paris, 2006.
they are more likely to work in the private sector. The second group comes from Maghreb and they account for 2.6% of the sample. This wave of immigration is more recent and is made up of Algerian, for the bigger part, Tunisian and Moroccan. Their parents arrived at the time of decolonization or later from ex-colonies in Northern Africa. French was a compulsory subject at school and most of them speak French. Africa is now the biggest source of immigrants in France. This group is younger and has more children. More than 30% live in Paris and its suburbs and another 30% in other big cities. They work more in the private than in the public sector.
The public sector includes state, local government and public hospital em-ployees and it represents 28% of the working population. The private sector in-cludes private firms, non-profit associations publicly-owned and national firms. National publicly-owned firms represent 24% of the private sector and have been added because of their profit maximization management. Indeed, the way of management is relatively similar to the private sector and classical theory of discrimination applies. The public sector is slightly over-represented as it represented only 21% of the working population in France on December 31st, 2006. 49% of this population worked at state level, 32% for the local public sector and 19% in public hospitals. The sample seems to be representative as the figures are 49%, 34% and 17% for each public subsector, respectively. In our sample, only 12% of workers of the public sector are not civil servants, which is representative of French natives too. Concerning South European natives, 14% of them have a fixed term contract, whereas this is the case for 19% of African natives. These figures are relatively similar to the description of Pouget (2005).
4
Methods and results
Empirical evidence of differences in treatment toward workers because of non-productive characteristics, such as physical criteria for instance, is established through several methods. The more usual is to evaluate the wage gap between the population which can be discriminated against and the witness popula-tion. Here the witness population is the French natives and the potentially discriminated-against population is made up of the other natives. As all
indi-viduals are not spread identically between both sectors, an estimation of the probability of working in each sector is necessary to correct the induced bias. First, the wage gap is evaluated at different levels, and second, attention is fo-cused on selection issues. Then a switching model is estimated in order to take this bias into account in the wage-equation.
4.1
Wage gap
In order to measure the wage gap due to individuals’ origin, a wage-equation is estimated. The explanatory variables comprise a dummy controlling for origin and all variables are interacted with a sector dummy in order to identify a differ-ential due to origin in both sectors. Thereby, it is possible to take into account separately the effects of origin in each sector and to compare the coefficients. Let wi be the log hourly wage. The log wage-equation to be estimated is:
ln(wi) = pubi.(Xi0 β + origi βo) + ui (1)
where X is the vector of characteristics, pub a dummy variable for the public sector, u an error term and i is an individual index.
Each estimation is controlled for position attributes such as qualification, working time (full-time versus part-time), tenure and employment contract. As the public sector is made up of three different categories (state, hospital and local government), which have different wage policies, a dummy controlled for each type of public employment. Concerning individual characteristics, age (quadratic function), education, gender and housing location are added in the regression. Moreover, having only one parent has a lower impact on labor out-comes. The second regression uses a variable related to the number of immigrant parents. In order to verify if both parents have the same effect on wages, a vari-able concerning which parent does not have the French nationality is used as an alternative to the country of origin. The reference group is the French natives working in the private sector.
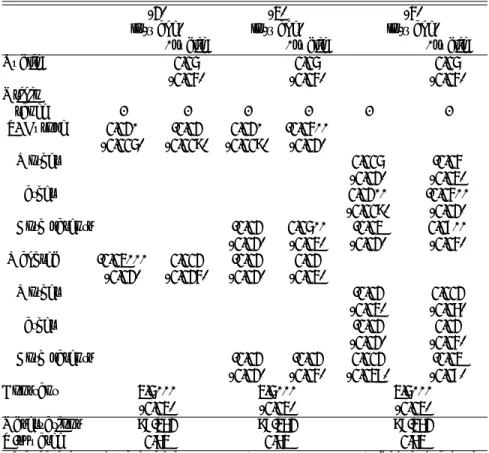
Table 2 summarizes the results of the estimation of log wage-equation when a dummy controlling for the sector (public or private) is interacted with all the
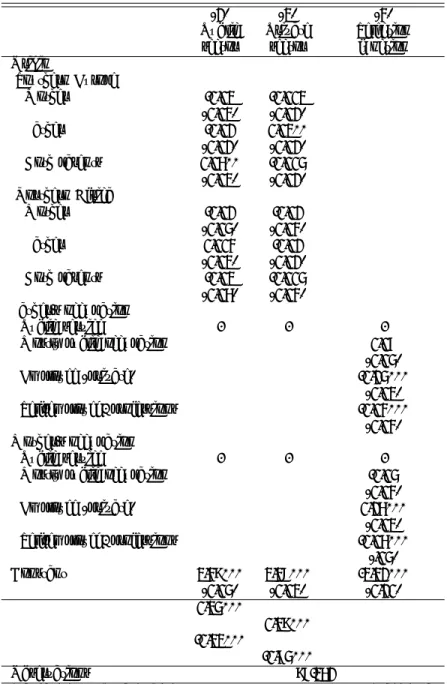
Table 2: Public and private sector log wage-equation
(1) (2) (3)
ln(wage) ln(wage) ln(wage)
*public *public *public
Public 0.04 0.04 0.04 (0.03) (0.03) (0.03) Origin France - - - -S. Europe 0.01* -0.01 0.01* -0.03** (0.004) (0.008) (0.008) (0.01) Mother 0.004 -0.03 (0.01) (0.02) Father 0.01** -0.03** (0.008) (0.01) Both parents -0.01 0.04** -0.02 0.06** (0.01) (0.02) (0.01) (0.03) Maghreb -0.02*** 0.001 -0.01 0.01 (0.01) (0.013) (0.01) (0.02) Mother -0.01 0.001 (0.02) (0.05) Father -0.01 0.01 (0.01) (0.03) Both parents -0.01 -0.01 0.001 -0.02 (0.01) (0.03) (0.029) (0.06) Constant 2.4*** 2.4*** 2.4*** (0.02) (0.02) (0.02) Observations 87,251 87,251 87,251 R-squared 0.52 0.52 0.52
Standard errors in parentheses, *** p<0.01, ** p<0.05, * p<0.1. This estimation is controlled for public sector category, qualification, working time, tenure, employment contract, age (linear and quadratic), education, gender, housing location and years.
variables of the equation. The first estimation, noted (1) in the table, uses a dummy controlling for the country of origin. A difference of 0.04 is observable between log wages in favor of the public sector. This coefficient is not significant and conforms to the literature on France, where no uniform results exist on a premium in favor of one sector. However, this premium depends on categories of workers. Looking for the origin of workers, North African natives earn 2% less than French natives and, on the contrary, South European natives receive 1% more than the reference population. The difference between both sectors is not significantly different from zero. The presence of a pay-difference in the public sector seems astonishing because of wage scales. But the coefficient takes
into account all the variables of the regressions. It means that between a foreign native with all the same controlled characteristics than as a French native, a difference of x% is observable on average. For instance, the fact that North African natives are, on average, more in a fixed term contract contributes to this differential.
A simple dummy on origin shows a wage gap with French natives. However, having only one foreign parent changes labor market outcomes, compared to individuals with both foreign parents, and studies show that no significant gap with French natives is observable when one parent has French nationality. Col-umn (2) does not confirm this assertion. North African natives have no more any wage gap with French natives. However, the wage gap in favor of South European natives persists in the private sector without any impact of the num-ber of foreign parents and a significant difference appears between French and South European natives in the public sector. Having a South European parent induces a gap of 3% between the private and the public sector. However, hav-ing both South European parents increases wages by 4% in the public sector in comparison with the private sector.
Brugeilles & Sebille (2009) study the French behavior of households concern-ing children education. They show that the mother takes care alone of children homework in more than 60% cases and shares it with the father in 30% cases, in France in 2005. She is predominant in the scholar education of children. This study can explain that a relationship exists between abilities at work and an education with foreign habits. Indeed, consequences on language and behav-ior can be observed, which could induce a lower wage. However, father gives its name to its children, which is a clear indicator of origin for employers and could induce discrimination. When a dummy on the non-French parents re-places the country of origin in the regression, column (3) shows that previous results are due to the father’s nationality in both sectors. As results are similar in columns (2) and (3), the specification used afterwards only take into account for mixed/non-mixed couples.
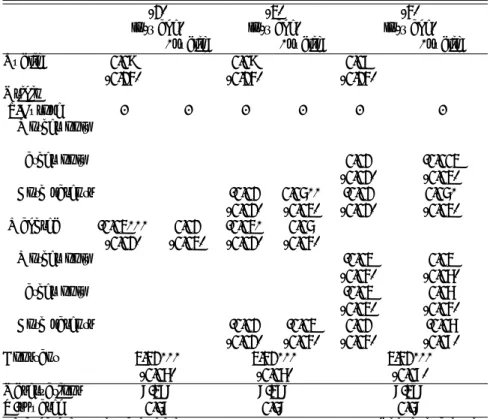
Table 3 summarizes results when the sample only contains second generation immigrants, in order to compare both origins. Results are similar to the previous one. It is worth to notice that a significant wage gap exists between South
European and North African natives in the private sector. Coefficient is no more significant in the third column, but it is certainly due to the small number of observation by cells.
Table 3: Public and private sector log wage-equation of second generation im-migrants
(1) (2) (3)
ln(wage) ln(wage) ln(wage)
*public *public *public
Public 0.08 0.08 0.09 (0.13) (0.13) (0.13) Origin S.Europe - - - -Mother only Father only 0.01 -0.002 (0.01) (0.02) Both parents -0.01 0.04** -0.01 0.04* (0.01) (0.02) (0.01) (0.02) Maghreb -0.02*** 0.01 -0.02* 0.04 (0.01) (0.02) (0.01) (0.03) Mother only -0.02 0.02 (0.03) (0.05) Father only -0.02 0.05 (0.02) (0.03) Both parents -0.01 -0.02 0.01 -0.05 (0.01) (0.03) (0.03) (0.06) Constant 2.31*** 2.31*** 2.31*** (0.05) (0.05) (0.06) Observations 7,267 7,267 7,267 R-squared 0.46 0.47 0.47
Standard errors in parentheses, *** p<0.01, ** p<0.05, * p<0.1. This estimation is controlled for public sector category, qualification, working time, tenure, employment contract, age (linear and quadratic), education, gender, housing location and years.
In order to observe a particular effect of origin on the other variables, the dummies of origin and sector are interacted with all the other explanatory vari-ables. Table 4 sums up the results. The coefficients of individual characteristics may depend on origin in that certain institutions may tend to equalize wages between the origins and thus act to offset the discriminatory impact of the term of origin. Allowing returns to vary by origin leads to higher gaps between French natives and North African natives in the public sector as a wage gap of 0.40 in
Table 4: Public and private sector log wage-equations by origin.
(1) (2)
Private sector Public sector
*S.Europe *Maghreb *S.Europe *Maghreb
Origin -0.11 -0.09 0.10 -0.40* (0.07) (0.11) (0.15) (0.22) Non-mixed -0.004 -0.01 0.07** -0.04 couple (0.02) (0.01) (0.02) (0.02) Age 0.02*** 0.003 -0.0004 0.01*** -0.005 0.02* (0.001) (0.003) (0.01) (0.002) (0.008) (0.01) Age squared -0.02*** -0.003 -0.0004 -0.02*** 0.01 -0.03 *100 (0.001) (0.004) (0.01) (0.002) (0.01) (0.02) Women -0.11*** -0.03** 0.03* -0.06*** -0.01 0.005 (0.003) (0.01) (0.01) (0.004) (0.0175) (0.02) Education Graduate - - - -University -0.05*** 0.02 -0.01 -0.08*** 0.05* 0.07* 1st degree (0.005) (0.02) (0.03) (0.006) (0.03) (0.04) High school -0.12*** 0.002 -0.01 -0.16*** 0.06** 0.05 (0.005) (0.02) (0.03) (0.006) (0.03) (0.04) Vocational -0.18*** -0.005 -0.01 -0.23*** 0.06** 0.04 training (0.005) (0.02) (0.03) (0.01) (0.03) (0.04) Secondary -0.22*** 0.01 0.01 -0.27*** 0.04 0.09** education (0.005) (0.02) (0.03) (0.01) (0.03) (0.04) Occupation Manager - - - -Intermediate -0.29*** 0.06*** 0.01 -0.24*** -0.04 -0.04 (0.004) (0.02) (0.03) (0.01) (0.03) (0.04) White-collar -0.48*** 0.05*** 0.05** -0.43*** -0.06** 0.03 (0.004) (0.02) (0.03) (0.01) (0.03) (0.05) Blue-collar -0.47*** 0.06*** 0.07*** -0.47*** -0.01 -0.02 (0.004) (0.02) (0.03) (0.01) (0.04) (0.06) Length of time 0.001*** 0.00002 0.0001 0.001*** -0.0004 -0.001* in the Job (0.00003) (0.0001) (0.0002) (0.0001) (0.0002) (0.0004) Fixed term -0.06*** 0.02 0.03 -0.11*** 0.02 0.01 contract (0.005) (0.02) (0.03) (0.01) (0.03) (0.03) Part time -0.02*** -0.01 -0.01 0.004 0.02 -0.02 (0.003) (0.01) (0.02) (0.004) (0.02) (0.03) More than -0.07*** 0.04** 0.03 -0.03*** -0.02 0.03 50 employees (0.004) (0.01) (0.03) (0.01) (0.03) (0.04) Pulic subsectors Manager - - - -Local public 0.004 0.01 0.02 sector (0.004) (0.07) (0.02) Publics -0.04*** -0.04 -0.04 hospitals (0.01) (0.04) (0.06) Constant 2.42*** 2.43*** (0.02) (0.03) Observations 62,757 24,494
favor of French natives is observed. On the contrary, this coefficient is positive for South European natives, but not significant. In the private sector, this gap remains negative and not significantly different from zero for foreign natives. It is worth to notice that the constant does not represent a basic salary in our case. The individual characteristics do not explain the wages of North African natives as well as those of the French natives. This leads to a higher intercept term. Moreover, roughly 30% of North African natives earn the minimum wage compared to 14% of the French natives. The minimum wage form a mass point at the beginning of the wage distribution and it decreases the fit of the wage-decomposition by individual characteristics. This phenomenon under-estimate the wage gap as wages cannot be lower than this minimum.
The variables of Table 4 give interesting information on the impact of indi-vidual characteristics for the different groups. The gender gap increases in the case of Southern European natives in the private sector whereas it decreases for North African natives. The coefficient associated to age is significantly higher for North African natives than French natives in the public sector. However, tenure is negative, which suggest that discrimination could occur by a glass ceiling effect or a low evolution of occupations. The returns on education are similar whatever origin in the private sector. In the public sector, returns are higher for South European natives whereas returns are only positive for highly and low educated North African natives. Concerning occupations, second gener-ation immigrant workers have a positive gap with French natives in the private sector whereas coefficients are not significant in the public sector, except 6% less for white-collars.
With a view to complete this study, the wage gap is decomposed in two com-ponents by the Blinder-Oaxaca method: the first part results from differences in observable characteristics of individuals and the second one cannot be explained from the model and is often interpreted as resulting from discrimination.
¯
ln(wC) −ln(w¯T) = ( ¯XC− ¯XT)β∗+ [( ˆβC− β∗) ¯XC+ (β∗− ˆβT) ¯XT] (2)
group and T for the tested group. In each sector, a first estimation compares French natives (C) and second generation immigrants (T ) and, then, each origin is tested.
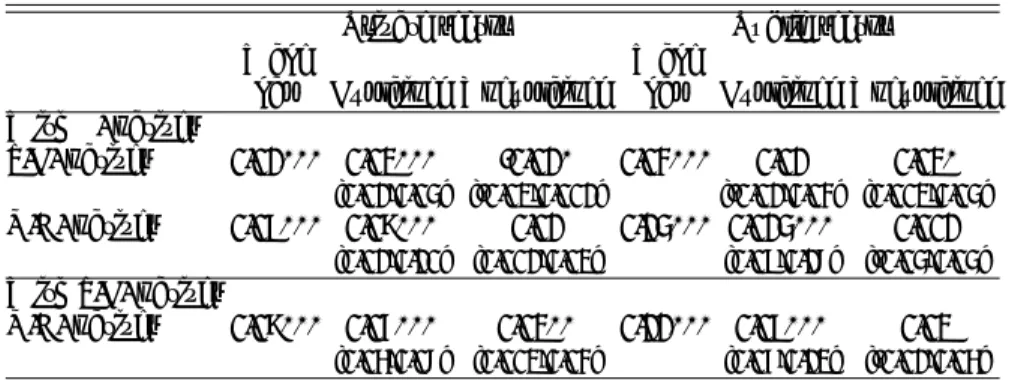
Table 5: Blinder-Oaxaca decompositions
Private sector Public sector
Wage Wage
gap Explained Unexplained gap Explained Unexplained With F. natives
S.E. natives 0.01*** 0.02*** -0.01* 0.03*** 0.01 0.02*
[0.01;0.04] [-0.02;0.001] [-0.01;0.03] [0.002;0.04]
N.A. natives 0.09*** 0.08*** 0.01 0.14*** 0.014*** 0.001
[0.01;0.10] [0.001;0.02] [0.09;0.17] [-0.04;0.04]
With S.E. natives
N.A. natives 0.08*** 0.06*** 0.02** 0.11*** 0.09*** 0.02
[0.05;0.07] [0.002;0.03] [0.06;0.12] [-0.01;0.05]
Table 5 reports the results of Blinder-Oaxaca decomposition of wages. Al-most all the wage gap is explained by differences in endowments between major-ity and second generation immigrants. An unexplained wage gap of 1 percentage point is observable between French and South European natives, in favor of the last ones, in the private sector and a negative one of 2 percentage points in the public sector. North African natives’ characteristics entirely explain the wage gap with French natives in both sectors. The third line compares North African and South European natives in order to observe any differences between both groups. Three fourth of the wage differential is explained by differences in ob-servable charactersistics in the private sector. However, the last fourth remains unexplained. On the contrary, the wage gap in the public sector is entirely explained by endowments.
4.2
Selection issue
Economic discrimination can be present upstream from earnings and particu-larly during the hiring process. Workers have to choose between public and pri-vate sectors. The hiring process is different and French natives and non-French natives can be treated differently in the two sectors. This section describes this bias and simply evaluates it. As can be observed, individuals apply in different
ways if they want to work in the private or in the public sector. In the first case, there is free entry, with matching between employers and applicants. In the sec-ond case, a majority is hired by examination results and the remainder through the market. Consequently we cannot consider that the assignment between both sectors is random and a selection bias exists in the sector choice. The following sector employment-equation (3) is introduced to confirm this assertion.
S∗i = B0iδ + origi δo+ νi (3)
where S∗ is a latent variable, B the vector of characteristics, δo the coefficient
to be estimated and ν the error term for participation.
The latent variable is not observable and an index-function is used:
Si= 1 if S∗i > 0
Si= 0 if S∗i ≤ 0
where Si = 1 and Si = 0 indicate private sector employment and public sector
employment respectively. The error term of the sector selection equation is normally distributed with mean 0 and variance σν.
The explanatory variables are individual characteristics used in the wage equation: age, education, gender, housing location. Moreover, a variable con-cerning the individual’s expected wage gain from public employment is relevant to the probability of working in the private or in the public sector. This vari-able is the differential between the expected wage in the public sector and the expected wage in the private sector, calculated in the first estimation of Sec-tion 4.1 with the observable characteristics of each worker. It assumes that individuals behave rationally by comparing the potential wage in both sectors before deciding to work in one of them. The individual’s social background completes the explanation of the probability of working in the private or in the public sector. Social background characteristics are supposed to affect only the sector selection and not wages. In the literature several variables are used as the education attainment of the parents, the father’s socio-professional group,
the mother’s working status or the siblings (see Dustman & Van Soest (1998), Hartog & Oosterbeek (1993)). In this study, the mother’s and the father’s socio-professional groups are available and are sufficiently detailed to know if their job is in the public or in the private sectors. The importance of the type of occupa-tion is highlighted by Fougère & Pouget (2003a) in their study of the economic determinants of the likelihood to work in the public sector. The father’s type of occupation particularly influences the likelihood to work in the public sector. Indeed, children of civil servants are over-represented in the public sector. Fur-thermore, Pouget (2005) shows that children of civil servants are studying longer than the average and the workers hired in the public sector are more qualified than those of the private sector. Their knowledge of public sector mechanisms gives them the opportunity to better prepare the exams. This last piece of infor-mation is important and suggests it could be used to identify sector employment. This variable is added into the probit equation and is compressed into four cat-egories. The first one contains individuals clearly identified as civil servants’ children. The second one contains occupations mostly represented in the public sector, as some education or health jobs. This is a different category as some workers of the private sector cannot be identified in this category. The third one brings together employees of the private sector whereas independent work-ers and professions are in the fourth one. Beyond, parents’ socio-professional categories are used in control (farmers, self-employed, intermediate professions, white-collars, blue-collars, retired and non-working individuals).
As in the previous part, the first estimation uses the country of origin, the second one the number of foreign parents and the last one interacts gender of parents and country of origin. Results are summarized in Table 6. First, the wage differential has a strong positive and significant impact on the likelihood to work in the public sector. It bears out that the distribution of workers in both sectors is not random. Characteristics of workers of the public sector are better fitted with the method of remuneration in this sector. This observation justifies the following part aiming at endogenizing this repartition. Second, the type of job of parents has a significant impact on the probability to work in one sector. In accordance with previous studies on the French public sector, children of civil servant are more likely to work in it. Coefficients of ambiguous
Table 6: Probability of working in the public sector (1) (2) (3) Origin France - - -Southern Europe -0.05** 0.13*** (0.02) (0.03) Mother 0.16*** (0.05) Father 0.12*** (0.04) Both parents -0.35*** -0.49*** (0.04) (0.07) Maghreb 0.05 -0.04 (0.03) (0.06) Mother 0.11 (0.12) Father -0.09 (0.07) Both parents 0.12 0.06 (0.07) (0.15) Father’s occupation Public service - -
-Mostly public occupation 0.05 0.05 0.05
(0.05) (0.05) (0.05) Employee (private) -0.15*** -0.14*** -0.14*** (0.02) (0.02) (0.02) Self-employed, professions -0.18*** -0.17*** -0.17*** (0.06) (0.06) (0.06) Mother’s occupation Public service - -
-Mostly public occupation -0.06 -0.06 -0.06
(0.04) (0.04) (0.04) Employee (private) -0.20*** -0.20*** -0.20*** (0.02) (0.02) (0.02) Self-employed, professions -0.41*** -0.41*** -0.41*** (0.11) (0.11) (0.11) Wage differential -5.22*** -5.29*** -5.29*** (0.10) (0.10) (0.10) Constant -0.27** -0.26** -0.26** (0.12) (0.12) (0.12) Observations 79,349 79,349 79,349
Standard errors in parentheses, *** p<0.01, ** p<0.05, * p<0.1. These estimations are controlled for age, education, gender, housing location and years.
jobs (professors, nurses...) are not significant. Furthermore, the effect is similar concerning mother and father.
In estimation (1), South European natives have a lower probability of 2% to work in the public sector. The coefficient associated to North African natives is not significantly different from 0. Introducing a dummy for mixed couples, (column (2)), shows that this result is heterogeneous: the likelihood of working in the public sector for workers with both South European parents is lower by 14 percentage points than French natives. If one of her parents is French, this gap is positive and is worth 5%. Column (3) shows that gender of the immigrant parent has no significant influence on the choice of the sector.
To conclude, only South European natives have a higher likelihood to work in the private sector. This effect is particularly strong when both parents are immigrants. The effect of the wage differential in the probit equation leads to estimate the wage gap taking selection into account.
4.3
Switching model
Previous section shows that assignment to a sector is not random and biases wage estimation of Section 4.1. A model of endogenous switching regression is adapted to this case as it takes into account the sector choice bias and the simultaneity of wage equations and sector selection function. This model was described by Lee (1978) and was applied to sector choice by Hartog & Ooster-beek (1993). Individuals are sorted over different states by a switching equation. In our case, they work in the public or in the private sector. The observed wage rate depends on the worker’s status, i.e. we observe:
ln(w1i) = Xi0 β1+ origiβ1o+ u1i, (4)
ln(w2i) = Xi0 β2+ origiβ2o+ u2i, (5)
where S, wji, Xi, Bi, βj and δi are already defined in previous parts, j = 1
if individual i works in the public sector and j = 2 if she works in the private sector. Thus we have a simultaneous equations model involving qualitative limited dependent variables. Equation (6) is the switching function and takes up the sector choice equation. Equations (4) and (5) are the sector specific wage equations defined in the previous part. In order to identify γ, some variables have to be excluded from the wage equation. Variables allow identifying the switching coefficients are dummies on the nature (public or private) of parents’ occupations. As argued in previous section, these variables influence individual’s choice of the sector of employment, but do not affect the wages. This link is well documented in the French literature on the public sector and, in this study, this variable is strongly correlated to sector choice. Moreover, wages are really sensitive to parents’ occupations but only few related to their sector. Parents’ sector is not significant in wage equation and correlation with wages is less than 0.2.
As previous results show that using a dummy on mixed and non-mixed couples is more pertinent, this part focuses on the number of immigrant parents. Table 7 presents estimation results of the switching model. The first two columns show the coefficients for wage equations and the third column contains the estimates for the switching equation. This regression confirms the impact of South European origin. Having both immigrant parents increases wage of the private sector by 3 percentage points compared to French natives whereas only one immigrant parent has only an impact in the public sector. In both cases, the wage gap is in favor of second generation immigrants. This result shows that the sector selection has an important role in wage gap between French natives and others. Taking into account the selection process shows that a positive differential exists between French natives and South European natives in both sectors. On the contrary, North European origin has no significant effect on wages whatever the sector. Concerning the impact of the family background on the probability of working in a sector, it is worth to notice that identification variables are significant, except ambiguous occupations, and consistent with previous estimation of the probability to work in the public sector. The impact of parents, whose occupation is self-employed, profession or inactivity is lower
Table 7: Public and private sector log wage-equations and sector selection func-tion
(1) (2) (3)
Public Private Selection
sector sector function
Origin France - - -Southern Europe -0.01 0.01* (0.01) (0.001) Both parents 0.03** 0.003 (0.01) (0.01) Maghreb -0.0003 -0.01 (0.02) (0.01) Both parents 0.02 -0.01 (0.02) (0.01) Father’s occupation Public service
-Mostly public occupation 0.06*
(0.04) Employee (private) -0.15*** (0.02) Self-employed, professions -0.04*** (0.03) Mother’s occupation Public service
-Mostly public occupation -0.03
(0.03) Employee (private) 0.15*** (0.02) Self-employed, professions -0.06*** (0.04) Constant 2.39*** 2.27*** -2.26*** (0.04) (0.02) (.10) σ1 0.25*** σ2 0.28*** ρ1 -0.22*** ρ2 -0.63*** Observations 87,251
Standard errors in parentheses, *** p<0.01, ** p<0.05, * p<0.1. Wage equa-tions are controlled for year, qualification, working time, employment con-tract, age, education, gender and housing location. The selection equation is controlled for parents’ occupations, qualification, age, education, gender, housing location and years.
in this part but significantly negative. The dummy corresponding to a mother employed in the private sector has a positive impact in the selection function.
This result is surprising but could be explained by the introduction of wage-equation variables in the sector choice-wage-equation.
Correlations between wages and the sector selection equation is summarized by coefficients ρi in the switching model. These correlations result from the
conditional expectations of the wages:
E(w1i|Si= 1,1i) = Xi0 β1+ origi β1o+ σ1ρ1f (δBi)/F (δBi)
E(w1i|Si= 0,1i) = Xi0 β1+ origi β1o− σ1ρ1f (δBi)/(1 − F (δBi))
E(w2i|Si= 1,1i) = Xi0 β2+ origi β2o+ σ2ρ2f (δBi)/F (δBi)
E(w2i|Si= 0,1i) = Xi0 β2+ origi β2o− σ2ρ2f (δBi)/(1 − F (δBi))
As ρ1 and ρ2 are both negative and significantly different from zero, workers of
each sector better perform in that sector than a random worker of the sample. However, performance is higher for workers of the private sector than for workers of the public sector. Consequently, the sector selection allocates workers to the sector where their abilities will be better paid.
4.4
Robustness checks
As second generation immigrants and the public sector have particular charac-teristics, several parameters could influence results. Following paragraphs tests the robustness of the study among these parameters.
Young workers South European and North African immigration waves have not the same characteristics. South European wave is older and second gener-ation immigrants cover the entire populgener-ation pyramid. On the contrary, North African wave is more recent and began mostly after decolonization. Second-generation immigrants are younger and only few of them are more than 45 years old. In order to better compare both origins, the study is redone only with individuals less than 45. Results reinforce previous findings: an impact of origin is observable for South European natives and nothing is significant concerning North African natives. It is worth to notice one change: it adds a significant negative impact of a North African father in the probability to work
in the public sector.
Women Behavior of women is different from behavior of men. In particular, women are over-represented in the public sector. It is often explained by the fact that jobs of the public sector are mostly life job and that the gender gap is lower in the public sector. Another bias could be due to the fact that gender equity is not the same is all culture and a larger gender gap could be higher among second generation immigrants among French natives. In order to check all these hypothesis, equations are separately estimated for women and men. Results are identical to previous regressions. Consequently, gender does not influence our findings.
ZUS In order to decrease geographical inequalities, the French government leads active policies. Several categories of areas have been defined: priority ed-ucation zones (Zones d’Eded-ucation Prioritaire), tax-free zones (Zones Franches Urbaines) or sensitive urban zones (Zones Urbaine Sensible). In this study, the last one could have an impact on wages and the likelihood to work in the pub-lic sector. ZUS are defined in the law as areas characterized by large housing estate or damaged hoods and imbalanced between employment and dwelling. Inhabitants are facing economic hardships: a high unemployment rate, espe-cially for young people, insecurity and low wages. Another characteristic is a poor level of education. Due to high difficulties inside schools, the quality of diploma delivered is lower than in the whole territory. Living in a ZUS could be a signal of bad education for employers and controlling for it in estimations can under-estimate the wage gap. Immigrant population is over-represented in these areas and, consequently, the second generation too. In our sample, 18% of the North African natives live in ZUS compared to 5% for French and South European natives.
To control any changes due to this localization, a dummy on the ZUS is introduced in regression equations. Results remains similar: The dummy does not change significance of North African origin in wages equation nor in selec-tion estimaselec-tion. However, it decreases the wages of North African natives in the private sector and is relatively neutral in other cases. This impact is added
to the discrimination factor as Simon et al. (2000) show in their note. Indeed, the immigrants from Africa tend to live more in social housing and not in pri-vate apartments and the ZUS are essentially made up of social housing and located in the suburbs. The hiring process is known as discriminating against the second-generation African immigrants as shown Duguet et al. (2010) in their correspondence study. And the difficulties of this minority on the housing market decrease their wages as the coefficient associated to the variable ZU S highlights.
Full time workers Our sample contains full and part time workers. Around 17% of workers have a part time contract. These workers have particular charac-teristics and are often excluded from estimations of wage equations. Our results are relatively similar when part time workers are omitted. The contrast be-tween North African and South European natives is deeper in wage and sector selection equations but the difference remains insignificant.
Monthly wages Some predominantly public jobs, as teacher, induce few re-ported hours and more work at home. This could induce a bias in estimation of public wages. An overlook on descriptive statistics shows that most of them reported a full-time schedule of more than 40 hours and there are no differences in declaration by origin and sector. To confirm these observations, the study is redone with monthly wages on full-time workers. Results are similar concerning North African natives and, even if coefficients are negative, the wage gap is not significant. Concerning South European natives, results are no more significant when the country of origin is interacted with parents’ gender. However, results are similar in the public sector when origin is controlled by the country of origin and a dummy on mixed/non-mixed couples.
5
Conclusion
Using the French Labor Force Survey, this paper provides an empirical evalu-ation of discriminevalu-ation against French second-generevalu-ation immigrants. In order to compare the public and the private sector, a wage-equation is estimated by
sector. However the assignment between sectors is non-random and a switch-ing model takes this bias into account by a simultaneous equations model with limited dependent and qualitative endogenous variables.
Our study shows that all the second generation immigrants are not similarly treated. If the entire wage gap between North African and French natives is explained by productive characteristics of workers, a part of the wage gap in favor of South European natives remains unexplained. This result confirms that all foreign natives are not fully integrated to the French labor market. The particular situation of the North African natives is pointed out in studies on the second-generation immigrants in France, and compared to the South European natives, who are better assimilated in the labor market. Several explanations can be given. First, the educational attainment is really different, as Domingues Dos Santos & Wolf (2007) show. Belzil & Poinas (2010) confirm this educational gap between the African and the French natives and they conclude that this affects the hiring process and the wages of the second-generation immigrants into the labor market. Second, differences of behavior at work observed in the different minorities in France, which is put forward by Senik & Verdier (2011) justify differences on the labor market. Third, the importance of housing: The fact that the African immigrants are mostly in social housing and in ZUS decreases their probability to access to employment as correspondence studies show. This paper shows that this has an impact on wages too. However, results show that the number of immigrant parents and their gender is more important to explain differences between foreign natives. than the country of origin to explain wage gaps. Even if the coefficient associated to North African origin is negative and the one associated to South European origin is positive, results are not significant as in other studies on the topic. The mother plays a particular role as she spends more time on children homework. This mirrors the issue of education of immigrants’ children.
The other result of this paper is that, contrary to the reputation of fairness enjoyed by the public sector, French second generation is not treated similarly in both sectors. The wage gap between French and South European natives is higher in the public sector than in the private one. The wage gap is observed in the simple OLS wage-equation estimation and persists when controlling for
the non-random assignment of individuals in the sectors.
Compared to hiring discrimination observed in France against North African natives, we can consider that discrimination on wages does not exist. Further research on this topic has to be focus on path in life in order to take into account other forms of discrimination as hiring or occupation, and study pre-market discrimination.
References
Aeberhardt, R., & Pouget, J. 2007. National Origin Wage Differentials in France: Evidence from Matched Employer-Employee Data. IZA Discussion Papers 2779.
Aeberhardt, R., Fougère, D., Pouget, J., & Rathelot, R. 2010. Wages and Employment of French Workers with African Origin. Journal of Population Economics, 23(3), 881–905.
Arrow, K. J. 1973. The Theory of Discrimination. Pages 3–33 of: Ashenfelter, O., & Rees, A. (eds), Discrimination in Labor Markets. Princeton University Press.
Ashenfelter, O., & Hannan, T. 1986. Sex Discrimination and Product Market Competition: The Case of the Banking Industry. The Quarterly Journal of Economics, 101(1)(February), 149–73.
Bargain, O., & Melly, B. 2008. Public Sector Pay Gap in France: New Evidence using Panel Data. IZA Discission Papers 3427.
Becker, G. 1957. The Economics of Discrimination. University of Chicago Press. Beffy, M., & Kamionka, T. 2010. Public-private Wage Gaps: Is Civil-servant Human Capital Sector-Specific? CREST-INSEE Discussion Papers 2010-55. Belzil, C., & Poinas, F. 2010. Education and Early Carrer Outcomes of
Second-Generation Immigrants in France. Labour Economics, 17(1), 101–110. Black, S.E., & Brainerd, E. 2004. Importing equality? The impact of
globaliza-tion on gender discriminaglobaliza-tion. Industrial and Labor Relaglobaliza-tions Review, 57(4), 540–559.
Black, S.E., & Strahan, P.E. 2001. The Division of Spoils: Rent-Sharing and Discrimination in a Regulated Industry. American Economic Review, 91(4), 814–831.
Brugeilles, C., & Sebille, P. 2009. La participation des pères aux soins et à l’éduation des enfants. Politiques Sociales et Familiales, 95, 19–32.
Domingues Dos Santos, M. 2005. Travailleurs maghrébins et portugais en France. Revue économique, 56(2), 447–464.
Domingues Dos Santos, M., & Wolf, F.C. 2007. Human Capital Background and the Educationnal Attainment of the Second-Generation Immigrants in France. Discussion Paper.
Duguet, E., Léandri, N., L’Horty, Y., & Petit, P. 2010. Are Young French Jobseekers of Ethnis Immigrant Origin Discriminated Against? Annals of Economics and Statistics, Dec, 187–216.
Dustman, C., & Van Soest, A. 1998. Public and Private Sector Wages of Male Workers in Germany. European Economic Review, 42, 1417–1441.
Fougère, D., & Pouget, J. 2003a. Les déterminants économiques de l’entrée dans la fonction publique. Economie et statistiques, 15–48.
Fougère, D., & Pouget, J. 2003b. Who Wants to Be a ’Fonctionnaire’ ? The Effects of Individual Wage Differentials and Unemployment Probabilities on the Queues for Public Sector Jobs. CREST-INSEE Discussion Papers. Gregory, R.G., & Borland, J. 1999. Recent Developments in Public Sector Labor
Markets. Vol. 3. Elsevier. Chap. 53, pages 3573–3630.
Hartog, J., & Oosterbeek, H. 1993. Public and Private Sector Wages in the Netherlands. European Economic Review, 37(1), 97–114.
Heitmueller, A. 2006. Public-Private Sector Wage Differentials in a Devolved Scotland. Journal of Applied Econometrics, 9(2), 295–323.
Heywood, J.S., & Peoples, J.H. 1994. Deregulation and the Prevalence of Black Truck Drivers. Journal of Law and Economics, 37(1), 133–155.
Johnson, W.R. 1978. Racial Wage Discrimination and Industrial Structure. The Bell Journal of Economics, 9(1), 70–81.
Jolliffe, D., & Campos, N.F. 2005. Does market liberalisation reduce gender discrimination? Econometric evidence from Hungary, 1986-1998. Labour Eco-nomics, 44(1), 1–22.
Krueger, A. 1988. The determinants of Queues for Federal Jobs. Industrial and Labor Relations Review, 41, 567–581.
Lee, L.-F. 1978. Unionism and wage rates: A simultaneous equations model with qualitative and limited dependent variables. International Economic Review, 19(2), 415–433.
Meurs, D., & Edon, C. 2007. France: A Limited Effect of Regions on Public Wage Differentials. The Manchester School, 75(4), 479–500.
Meurs, D., & Pailhé, A. 2010. Position sur le marché du travail des descen-dants directs d’immigrés en France : les femmes doublement désavantagées ? Economie et Statistiques, 431(1), 129–151.
Phelps, E. 1972. The Statistical Theory of Racism and Sexism. American Economic Review, 62(4), 639–651.
Pouget, J. 2005. La France, Portrait social. 2005-2006 edn. Paris: INSEE. Chap. La fonction publique : vers plus de diversité, pages 143–162.
Senik, C., & Verdier, T. 2011. Segregation, Entrepreneurship and Work Values: the Case of France. Journal of Population Economics, 24(4), 1207–1234. PSE Discussion Papers.
Shackett, J.R., & Trapani, J.M. 1987. Earnings Differentials and Market Struc-ture. The Journal of Human Ressources, 22(4), 518–531.
Simon, P., Kirszbaum, T., Chafi, M., & Tissot, S. 2000. Les discriminations raciales et ethniques dans l’accès au logment social. Note. GELD.
Van der Gaag, J., & Vijverberg, W. 1988. A Switching Regression Model for Wage Determinants in the Public and Private Sectors of a Developing Coun-try. The Review of Economy and Statistics, 70(2), 244–252.
Van Ophem, H. 1993. A Modified Switching Regression Model for Earnings Differentials Between the Public and the Private Sectors in the Netherlands. Review of Economics and Statistics, 75(2), 215–223.
Table 8: Public and private sector log wage-equations and sector selection function
(1) (2) (3)
Public Private Selection
sector sector function
Origin Southern Europe Mother -0.02 -0.002 (0.02) (0.01) Father -0.01 0.02** (0.01) (0.01) Both parents 0.05** -0.004 (0.02) (0.01) Northern Africa Mother -0.01 -0.01 (0.04) (0.03) Father 0.003 -0.01 (0.02) (0.01) Both parents -0.02 -0.004 (0.05) (0.03) Father’s occupation Public service - -
-Mostly public occupation 0.06
(0.04) Employee (private) -0.14*** (0.02) Self-employed, professions -0.03*** (0.03) Mother’s occupation Public service - -
-Mostly public occupation -0.04
(0.03) Employee (private) 0.15*** (0.02) Self-employed, professions -0.05*** (.04) Constant 2.38*** 2.27*** -2.21*** (0.04) (0.02) (0.10) σ1 0.24*** σ2 0.28*** ρ1 -0.22*** ρ2 -0.64*** Observations 87,251
Standard errors in parentheses, *** p<0.01, ** p<0.05, * p<0.1. Wage equa-tions are controlled for year, qualification, working time, employment con-tract, age, education, gender and housing location. The selection equation is controlled for qualification, age, education, gender and housing location.
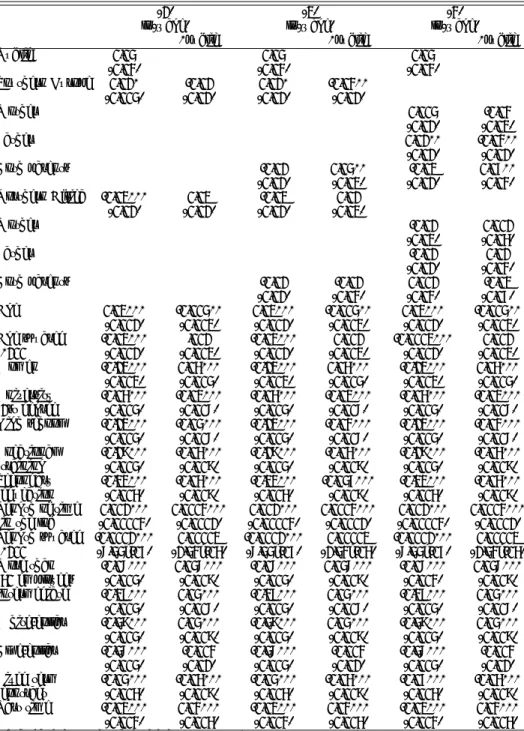
Table 9: Log wage-equation regression
(1) (2) (3)
ln(wage) ln(wage) ln(wage)
*public *public *public
Public 0.04 0.04 0.04 (0.03) (0.03) (0.03) Southern Europe 0.01* -0.01 0.01* -0.03** (0.004) (0.01) (0.01) (0.01) Mother 0.004 -0.03 (0.01) (0.02) Father 0.01** -0.03** (0.01) (0.01) Both parents -0.01 0.04** -0.02 0.06** (0.01) (0.02) (0.01) (0.03) Northern Africa -0.02*** 0.02 -0.02 0.01 (0.01) (0.01) (0.01) (0.02) Mother -0.01 0.001 (0.02) (0.05) Father -0.01 0.01 (0.01) (0.03) Both parents -0.01 -0.01 0.001 -0.02 (0.01) (0.03) (0.03) (0.06) Age 0.02*** -0.004** 0.02*** -0.004** 0.02*** -0.004** (0.001) (0.002) (0.001) (0.002) (0.001) (0.002) Age squared -0.02*** .001 -0.02*** 0.001 -0.0002*** 0.001 *100 (0.001) (0.002) (0.001) (0.002) (0.001) (0.002) Women -0.12*** 0.05*** -0.12*** 0.05*** -0.12*** 0.05*** (0.002) (0.004) (0.002) (0.004) (0.002) (0.004) University -0.05*** -0.02*** -0.05*** -0.02*** -0.05*** -0.02*** 1st degree (0.004) (0.007) (0.004) (0.007) (0.004) (0.007) High school -0.12*** -0.04*** -0.12*** -0.03*** -0.12*** -0.03*** (0.004) (0.007) (0.004) (0.007) (0.004) (0.007) Vocational -0.18*** -0.05*** -0.18*** -0.05*** -0.18*** -0.05*** training (0.004) (0.008) (0.004) (0.008) (0.004) (0.008) Secondary -0.22*** -0.05*** -0.22*** -0.046*** -0.22*** -0.05*** education (0.005) (0.008) (0.005) (0.008) (0.005) (0.008) Length of time 0.001*** 0.0003*** 0.001*** 0.0003*** 0.001*** 0.0003*** in the job (0.00003) (0.0001) (0.00003) (0.0001) (0.00003) (0.0001) Length squared -0.0001*** 0.00002 -0.0001*** 0.00002 -0.0001*** 0.00002
*100 (7.44e-06) (1.43e-05) (7.44e-06) (1.43e-05) (7.44e-06) (1.43e-05)
More than -0.07*** 0.047*** -0.07*** 0.047*** -0.07*** 0.047*** 50 employees (0.004) (0.008) (0.004) (0.008) (0.003) (0.008) Intermediate -0.29*** 0.04*** -0.29*** 0.04*** -0.29*** 0.04*** (0.004) (0.007) (0.004) (0.007) (0.004) (0.007) White-collar -0.48*** 0.04*** -0.48*** 0.04*** -0.48*** 0.04*** (0.004) (0.008) (0.004) (0.008) (0.004) (0.008) Blue-collar -0.47*** -0.003 -0.47*** -0.003 -0.47*** -0.003 (0.004) (0.01) (0.004) (0.01) (0.004) (0.01) Fixed term -0.04*** -0.05*** -0.04*** -0.05*** -0.06*** -0.05*** contract (0.005) (0.008) (0.005) (0.008) (0.005) (0.008) Part time -0.02*** 0.03*** -0.02*** 0.03*** -0.02*** 0.03*** (0.003) (0.005) (0.003) (0.005) (0.003) (0.005)
Table 10: Log wage-equation regression(continuation)
(1) (2) (3)
ln(wage) ln(wage) ln(wage)
*public *public *public
Grande couronne -0.09*** 0.05*** -0.09*** 0.05*** -0.09*** 0.05*** (0.004) (0.007) (0.004) (0.007) (0.004) (0.007) North -0.10*** 0.08*** -0.10*** 0.08*** -0.10*** 0.08*** (0.004) (0.01) (0.004) (0.01) (0.004) (0.01) East -0.05*** 0.02*** -0.05*** 0.03*** -0.05*** 0.03*** (0.004) (0.008) (0.004) (0.008) (0.004) (0.008) West -0.12*** 0.07*** -0.12*** 0.07*** -0.12*** 0.07*** (0.004) (0.01) (0.004) (0.01) (0.004) (0.01) South east -0.11*** 0.07*** -0.11*** 0.071*** -0.11*** 0.07*** (0.004) (0.01) (0.004) (0.01) (0.004) (0.01) Center -0.08*** 0.04*** -0.08*** 0.04*** -0.08*** 0.04*** (0.004) (0.01) (0.004) (0.01) (0.004) (0.01) South west -0.08*** 0.05*** -0.08*** 0.05*** -0.08*** 0.05*** (0.004) (0.01) (0.004) (0.01) (0.004) (0.01) 2006 0.005 -0.01 0.01 -0.01 0.005 -0.01 (0.004) (0.01) (0.004) (0.01) (0.004) (0.01) 2007 0.02*** -0.03*** 0.02*** -0.03*** 0.02*** -0.03*** (0.004) (0.01) (0.004) (0.01) (0.004) (0.01) 2008 0.02*** -0.04*** 0.02*** -0.04*** 0.02*** -0.04*** (0.004) (0.01) (0.004) (0.01) (0.004) (0.01) 2009 0.01*** -0.03*** 0.01*** -0.03*** 0.01*** -0.03*** (0.003) (0.01) (0.003) (0.01) (0.003) (0.01) 2010 0.02*** -0.03*** 0.02*** -0.03*** 0.02*** -0.03*** (0.003) (0.01) (0.003) (0.01) (0.003) (0.02) Hospital 0.005 0.005 0.005 (0.004) (0.004) (0.04) Local government -0.04*** -0.04*** -0.04*** (0.01) (0.01) (0.01) Constant 2.38*** 2.38*** 2.38*** (0.02) (0.02) (0.02) Observations 87,251 87,251 87,251 R-squared 0.52 0.52 0.52
Table 11: Log wage-equation regression for 2nd generation immigrants
(1) (2) (3)
ln(wage) ln(wage) ln(wage)
*public *public *public
Public 0.08 0.08 0.09 (0.13) (0.13) (0.13) S.E Father 0.01 -0.002 (0.01) (0.02) Both parents SE -0.01 0.04** -0.01 0.04* (0.04) (0.02) (0.01) (0.02) Northern Africa -0.02*** 0.01 -0.02* 0.04 (0.01) (0.02) (0.01) (0.03) Mother -0.02 0.02 (0.03) (0.05) Father -0.02 0.05 (0.02) (0.03) Both parents -0.01 -0.02 0.01 -0.05 (0.01) (0.03) (0.03) (0.06) Age 0.02*** -0.003 0.02*** -0.004 0.02*** -0.004 (0.003) (0.01) (0.003) (0.01) (0.003) (0.01) Age squared -0.02*** -0.001 -0.02*** 0.0004 -0.02*** 0.0005 *100 (0.004) (0.01) (0.004) (0.01) (0.004) (0.01) Women -0.13*** 0.06*** -0.13*** 0.05*** -0.13*** 0.05*** (0.01) (0.02) (0.01) (0.02) (0.01) (0.02) University -0.04*** 0.02 -0.04*** 0.02 -0.04*** 0.02 1st degree (0.02) (0.03) (0.02) (0.03) (0.02) (0.03) High school -0.12*** 0.02 -0.12*** 0.02 -0.12*** 0.02 (0.01) (0.03) (0.01) (0.03) (0.01) (0.03) Vocational -0.18*** 0.01 -0.18*** 0.01 -0.18*** 0.01 training (0.01) (0.02) (0.01) (0.03) (0.01) (0.03) Secondary -0.21*** -0.01 -0.21*** -0.004 -0.21*** -0.004 education (0.02) (0.03) (0.02) (0.03) (0.02) (0.03) Length of time 0.001*** -0.0002 0.001*** -0.0002 0.001*** -0.0002 in the job (0.0001) (0.0002) (0.0001) (0.0002) (0.0001) (0.0002) Length squared -0.0001*** 0.0001*** -0.0001*** 0.0001*** -0.0001*** 0.0001*** *100 (0.00003) (0.0001) (0.00003) (0.0001) (0.00003) (0.0001) More than -0.04*** 0.02 -0.04*** 0.02 -0.04*** 0.02 50 employees (0.01) (0.02) (0.01) (0.02) (0.01) (0.02) Intermediate -0.25*** -0.03 -0.25*** -0.04 -0.25*** -0.04 (0.01) (0.03) (0.01) (0.03) (0.01) (0.03) White collar -0.43*** -0.03 -0.43*** -0.03 -0.43*** -0.03 (0.01) (0.03) (0.01) (0.03) (0.01) (0.03) Blue-collar -0.42*** -0.07* -0.42*** -0.07* -0.42*** -0.07* (0.01) (0.04) (0.01) (0.04) (0.01) (0.04) Fixed term -0.04*** -0.07** -0.04*** -0.07** -0.04*** -0.07** contract (0.01) (0.03) (0.01) (0.03) (0.01) (0.06) Part time -0.03*** 0.05** -0.03*** 0.05** -0.03*** 0.05** (0.01) (0.02) (0.01) (0.02) (0.01) (0.02)
Table 12: Log wage-equation regression for 2nd generation immigrants (contin-uation)
(1) (2) (3)
ln(wage) ln(wage) ln(wage)
*public *public *public
Grande couronne -0.06*** 0.02 -0.07*** 0.02 -0.07*** 0.02 (0.01) (0.02) (0.01) (0.02) (0.01) (0.02) North -0.06*** 0.04 -0.06*** 0.04 -0.06*** 0.04 (0.02) (0.03) (0.02) (0.03) (0.02) (0.03) East -0.03** 0.03 -0.03** 0.04 -0.03** 0.04 (0.01) (0.03) (0.01) (0.03) (0.01) (0.03) West -0.08*** -0.01 -0.08*** -0.01 -0.08*** -0.01 (0.02) (0.04) (0.02) (0.04) (0.02) (0.04) South east -0.10*** 0.08*** -0.10*** 0.08*** -0.10*** 0.08*** (0.01) (0.03) (0.01) (0.03) (0.01) (0.03) Center -0.05*** 0.03 -0.05*** 0.03 -0.05*** 0.03 (0.01) (0.02) (0.01) (0.02) (0.01) (0.02) South west -0.07*** 0.02 -0.07*** 0.02 -0.07*** 0.02 (0.01) (0.02) (0.01) (0.02) (0.01) (0.02) 2006 -0.01 0.03 -0.01 0.03 -0.01 0.03 (0.01) (0.08) (0.01) (0.03) (0.01) (0.03) 2007 0.02 -0.01 0.02 -0.01 0.02 -0.005 (0.01) (0.03) (0.01) (0.03) (0.01) (0.03) 2008 0.02* -0.03 0.02* -0.03 0.02* -0.03 (0.01) (0.03) (0.01) (0.03) (0.01) (0.03) 2009 0.004 -0.02 0.004 -0.02 0.004 -0.01 (0.01) (0.02) (0.01) (0.02) (0.01) (0.02) 2010 -0.003 0.001 -0.003 0.001 -0.003 0.002 (0.01) (0.02) (0.01) (0.02) (0.01) (0.02) Hospital 0.01 0.01 0.01 (0.01) (0.01) (0.01) Local government -0.07** -0.07** -0.08** (0.03) (0.035) (0.035) Constant 2.31*** 2.31*** 2.31*** (0.05) (0.05) (0.06) Observations 7,267 7,267 7,267 R-squared 0.46 0.46 0.46
Table 13: Probability of working in the public sector (1) (2) (3) Southern Europe -0.05** 0.1*** (0.02) (0.03) Mother 0.16*** (0.05) Father 0.12*** (0.04) Both parents -0.35*** -0.49*** (0.04) (0.07) Northern Africa 0.05 -0.04 (0.03) (0.06) Mother 0.11 (0.12) Father -0.09 (0.07) Both parents 0.12 0.06 (0.07) (0.15) Age 0.02*** 0.02*** 0.02*** (0.0005) (0.0005) (0.0005) Women 0.03*** 0.03** 0.03** (0.01) (0.01) (0.01) University -0.30*** -0.30*** -0.30*** 1st degree (0.02) (0.02) (0.02) High school -0.35*** -0.35*** -0.35*** (0.02) (0.02) (0.02) Vocational -0.48*** -0.48*** -0.48*** training (0.02) (0.02) (0.02) Secondary -0.51*** -0.51*** -0.51*** education (0.02) (0.02) (0.02) Grande couronne -0.28** -0.28*** -0.28*** (0.02) (0.02) (0.02) North -0.43*** -0.44*** -0.44*** (0.02) (0.02) (0.02) East -0.23*** -0.24*** -0.24*** (0.02) (0.02) (0.02) West -0.41*** -0.41*** -0.41*** (0.02) (0.02) (0.02) South east -0.33*** -0.34*** -0.34*** (0.02) (0.02) (0.02) Center -0.30*** -0.30*** -0.30*** (0.02) (0.02) (0.02) South west -0.17*** -0.18*** -0.18*** (0.02) (0.02) (0.02)