HAL Id: cea-01373750
https://hal-cea.archives-ouvertes.fr/cea-01373750
Submitted on 29 Sep 2016
HAL is a multi-disciplinary open access
archive for the deposit and dissemination of
sci-entific research documents, whether they are
pub-lished or not. The documents may come from
teaching and research institutions in France or
abroad, or from public or private research centers.
L’archive ouverte pluridisciplinaire HAL, est
destinée au dépôt et à la diffusion de documents
scientifiques de niveau recherche, publiés ou non,
émanant des établissements d’enseignement et de
recherche français ou étrangers, des laboratoires
publics ou privés.
Microdisplacements induced by a local perturbation
inside a granular packing
Daniel Bonamy, Samuel Bernard-Bernardet, François Daviaud, Louis Laurent
To cite this version:
Daniel Bonamy, Samuel Bernard-Bernardet, François Daviaud, Louis Laurent. Microdisplacements
induced by a local perturbation inside a granular packing. Physical Review E : Statistical,
Nonlin-ear, and Soft Matter Physics, American Physical Society, 2003, 68 (4), pp.042301.
�10.1103/Phys-RevE.68.042301�. �cea-01373750�
Microdisplacements induced by a local perturbation inside a granular packing
D. Bonamy,1,2 S. Bernard-Bernardet,1F. Daviaud,1and L. Laurent11
Service de Physique de l’Etat Condense´, CEA Saclay, 91191 Gif sur Yvette, France
2Laboratoire des Verres, Universite´ Montpellier 2, F-34095 Montpellier Cedex 5, France
共Received 25 October 2002; revised manuscript received 20 August 2003; published 28 October 2003兲
The microdisplacements generated by a small localized overload at the free surface are visualized experi-mentally inside a packing of steel beads. For a triangular packing, beads rearrangements remain confined in two inverted triangles on both sides of the applied overload. This pattern disappears for stronger disorder. A simple model allows us to account for these observations and to relate them to the stress function response measured via photoelastic visualizations. This provides a different tool to probe the mechanical Green’s function in weakly confined packings of rigid grains the description of which is the most challenged.
DOI: 10.1103/PhysRevE.68.042301 PACS number共s兲: 45.70.Qj, 45.70.Cc, 81.05.Rm
I. INTRODUCTION
Force distribution in granular packing is rather counterin-tuitive. For instance, the pressure profile measured at the basis of a conical sand pile can present a ‘‘dip’’ as well as a maximum below the apex of the heap depending on the pile construction history关1兴. These results entailed intensive the-oretical research, leading to several models differing signifi-cantly. A broad group of models, referred to as elasto-plastic models, considers granular media as elastic media as long as for any point the Mohr-Coulomb criterion is not reached关2兴. In the elastic domain, the components of the stress tensor obey the elliptic partial differential equation共PDE兲. Another class of models, called oriented stress linearity共OSL兲 mod-els, questions the existence of an elastic regime and proposes rather to put the force chain’s role forward, which leads to hyperbolic PDE关3兴. Finally, the last class of models, referred to as q models, assimilates the packing to a regular lattice where the force—considered only through its vertical component—is transmitted randomly from a given grain to its two neighbors beneath, which lead to parabolic PDE关4兴. By leading to PDE of different nature, these three approaches are mutually exclusive.
How to test the competing models? The best way would be to measure the stress response function under a layer of grains of constant thickness H perturbed by the addition of an infinitesimal localized overload at the free surface; OSL models foresee that the pressure profile exhibits two peaks whose width increases as
冑
H, separated by a distance in-creasing linearly with H. For the same configuration, both elastic model and q model predict the existence of a single peak whose width increases linearly and as square root of H, respectively. Several experiments have been performed with this aim in view using either synchrone detection关5兴 or pho-toelastic visualization 关6,7兴, but they have not allowed to clarify definitively the question. Depending on the investi-gated system, either the q model关6兴, the elastic model 关5,7兴, or the OSL model关7兴 predictions are recovered. The stage of disorder in the packing appears as a crucial parameter关7,8兴, but its influence remains far from being understood.Neither experiment 关5,6兴 allows one to control the disor-der in the packing. Moreover, the photoelastic experiments
关6,7兴 present the drawback of considering soft grains, with a
Young modulus 10 000 times smaller than the one of steel or glass grains, while the greater sources of disagreements be-tween the different models concern precisely the hard grains packing. In this paper, we investigate the response of steel beads packings to a localized overload at the free surface by looking at the microdisplacements rather than the stress variations within packings of different disorder stages. We show that the spatial ordering of the particle is a key param-eter for the distribution of microdisplacements within the packing. Ordered packings exhibit preferential propagation direction while disordered packings do not, as what was pre-viously observed on photoelastic visualizations 关7兴. The mi-crodisplacements frames are claimed to be mainly related to the orientation map of the local forces induced by the over-load. A simple model is developed to test this relationship.
II. EXPERIMENTAL SETUP
The experimental setup is illustrated in Fig. 1. It consists of a fixed drum of diameter D0⫽45 cm and variable thick-ness , half-filled with steel beads of diameter d⫽3
⫾0.03 mm, of Young modulus Y⫽200 GPa and of mass
m⫽0.11 g. For such geometry, the stresses 共resp. displace-ments兲 can be assumed to vanish at the free surface 共resp. at the drum lower boundaries兲. Three kinds of packings are investigated: 共a兲 a two dimensional 共2D兲 ordered packing obtained by setting⫽3.05 mm and by placing an item with a half hexagon shape in the lower half part of the drum; the
packing is then monocrystalline with beads forming a trian-gular lattice 关Fig. 2共a兲兴; 共b兲 a 2D disordered packing by re-trieving the half hexagon from the previous packing and by adding randomly 100 cylinders with diameter of 5 mm. The crystalline grains size is then about 50 beads diameters关Fig. 2共b兲兴; 共c兲 a quasi-2D disordered packing by setting
⫽7 mm. Only beads in contact with the transparent side
wall of the drum can be actually seen. This 2D cut of a 3D packing is then completely disordered关Fig. 2共c兲兴. The local-ized overload consists of a rod with a plate on which differ-ent weights can be placed at its upper tip and a pad which allows one to spread the overload on five to seven beads depending on the packing geometry at its lower tip共Fig. 1兲. Beads are lighted via a continuous halogen lamp. The rod is put carefully at the center of the free surface of the packing. A first sequence of 100 frames of the constrained packing is recorded via a fast camera at a sampling rate of 250 Hz. The rod is then retrieved very slowly. A second sequence of 100 frames of the free packing is recorded. The frame resolution
is 480⫻420 pixels, one pixel corresponding to 0.224 mm. The two sequences are first averaged. This process allows one to greatly reduce the noise caused by lighting fluctua-tions or drum and camera intrinsic vibrafluctua-tions. The two re-sulting frames are subtracted, and then binarized. The beads that have moved when the tube was retrieved are then dis-tinguished. Application of this frame processing to the mo-tion of a bead translated with a micrometric translator shows that microdisplacements superior to 20 m are spotted un-ambiguously. This should be compared to the size of the cage where each bead is confined. In the packing of maximal volume fraction, the packing 共a兲, this size is given by the scattering in the diameter and sphericity of beads, which is around 30m. The microdisplacements entailed by the overload can then be localized but cannot be quantified. Each experiment is performed ten times by laying the rod to dif-ferent places. All experimental results presented below are averaged over these ten realizations.
III. MICRODISPLACEMENTS DISTRIBUTION IN THE PACKING
Typical frames of the beads micromoved by the overload are represented in Figs. 2共d–f兲 for packing 共a兲, 共b兲, and 共c兲, respectively. For all these packings, the number of displaced beads increases with the overload. In the ordered packing
关Fig. 2共d兲兴, moving beads stand preferentially on either side
of the overload: a dark triangle, i.e., an area without any microrearrangement, can be observed at the vertical of this one. This suggests this in that kind of packing, information of the overload existence propagates more likely along pref-erential directions. Beads close to these directions feel in a stronger way the overload presence than the ones—rather closer—just below it. In the disordered packing 关Figs. 2共e,f兲兴, the triangular pattern disappears and the area sensi-tive to the perturbation takes the shape of a half disk. Beads are all the more liable to rearrangements as they are close to the perturbation source, without any noticeable anisotropy.
These observations can be compared to the photoelastic visualizations of Geng et al. 关7兴 exhibiting a propagative component in the stress response to a point force for ordered packings whereas such stress response is more like the one of an isotropic elastic material for disordered packings. Beads microdisplacements are then conjectured to be driven by the following scenario: The overload induces an additional force component to each bead. When this last one is oriented to-ward the boundaries of the drum, the bead motion is only due to contact deformation 共a few nanometers for grains of Young Modulus Y⫽200 GPa). Such displacements are too small to be detected by our visualization method; but when the force component is oriented toward the free surface and sufficient to lift the beads layer above it, displacements with an order of magnitude of the cage size, i.e., 30m, are expected and can thus be detected 关10兴.
IV. TOY MODEL
Now we propose to test this interpretation. Several mod-els have been proposed to explain force distribution in a
FIG. 2. Distribution of the displacements in different packing with a small overload put at the free surface.共a兲, 共b兲, and 共c兲 are the raw frames of a 1D triangular packing, a 2D disordered packing, and a quasi-2D disordered packing, respectively 共see text for de-tails兲. The insets present the corresponding 2D FFT transforms. The six peaks observed in共a兲 are the signature of the triangular packing. These peaks become blurred in the disorder 2D packing 共b兲 and disappear in the quasi-2D packing共c兲. The figures 共d兲, 共e兲, and 共f兲 present the displacements distribution in packings共a兲, 共b兲, and 共c兲 when an overload of mass M⫽1120 共adimensioned by the bead mass兲 is added at the center of the free surface.
BRIEF REPORTS PHYSICAL REVIEW E 68, 042301 共2003兲
granular packing 关4,8,9兴, but, to our knowledge, none of them allows one to account for beads microdisplacements. In this context, a minimal toy model has been developed. Its aim is not to reproduce quantitatively the observations, but rather to account qualitatively for the role of the disorder-controlled through a small set of parameters, ideally a single one-on both stress and displacements response functions. This model is described precisely in Ref. 关11兴 and summa-rized below.
Grains are placed on a triangular lattice. Each grain is located through its coordinates (X,Z) 共Fig. 3兲. An overload is then applied on the grain at the surface at the center of the lattice. The generated additional forces are characterized by three quantities: the position P⫽(X,Z) of the bead to which it is applied, the norm w of the additional force and the angle
⌽ between this force, and the vertical 共oriented from top to
bottom兲. A force F⫽1 is first applied to the bead O at the surface at the center of the lattice. This bead acquires an overload w(t⫽0) defined by P⫽(0,0), w⫽F, and ⌽⫽0. This overload is transmitted to two of the bead neighbors at the time t⫽1, which then transmit their overload to two of their neighbors and so on. To be more precise, at a given time t, the overload w(t)⫽(P,w,⌽) applied to the bead P
⫽(X,Z) and created to the last time step is transmitted to the
beads P1and P2associated to the contact orientation1and
2, the closest of⌽ 关Fig. 3共a兲兴. Their locations (X1,Z1) and (X2,Z2) are thus given by Xi⫽X⫹sini, Zi⫽Z⫺cosifor
i⫽兵1,2其 where both X and Z are adimensioned by the bead diameter. In a triangular packing of identical perfectly smooth beads, the two transmitted overload orientation ⌽1 and⌽2 would coincide exactly with1 and2. To encode the disorder of the real packing as well as the existence of a friction component of the contact force and the beads poly-dispersity, two random angles ␣1 and ␣2 are added; ⌽i ⫽i⫹␣i for i⫽兵1,2其 关Fig. 3共b兲兴. These angles␣i are
uni-formly distributed between关⫺⌰,⌰兴 where the parameter ⌰ quantifies the disorder stage in the simulated packing. Fi-nally, the norms w1and w2of the transmitted loads are given by the force balance of the bead P at the time t; wei⌽
⫽w1ei⌽1⫹w2ei⌽2.
The force network is then built in a hierarchical manner. Each overload w(t) has one parent and two children. The half-width L and the height H of the packing are set to L
⫽100 and H⫽100, respectively, in bead size units. When a
load reaches the boundary or the free surface, it does not propagate anymore. Boundaries are thus perfect absorbing boundaries. The number of transmitted load grows very rap-idly as the network is built. A cutoff is then introduced. When the norm of a load becomes smaller than a threshold wc⫽10⫺4, this does not propagate anymore. The simulation
stops when all the loads are smaller than wc.
During the simulation, a bead can get a load wtei⌽t at a
given time t whereas it has already acquired a load wt1ei⌽t1
at a time t1 anterior to t 关12兴. In this case, the bead will transmit only the load wtei⌽t since the component wt1ei⌽t1
has already been transmitted in the past 关13兴. At the end of the simulation, the final load of this bead will be the sum of all the loads wtei⌽t it has got during the simulation.
After the simulation completion, one gets for each bead P⫽(X,Z) the overload given by (w,). A new quantity ␦ associated to each bead is then introduced with account for the bead displacement,␦⫽1 when the bead has moved and
␦⫽0 in the other case. The only free surface is for z⫽0
where beads can move in the semi-infinite plane z⬍0. A bead located at P⫽(X,Z) will thus move if the z projection of its total applied force wtotal⫽w0⫹w is negative (w0 cor-responds to the force component applied to this bead in the absence of the surcharge兲. Assuming that H is large com-pared to the width of the zone sensitive to the overload, w0is given on average by the hydrostatic pressure on this point:
w0⫽(1/r)(2/冑3)Z where r denotes the ratio between the ini-tial force F⫽1 and the bead mass. The ␦ variation is then given by ␦⫽1, when w sin(⫺/2)⭓(1/r)(2/冑3)Z and ␦
⫽0 otherwise.
A numerical experiment is thus developed according to two steps: 共1兲 One simulates the distribution and the orien-tation of the overload entailed by a force F⫽1 applied to the bead P0(0,0). 共2兲 The displacements entailed by these over-loads are then simulated. For a given set of parameters (⌰,r) both overload and displacement field are averaged over 50 different numerical experiments.
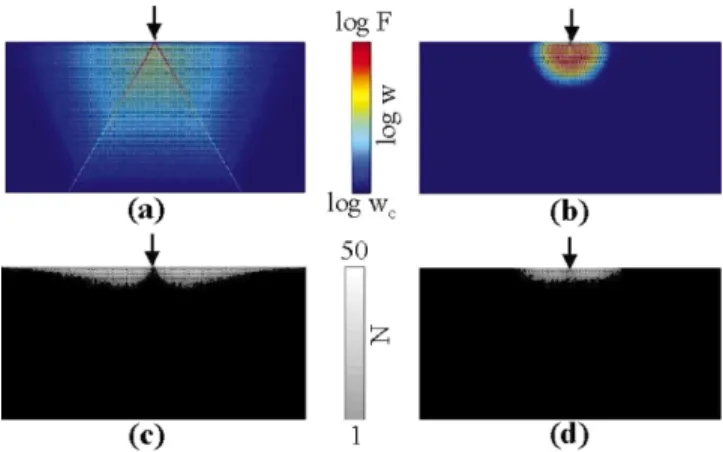
Figures 4共a,b兲 present the simulated overload fields ob-tained for two values of⌰. For triangular packings, disorder is mainly dominated by the friction mobilization at the grain/ grain contact. The angle ⌰ is then set to ⌰⫽5°, which corresponds to a bead/bead friction coefficient ofb⫽0.1. In the quasi-2D packing, disorder is maximal and ⌰ is set to
⌰⫽30°. The model captures qualitatively the behaviors
ob-served experimentally by Geng et al. 关7兴. In a triangular packing, the perturbation propagates along two preferential contact chains which make an angle of 60° between them. In a disordered packing, these two directions exist for low depth Z, but they become blurred when Z is increased.
Figures 4共c,d兲 present the associated displacement field for the ordered packing (⌰⫽5°) and the disordered packing (⌰⫽30°), respectively. The parameter r has been set to r
⫽1000 to be compatible with our experimental measures. In
the triangular packing, the triangular pattern is reproduced
FIG. 3. Propagation rule of the overload from a given bead to two of its neighbors.共a兲 The orientation of the load w determines the two neighbors P1 and P2 which will support this charge.共b兲 The orientations1and 2 of the two children charges resulting from the transmission coincide with the two contact orientations1 and 2at which two random numbers␣ and  have been added, respectively.
qualitatively with displacements localized from one part to the other of the two referential directions of force propaga-tion. When the disorder is increased, this pattern disappears. The simulation accounts also for the fact that the extension of the area where beads can move decreases with increasing disorder. The influence of the perturbation intensity on the extension of the moving area has been also investigated, with r set to 500, 1000, and 2000 for ⌰⫽5° 关14兴. These values are compatible with the ratio between the overload mass M and the beads mass investigated experimentally. In the ex-periment, this area extends at depth Z of 10d, 30d, and 35d for M⫽620m, M⫽1120m, and M⫽2180m, respectively, while in the simulation, this area extends up to Z⫽7d, 10d,
and 14d for r⫽500, 1000, and 2000. The correct orders of magnitude are recovered. Let us note, however that the lat-eral extension of the sensitive zone is much more important in the simulation than in the experiment.
V. CONCLUSION
In summary, the static of hard spheres packings has been investigated experimentally through the localization of the microdisplacements induced by a small overload added at the free surface. The spatial ordering of the grains appears as a key parameter, as previously reported by Geng et al. 关7兴 concerning the stress function response in soft photoelastic grains packings. In the ordered packing, information of the surface localized overload propagates along preferential di-rections while the function response in disordered packings is isotropic. The microdisplacements are conjectured to be related to the orientations of the overloads induced by the perturbation, what has been tested through a toy model. Such methods allow one to probe extremely hard spheres packings contrary to photoelastic measurements and may provide a new test for the latest models 关8兴 of static stresses distribu-tion in granular packing. Another natural extension of this work is to investigate the microdisplacements generated by a small overload added on an inclined free surface. In particu-lar, it would be very interesting to measure the change of the size of the area containing the moving beads when the incli-nation angle approaches the angle of repose. Work in this direction is underway.
ACKNOWLEDGMENTS
We thank O. Dauchot for fruitful discussions, and C. Gasquet, V. Padilla, and P. Meininger for technical assis-tance.
关1兴 L. Vanel et al., Phys. Rev. E 60, R5040 共1999兲
关2兴 K. Terzaghi, Mcanique Thorique des Sols 共Dunod, Paris,
1951兲; K. Terzaghi and R.B. Peck, Mcanique des Sols
Appli-que共Dunod, Paris, 1965兲.
关3兴 J.P. Bouchaud, M.E. Cates, and P. Claudin, J. Phys. I 5, 639 共1995兲; J.P. Wittmer, M.E. Cates, and P. Claudin, ibid. 7, 39 共1997兲
关4兴 C.H. Liu et al., Science 269, 513 共1995兲; S.N. Coppersmith
et al., Phys. Rev. E 53, 4673共1996兲
关5兴 G. Reydellet and E. Clement, Phys. Rev. Lett. 86, 3308 共2001兲 关6兴 M. da Silva and J. Rajchenbach, Nature 共London兲 406, 708
共2000兲
关7兴 J.F. Geng et al., Phys. Rev. Lett. 87, 035506 共2001兲 关8兴 J.P. Bouchaud et al., Eur. Phys. J. E 4, 451 共2001兲
关9兴 P. Claudin and J.P. Bouchaud, Phys. Rev. Lett. 78, 231 共1997兲;
M. Nicodemi, ibid. 80, 1340共1998兲
关10兴 For weights of several kilograms, beads motion becomes
suf-ficient to be measured quantitatively. Orientation of the mov-ing beads is observed to be actually oriented toward the free surface.
关11兴 D. Bonamy, Ph.D. thesis, Universit Paris XI, 2001.
关12兴 Such chronology implies that the sound velocity csis constant
in the whole packing, which may appear inconsistent with the important forces variations predicted by the model. However,
csdepends weakly on stresses; cs⬀␣with 1/6⭐␣⭐1/4 关X.
Jia, C. Caroli, and B. Velicky, Phys. Rev. Lett. 82, 1863
共1999兲兴. Consequently, it can be assumed to be constant in our
minimalist model.
关13兴 Let us note that, in reality, the two orientations along which the
force component wtei⌽tis splitted are determined by the
ori-entation of the total force兺ti⭐twtiei⌽tiapplied on this grain,
and not only by the orientation ⌽t. These loops were also
handled by choosing the two neighbors and the two orienta-tions among the ones determined by the previous splitting on the same bead. It does not affect the average distribution of the overload关Figs. 4共a,b兲兴 and the displacement 关Figs. 4共c,d兲兴.
关14兴 As the beads are placed on a triangular regular lattice whatever
is the disorder stage in the simulation, the model predictions cannot be compared quantitatively to the experiments per-formed within the disordered packing.
FIG. 4. 共Color兲 Mean distribution of the overloads 共top兲 and of the displacements共bottom兲 generated by the force F. Model predic-tions L and H have been chosen to be L⫽100 and H⫽100 and a numerical experiment is averaged over 50 realizations. Left: ⌰
⫽5°. Forces propagate preferentially along two directions.
Dis-placements are confined into two triangles on both sides of the two preferential lines. Right:⌰⫽30°. The pattern disappears.
BRIEF REPORTS PHYSICAL REVIEW E 68, 042301 共2003兲