HAL Id: hal-00809107
https://hal.archives-ouvertes.fr/hal-00809107
Submitted on 8 Apr 2013
HAL is a multi-disciplinary open access
archive for the deposit and dissemination of
sci-entific research documents, whether they are
pub-lished or not. The documents may come from
teaching and research institutions in France or
abroad, or from public or private research centers.
L’archive ouverte pluridisciplinaire HAL, est
destinée au dépôt et à la diffusion de documents
scientifiques de niveau recherche, publiés ou non,
émanant des établissements d’enseignement et de
recherche français ou étrangers, des laboratoires
publics ou privés.
Apparent pressure derived from ADEOS-POLDER
observations in the oxygen A-band over ocean
Claudine Vanbauce, Jean-Claude Buriez, Frédéric Parol, Bernard Bonnel, G.
Sèze, P. Couvert
To cite this version:
Claudine Vanbauce, Jean-Claude Buriez, Frédéric Parol, Bernard Bonnel, G. Sèze, et al.. Apparent
pressure derived from ADEOS-POLDER observations in the oxygen A-band over ocean. Geophysical
Research Letters, American Geophysical Union, 1998, pp.3159-3162. �10.1029/98GL02324�.
�hal-00809107�
GEOPHYSICAL RESEARCH LETTERS, VOL. 25, NO. 16, PAGES 3159-3162, AUGUST 15, 1998
Apparent pressure derived from ADEOS-POLDER
observations in the oxygen A-band over ocean
C. Vanbauce, J.C. Buriez, F. Parol, B. Bonnel
LOA, Universit6 des Sciences et Technologies de Lille, 59655 Villeneuve d'Ascq, France
G. Sze
LMD, Universit6 de Jussieu, 75252 Paris, France P. Couvert
LSCE, Centre d'Etudes de Saclay, 91191 Gif-sur-Yvette, France
Abstract. The POLDER radiometer was on board the ADEOS satellite from August 1996 to June 1997. This instrument measures radiances in eight narrow spectral
bands of the visible and near infrared spectrum. Two of them are centered on the 02 A-band in order to infer
cloud pressure. By assuming the atmosphere behaves as a pure absorbing medium overlying a perfect reflector,
an "apparent" pressure Papp is derived from POLDER data. For validation purposes, Papp is first compared
to the sea-surface pressure Ps for clear-sky conditions;
Papp
is found to be close
to Ps (within •30 hPa) for
measurements in the sunglint region. For overcast con-ditions, Papp differs from the cloud-top pressure mainly
because of multiple scattering inside the cloud. When
Papp is compared to the cloud pressure determined from
brightness temperature measurements, large differences
are observed (typically 180 hPa).
Introduction
Yamamoto and Wark [1961] have suggested the use
of oxygen A-band absorption to infer cloud pressure.
Recently, some theoretical efforts [Fisher and Grassl,
1991; O'Brien and Mitchell, 1992; Ifuze and Chance,
1994] and aircraft measurements [Fisher et al., 1991]
have been carried out. All these studies have shown that the oxygen A-band is potentially efficient for de- termining the cloud-top pressure. They have also shown that the main difficulty lies in the photon penetration problem and the influence of ground reflectivity.
The POLDER (POLarization and Directionality of the Earth's Reflectances) IDeschamps et al., 1994] ra-
diometer has two spectral bands centered on the oxygen
A-band. It was launched on ADEOS (Advanced Earth Observing Satellite) in August 1996.
This paper presents first results of the apparent pres- sure derived from ADEOS-POLDER data by using a non-scattering model. This pressure is compared to the meteorological sea-surface pressure for clear-sky condi- tions and to the cloud pressure deduced from brightness temperature measurements for overcast conditions.
Copyright 1998 by the American Geophysical Union. Paper number 98GL02324.
0094-8534/98/98GL-02324505.00
Data ß
The POLDER instrument on ADEOS is described in
Deschamps et al. [1994]. It consists of a CCD matrix
detector, a rotating filter wheel and a wide field of view lens. When the satellite passes over a target, up to 14 different images are acquired in eight narrow spectral bands of the visible and near infrared spectrum.
The POLDER level I products processed by the
French Space Center (CNES) consist of calibrated radi-
ances at 6.2 km resolution. The level 2 and 3 products are split in three processing lines: "Earth Radiation
Budget (ERB) and clouds", "Ocean color and aerosols
over the ocean"," Land surfaces and aerosols over land".
The apparent pressure Papp is one of the outputs of
the "ERB and clouds" processing line. It is inferred from the differential absorption between the reflectances measured in the narrowband and wideband channels centered at 763 and 765 nm respectively. Practically,
Papp is calculated as a function of the oxygen transmis-
sion derived from these two reflectances after remov-
ing ozone and water vapor absorption (see Buriez et al. [1997] for further details). The gaseous transmissions
are based on line by line simulations using HITRAN'96
spectroscopic data bank [Rothman et al., 1998]. All
scattering effects are neglected and the atmosphere is 'assumed to behave as a pure absorbing medium over-
lying a perfect reflector located at pressure Papp. In
addition, the reflectance /•* that would be measured if
there was no absorption is derived by assuming it is the same in both channels. These calculations are made for every geographic pixel but the POLDER products cor- respond to means over super-pixels composed of 9 by 9
pixels (0.50 by 0.50 at the equator).
The interband calibration between the 763 nm and 765 nm channels is expected to be accurate within 1%
[Hagolle et al., 1997]; it corresponds to an absolute ac-
curacy of about 20 hPa on the retrieved pressure. The radiometric noise induces arms error varying from less
than 7 hPa for very bright scenes (/i•* > 50 %) to more than 60 hPa for very dark scenes (/i•* < 2 %); these
values are divided at most by 9 when averaging over a super-pixel. There are however additional uncertain- ties, mainly due to residual defaults in the stray light correction and in the multi-directional co-registration. The stray light strongly affects the dark scenes while co-registration errors concern scenes with high spatial or angular variability such as heterogeneous clouds and
3160 VANBAUCE ET AL.: APPARENT PRESSURE DERIVED FROM POLDER OBSERVATIONS
ocean in the sunglint direction. From these considera-
tions and comparison of values of the super-pixel appar-
ent pressure retrieved for slightly different viewing di- rections, the overall rms error due to all error sources is
estimated to vary from _< 30 hPa for very bright scenes
up to • 40- 60 hPa for very dark scenes.
POLDER data presented here were acquired dur- ing the 14 daily overpasses of ADEOS over ocean on November 10, 1996. These data are complemented by brightness temperature measurements from Meteosat
and by the sea-surface pressure and meteorological pro- files derived from the ECMWF (European Centre for Medium range Weather Forecasts) analysis.
Comparison to sea-surface pressure
First we are interested in the behavior of the appar-
ent presstire derived from POLDER measurements in
clear-sky conditions. We select the hilly clear-sky super- pixels by using a simple reflectance test. For each pixel and for each viewing direction, the clear-sky reflectance
•c•a• is estimated from radiative transfer
at 865 nm .... 8•s
simulations. A super-pixel is declared clear if the mea- sured reflectance •,,s6s + 0.02 for all the 81 pixels of the super-pixel and for each view- ing direction outside the expected region of the solar specular reflection delimited by a cone of half-angle of
30 ø. A more severe threshold (0 instead of 0.02).reduces
the number of selected clear cases but does not change significantly the following results.
For these clear-sky conditions, the POLDER appar-
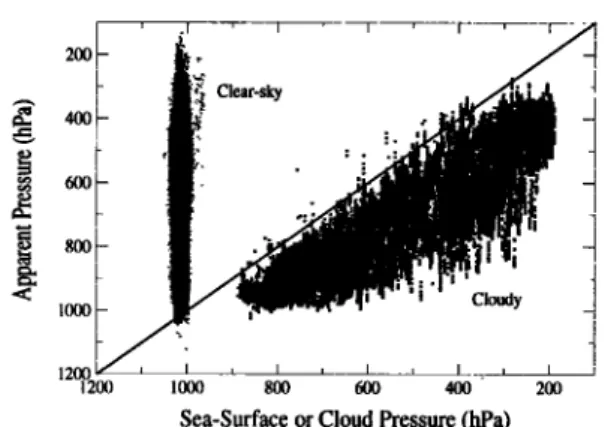
ent pressure Papp is compared to the sea-surface pres- sure P• (Figure 1). For the 78,364 selected cases, the
mean difference is - 412 hPa with a standard deviation
of 144 hPa. Not surprisingly, Papp is generally smaller than P•. Indeed, Papp must be equal to P• only when all
of the reflected radiation directly comes from the sea-
stirface. In the other cases, we would have to take into
account the atmospheric effects. In order to illustrate these effects, we consider a simple model where R* is the sum of the reflectances directly generated by molecular scattering, aerosol scattering and surface reflectance:
t:•* -- t:• m q- [•a q- [•s I'atm , (1)
where tatm stands for the atmospheric transmittance.
!000
t
1200
1200 1000
Sea-Surface or Cloud Pressure (hPa)
Figure 1. Comparison between the apparent pressure
Papp derived from POLDER and respectively (i) the me-
teorological sea-surface pressure P, for clear-sky pixels
and (ii) the cloud pressure P• derived from Meteosat
brightness temperature for cloudy pixels.
0 012 014 016 018 • Rm/R*
Figure 2. Difference between the apparent pressure and the sea-surface pressure versus the ratio between the calculated molecular reflectance and the measured total reflectance. 100%, 80% and 50% of the cases are situated within the isoline 1.0, 0.8 and 0.5 respectively. The theoretical curves correspond to an air-mass factor m = 3. Curve a corresponds to a clean atmosphere.
Curve b corresponds to a ratio between the aerosol re-
flectance and the molecular reflectance equal to 0.3 and a formation pressure equal to 50 hPa.
The reflectance affected by O2-absorption is formally
-[•* t(Papp)
-- /:•m
t(Prr,) q- •a t(Pa) q- •s tatrr,
t(Ps) (2)
where t(P) is the two-path oxygen transmission between the top-of-atmosphere and the pressure P. Writing a - Ra/R,• , (1) and (2) give
t(Papp)
-- t(P,)+{t(P,,) -- t(P,) + c•[t(Pa)
- t(Ps)]}
R*
(3)
The molecular reflectance R,• is easily calculable,
based on single-scattering approximation; it is typi-
cally • 1%. From line-by-line si•nulations for standard atmospheres, the pressure P,• is found to hardly de-
crease (from 470 to 440 hPa) when the air-mass factor
increases frmn 2 to 5. The aerosol reflectance R• and above all its associated pressure Pa are a lot more un- certain. The aerosol presstire values extend from about 50 hPa for stratospheric aerosol to more than 900 hPa for tropospheric aerosol.
Figure 2 reports the difference P, - P•pp versus the ra-
tio between the calculated molecular reflectance R,• and
the total reflectance R* inferred from POLDER mea-
surements. Two theoretical curves are also reported for
a typical air-mass factor m - 3. Curve a corresponds to a clean atmosphere (a - 0). Curve b corresponds
to an aerosol layer with a reflectance ratio a - 0.3 and
a formation pressure P• - 50 hPa. This curve b can
also be obtained for other conditions: for example P•
= 200 hPa but a - 0.38, or Pa - 900 hPa but a - 4.3.
However,
R,•/R* is strictly limited by 1/(l+ct) that is
0.77 for ct - 0.3 but only 0.19 for ct - 4.3.Of course, a fixed value of ct whatever the solar and viewing directions is unrealistic. Nevertheless, the com-
parison between the measurements and these theoreti-
cal curves leads to some remarks: the general trend of the observations is rather well represented by the the-
oretical curves. As expected, the measured difference
P, - P,•pp tends toward 0 when the contribution of the photons reflected by the atmosphere becomes negligi- ble. Deviations from the "mean" curve (not drawn) are
VANBAUCE ET AL.' APPARENT PRESSURE DERIVED FROM POLDER OBSERVATIONS 3161
mainly random, with a standard deviation increasing
from ~ 30 hPa to 70 hPa when R,•/R* increases.
On the average, the observations significantly de-
part from the theoretical clean atmosphere case (curve a). Tropospheric aerosol typically located between 800
and 1000 hPa cannot explain this bias which is ob-
served for large values of R,•/R*. It could be due to a stratospheric aerosol layer and/or a very tenuous cir-
rus cloud layer. The stratospheric aerosol contents de-
rived from SAGE (Stratospheric Aerosol and Gas Ex- periment) measurements are found to be nearly ten
times too small to explain such a bias. The frequent
occurrence of thin cirrus with reflectance on the order
of 1-2 % cannot be excluded but is questionable.
Besides an unlikely failure in the retrieval of the ap- parent pressure, another explanation could be in part
a slight bias in the stray light correction [Hagolle, pri- vate communication]. Fortunately, such a bias would
have a negligible effect in the case of bright clouds as considered in the following.
Comparison to Meteosat data
Now we are interested in the behavior of the apparent pressure in cloudy conditions. A super-pixel is declared
overcast if the condition R865 > 0.50 is satisfied for all
the 81 pixels of the super-pixel and for each viewing direction. A large threshold is chosen in order to privi- lege the clouds that are opaque in the Meteosat infrared channel and to avoid as far as possible the presence of partly cloud-filled pixels.
In this section, are only considered the cloudy pix-
els observed both from POLDER and from Meteosat
within +1/4 hour (some trials using GOES instead of Meteosat observations gives similar results). Three
ADEOS orbits are concerned on November 10, 1996. For each selected super-pixel, a pressure Pc is derived
from the brightness temperature measured in the 11 ttm channel of the geostationary satellite by using meteoro- logical profile. Disregarding errors chiefly caused by uncertainties in temperature profile, the pressure Pc is close to the cloud-top pressure when the cloud is
opaque. Note however that the auxiliary atmospheric
data archived with the POLDER products are given for only eight pressure levels, namely 180, 310, 440, 560,
680,800, 1000 hPa and the surface level. Therefore the well-known inversion observed near the top of the stra-
tocumulus clouds may be missed in these data; it can result in a large error in the derivation of the cloud pres: sure from the observed temperature. In the following,
results are thus to be considered cautiously in the case of low-level clouds.
The comparison between the 5Ietcosat cloud pres-
sure Pc and the POLDER apparent pressure Papp is
reported in Fig. 1. For the 32,471 selected cases, the mean difference is 184 hPa with a standard deviation of 87 hPa. As the reflectance threshold is large enough, no significant variation of the difference as a function of
the reflectance is observed. A slight variation of Papp
with the air-mass factor m is noted. Each super-pixel is observed under several directions to which correspond
different values of m; on average, OPapp/Orrt •- 65 hPa. As expected from theoretical considerations [e.g., Wu,
1985],
P, pp is now larger
than Pc. Simulations
using
the
Discrete Ordinate Method [Starnmes et al., 1988] were
performed for various cloudy situations and various so- lar illumination and viewing conditions. Some exam-
2OO 4OO 1000 i i i i
•High
cloud
•
- f
ß
(c) -
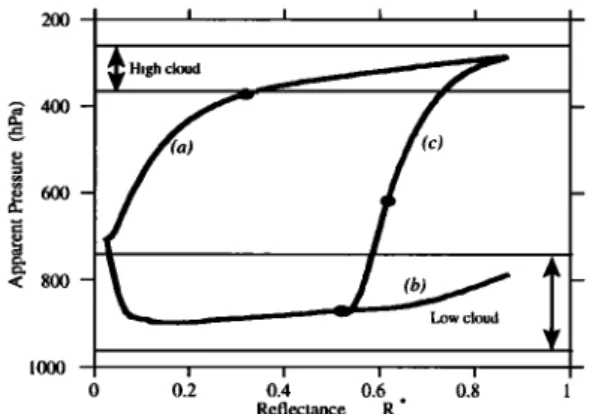
_ I I I I 0 0.2 0.4 0.6 0.8 1 Reflectance R *Figure 3. Theoretical curves of the apparent pressure
as a function of the reflectance for mono-layered clouds
(curves a and b) and for a multi-layered cloud system (curve c) abo,ve the ocean. All the clouds are 2 km thick.
In cases a and b, the cloud optical thickness varies from 0 to 500. In case c, the high-level cloud optical thickness
varies from 0 to 500 while the low-level cloud optical thickness is fixed to 16. The dots correspond to an
optical thickness of 16 for both the low and the high cloud. The viewing and the solar angles are 0 ø and 600 respectively.
ples are reported in Figure 3. Clouds are assumed to be homogeneous plane-parallel layers. The microphysi- cal model for low-level clouds is a distribution of liquid
water drops with an effective radius of 10 ttm [Hansen and Travis, 1974]. High-level clouds are assumed to be composed of hexagonal ice plates with dimensions L/2R = 15 ttm/300 ttm [Brogniez ½t al., 1995]. In Fig. 3, the
cloud optical thickness 5 varies from 0 to 500. As noted
previously, P, pp differs notably from P, when 5 = 0.
The apparent pressure does not correspond to the
cloud top because of multiple scattering inside the cloud. This photon penetration effect remains significant even for cloud optical thickness larger than 100. From many simulations such as those reported in Fig. 3, it appears that for single cloud layers with a typical reflectance value of 50 %, the apparent pressure is generally slightly
larger than the mean cloud pressure (i.e. rather toward the cloud bottom than toward the cloud top).
In the case of multi-layered cloud systems, the differ- ence between the apparent and the cloud top pressure
is amplified (curve c in Fig.3). Indeed, a large part of
the reflected radiation can come from the lower cloud layer. That can explain very large differences between the POLDER apparent pressure and the pressure derived from thermal infrared channels. Note that the brightness temperature technique also can overestimate
the cloud-top pressure in case of multiple cloud layers
if so, the difference between the apparent and the true
cloud-top pressure would be still larger than P, pp -
Note that our simulations agree with the observed
variation of the photon penetration with the air-mass
factor. Typically, we found OP, pp/Om •- 30 hPa and
- 80 hPa for single and two-layered clouds respectively,
to be compared to the observed - 65 hPa. Conclusion
The first results of the apparent pressure P•pp derived
from ADEOS-POLDER data have been presented. They only concern oceanic situations. Over land, the inter-
3162 VANBAUCE ET AL.: APPARENT PRESSURE DERIVED FROM POLDER OBSERVATIONS
pretation of the apparent pressure is even more com- plicated because the surface reflectivity can present a
large spectral variability IBrdon and Bouffi•s, 1996].
Under clear-sky conditions, the apparent pressure
tends toward the sea-surface pressure (within ~30 hPa)
when the contribution of the photons reflected by the atmosphere becomes negligible. Outside the sunglint
regiofi, the sea-surface reflectivity is very weak and the
apparent pressure is thus highly dependent on the at- mosphere composition; the presence of a high-level scat- tering layer, even very tenuous, can have a significant impact on the measure of the apparent pressure.
Under cloudy conditions, the apparent pressure is greater than the cloud top pressure because of the effect of surface reflectivity and multiple scattering inside the cloud. The measured difference between the POLDER apparent pressure and the cloud top pressure derived from infrared measurements is on the average 180 hPa. Such a difference appears rather large for single cloud layers. However, there is often occurrence of both low
and high clouds [Warren el al., 1988]. In this case, very
large differences can arise even when the high cloud ap- pears opaque in the thermal infrared window.
Some doubt remains concerning the spectroscopic data and the modeling of the apparent pressure based
on line-by-line calculations [Kuze and Chance, 1994; Chance, 1997]. However, forcing the adjustment be-
tween the average of the clear-sky observations and the
clean-sky simulations (curve a in Fig. 2) would increase
the observed differences between the cloud top and the
apparent pressure.
The POLDER apparent pressure is thought to be use- ful for discriminating clear and cloudy pixels and for deriving the cloud pressure. These first results outline that the use of the apparent pressure in the cloud de- tection has to be made with precautions. For cloudy scenes, even when the sea-surface reflectivity effect is negligible, the apparent pressure is not the cloud top pressure. Its comparison with the actual cloud top pres-
sure (or at least the cloud top derived from thermal infrared measurements) is expected to contain informa-
tion about the cloud vertical structure. More studies are needed in order to extract this information that could be very useful particularly for the derivation of surface thermal fluxes from satellite observations.
Acknowledgments. This work was supported by CNES, R•gion Nord-PdC, EEC and Prefecture du Nord through EFRO. Meteorological and Meteosat data were pro- vided by M•t•o-France. The authors thank C. Brogniez for processing the SAGE data provided by NASA LaRC and F.M. Br{}on and O. Hagolle for helpful discussions.
References
Brogniez, G., J.C. Buriez, V. Giraud, F. Parol, and C. Vanbauce, Determination of effective emittance and ra- diatively equivalent microphysical model of cirrus from ground-based and satellite observations during the Inter- national Cirrus Experiment: The 18 October 1989 case study, Mon. Wea. Rev., 123, 1025-1036, 1995.
Buriez, J.C., C. Vanbauce, F. Parol, P. Goloub, M. Her- man, B. Bonnel, Y. Fouquart, P. Couvert, and G. Size, Cloud detection and derivation of cloud properties from POLDER, Int. J. Remote Sensing, 18, 2785-2813, 1997. Chance, K.V., Improvement of the 02 A-band spectroscopic
database for satellite-based cloud detection, J. Quant. Spectrosc. Radiat. Transj•er, 58 no. 3, 375-378, 1997. Deschamps, P.Y., F. M. Br•on, M. Leroy, A. Podaire, A.
Bricaud, J.C. Buriez, and G. S•ze, The POLDER mission: Instrument characteristics and scientific objectives, IEEE
Trans. Geosci. Rein. Sens., 32, 598-615, 1994.
Fisher, J., and H. Grassl, Detection of cloud-top height from
backscattered radiances within the 02 A-band. Part 1:
Theoretical study, J. Appl. Meteor., 30, 1245-1259, 1991. Fisher, J., W. Cordes, A. Schmitz-Peiffer•. W. Renger, and P. MSrl, Detection of cloud-top height from backscattered radiances within the 02 A-band. Part 2: Measurements, J. Appl. Meteor., 30, 1260-1267, 1991.
Hagolle, O., P. Goloub, P.Y. Deschamps, T. Bailleul, J.M. Nicolas, Y. Fouquart, A. Meygret, J.L. Deuz•, M. Her- man, F. Parol, and F.-M. Br•on, Results of POLDER in-flight calibration. In Sensors Systems and Next Gener- ation Satellite III, Proc. SPIE 3221, 1997.
Hansen, J.E., and L. D. Travis, Light scattering in planetary atmospheres, Space Sci. Rev., 16, 527-610, 1974.
Kuze, A., and K.V. Chance, Analysis of cloud top height and cloud coverage from satellites using the 02 A and B bands, J. Geophys. Res., 99, 14481-14492, 1994.
O'Brien, D.M., and R. M. Mitchell, Error estimates for re- trieval of cloud-top pressure using absorption in the A band of Oxygen, J. Appl. Meteor., 31, 1179-1192, 1992. Rothman, L.S., C.P. Rinsland, A. Goldman, $.T. Massie,
D.P. Edwards, J.-M. Flaud, A. Pertin, C. Camy-Peyret, V. Dana, J.-.Y. Mandin, J. Schroeder, A. McCann, R.R. Camache, R.B. Wattson, K. Yoshino, K. Chance, K. Jucks, L.R. Brown, V. Nemtchinov, and P. Varanasi, The HITRAN Molecular Spectroscopic Database and HAWKS: 1996 Edition, to be submitted to J. Quant. Spec- trosc. Radiat. Transfer, 1998.
Stamnes, K., S.C. Tsay, W. Wiscombe, and K. Jayaweera, Numerically stable algorithm for discrete-ordinate- method radiative transfer in multiple scattering and emit- ting layered media, Appl. Opt., 27, 2502-2509, 1988. Warren, S.C., C.J. Hahn, J. London, R.M. Chervin, and
R.L. Jenne, Global distribution of total cloud cover and cloud type amounts over the ocean, NCAR Tech. Note TN-3174-STR/DOE Tech. Rep. ER-OJ06, 212 pp., 1988. Wu, M.C., Remote sensing of cloud-top pressure us- ing reflected solar radiation in the Oxygen A-band, J.
Clim. Appl. Meteor., ϥ, 539-546, 1985.
Yamamoto,
G., and D. Q. Wark, Discussion
Of the l•tter
by R.A. Hanel: "Determination of cloud altitude from a satellite", J. Geophys. Res., 66, 3596, 1961.
Br•on, F. M., and S. Bouffi•s, Land surface pressure es- timate from measurements in the oxygen A absorption