Analysis of Acoustic Cues for
Identifying the Consonant /o/ in Continuous Speech
by
Ying Alisa Cao
Submitted to the Department of Electrical Engineering and Computer Science
In partial fulfillment of the requirements for the degree of
Master of Engineering in Electrical Engineering and Computer Science
at the
MASSACHUSETTS INSTITUTE OF TECHNOLOGY
June 13, 2002
Copyright @2002 Ying Alisa Cao. All Rights Reserved.
The author hereby grants to M.I.T. permission to reproduce and distribute publicly paper and electronic copies of this thesis and to grant others the right to do so.
A uthor ...
...
-
F-
i
Depu
En
cience
June 13, 2002
Certified by ...
Kenneth N. Stevens
Professor, Research Laboratory for Electronics
Thesis Supervisor
Accepted by ...
-
%
irhur
C.
Smith
Chairman, Department Committee on Graduate Theses
OF TECHNOt96Y
Analysis of Acoustic Cues for
Identifying the Consonant /o/ in Continuous Speech
by Ying Alisa Cao
Submitted to the Department of Electrical Engineering and Computer Science June 13, 2002
in partial fulfillment of the requirements for the degree of Master of Engineering in Electrical Engineering and Computer Science
Abstract
This project aims to advance automatic recognition of continuous speech by recognizing individual phonemes in speech using acoustic cues unique to each phoneme. This project focuses on studying the acoustic characteristics of one of the most prevalent phonemes of English-the fricative consonant /6/, as in word the, this, those, etc. Since previous research has shown that /6/ can assimilate to its preceding phoneme, characteristics of /6/ and its close-sounding phonemes, /n/, /d/, and /v/, are studied in the preceding context of nasal consonant, stop consonant, and vowel, respectively. Through examining characteristics of /6/ and its counterparts in phrases such as win
those and win nose, the goal is to find the contextual-based and invariant cues for identifying /6/.
Spectrum analysis tools are used to extract important acoustic information such as the formant frequencies and their changes over time, the energy distribution over frequencies, and the duration of utterances. In the context of a nasal consonant, F2 and the change in F2 over a fixed interval of time (DeltaF2) are found to be the best cues: /6/ has lower F2 and higher DeltaF2 than /n/. In the context of stop consonant, F2 and amplitude difference in the noise burst between the high and low frequency ranges are the best cues: /6/ has lower F2 and a more negative amplitude difference. In the context of vowels, F3 and DeltaF3 are found to be the best cues: /6/ generally has higher F3 and DeltaF3 than /v/, although they are not as reliable as the cues of the other two contexts. The formant frequencies are greatly influenced by the speaker's gender and the succeeding vowel, and they vary among speakers of the same gender. Thus, the more contextual and speaker information the identification criteria are based on, the more accurate the identification of /6/ is likely to be. This correlation suggests human's auditory system is likely to also rely on contextual information for the accurate processing of continuous speech.
Thesis Supervisor: Kenneth N. Stevens, Sc.D.
Title: Clarence J. Lebel Professor of Electrical Engineering, Research Laboratory for Electronics
Acknowledgments
My heartfelt gratitude goes to Professor Kenneth Stevens, for giving me this valuable
learning experience to engage in research and scientific writing, for personally guiding me through
the entire process, for his patience and understanding, and for his care and concerns for my
well-being.
I would like to thank my friends at MIT who have given me many warm and joyous
memories and who have helped me immensely in all aspects of my life in the past five years.
I also want to thank my parents who have worked hard and sacrificed much to provide me with the best education and much more.
Lastly, even though this thesis hardly measures up to all that I have received from them, I
would like to dedicate this thesis to my grandparents. They, too, have sacrificed much to give me
the best opportunities, and they gave me a wonderful childhood from which I draw faith and
confidence. Their sincerity, work ethic, simple living, dedication toward family, and service to
Table of Contents
I: Introduction ...
12
i 1 M o tiva tio n ... 12
1. 2 B ackground Inform ation ... 13
1.3 P relim in ary W ork ... 15
1. 4 R esearch O bjectives ... 1 7
II: M ethodology...
18
II. O v erv ie w ... 1 8 e.2 D a ta b a se ... 18
.3 P aram eters A nalyzed ... 20
11.3.1 Second and Third Formant Frequencies at the Onset of the Succeeding Vowel (F2 and F 3 )...2 0 11.3.2 Change of 2 and f3 Over a Period of 50 ms (DeltaF2 and DeltaF3)...22
11.3.3 Amplitude Difference (Amp(High-Mid)) and Duration of Burst of /6/ and /d/...23
III: Results and Analysis...
26
II.1 Context of Nasal Consonant ... 26
111.1.1 Second vs. Third Formant Frequencies (F2 vs. F3)... 26
111.1.2 Second Formant at the Onset of the Succeeding Vowel (F2)...27
111.1.3 Movement of f2 Over a Period of 50 ms (DeltaF2)... 32
111.1.4 F 2 and D eltaF 2 ... 33
111.2 Context of Stop Consonant ... 38
111.2.1 Second vs. Third Formant Frequencies (F2 vs. F3)... 38
111.2.2 The Second Formant Frequency at the Onset of the Succeeding Vowel (F2)...38
111.2.3 Amplitude Difference In The Burst (Amp(High-Mid))... 40
111.2 .4 B urst D uration ... 4 1 111.2.5 F2 and Amp(High-Mid)... 42
I I.3 C on tex t of Vow el...4 6 111.3.1 Second vs. Third Formant Frequencies (F2 vs. F3)... 46
111.3.2 Third Formant Frequency at the Onset of the Succeeding Vowel (F3)...46
111.3 .3 F 3 and D eltaF 3 ... 47
IV: Conclusion and Future W ork...52
I V . C o n c lu s io n ... 5 2I V 2 F u tu re W o rk ... 5 4
V. References ...
57
VI. Appendices...58
Appendix A: Sentences Used in the Study...58
Appendix B : A dditional R esults ... 60
Appendix B. 1 Context of Nasal Consonant...60
List of Figures
Figure 1-1: a) An example spectrogram, b) An example output of formant tracks extracted by xkl. Note that this thesis denotes the second and third formant frequencies with lowercase "f', as "f2" and "f3", and denotes the second and third formant frequencies at the onset of the
succeeding vowel with uppercase "F", as "F2" and "F3."... 15
Figure 1-2: An idealized spectrogram and the important acoustic features measured in the
prelim in ary stu dy ... 16
Figure 1-3: Three commonly observed patterns in the second and third formant frequencies of /6/ an d /v /. ... 16
Figure 1-4: Example of a combination (F3 and -F3) that separates /6/ and /v/. Notice that a line representing some differentiation criteria can be drawn and would separate all utterances of /6/ from th o se of /v/...17
Figure 2-1: A male speaker's waveform of the utterance "V" in "TV" (Sentence #12). The changes in the waveform at around 224 ms indicate the onset of the vowel... 21
Figure 2-2: An example spectrum showing auto-picked value of F3 (the dotted vertical line) by xkl. ... 2 2 Figure 2-3: Spectra of the burst of a) /6/ vs. b) /d/, of a female speaker. Notice that a prominent
peak at around 4.7 kHz is seen in the spectrum of /d/ but not in that of /6/. ... 23
Figure 2-4: Sample waveforms of a) /6/ and b) /d/. In each waveform, the two vertical lines represent the points of waveform change, and the time in between the lines is the duration of th e b u rst...2 5
Figure 3-1: The mid-sagittal view of the vocal track for /6/, /n/, and /d/ [5]. The back cavity is more restricted for /6/, the difference that leads to a lower F2 for /6/ than for /n/ and /d/. ... 29
Figure 3-2: The average and standard deviations of F2 of /6/ vs. /n/ in nasal context of female speakers, given the succeeding vowel /o/. Notice that the F2 ranges of /6/ and /n/ do not
ov erlap . ... 3 0
Figure 3-3: The average and standard deviations of F2 of /6/ vs. /n/ in nasal context of male
speakers, given the succeeding vowel /o/. Notice the slight overlap between the two F2 ranges. ... 3 0
Figure 3-4: F2 and DeltaF2 of /6/ vs. /n/ in nasal context of female speakers, regardless of the succeeding vowel. Notice that it is impossible to draw a line such that /6/ points would be on one side and /n/ points on the other. ... 35
Figure 3-5: F2 and DeltaF2 of /6/ vs. /n/ in nasal context of male speakers, regardless of the succeeding vowel. Notice that it is impossible to draw a line such that /6/ points would be on one side and /n/ points on the other. ... 35
Figure 3-6: F2 and DeltaF2 of /6/ vs. /n/ in nasal context of female speakers, given succeeding v ow el /i/. ... 3 6
Figure 3-7: F2 and DeltaF2 of /6/ vs. /n/ in nasal context of individual female speakers, a) F#l, b) F#2, given succeeding vowel /i/. /6/ and /n/ are more distinctly separated for each individual speaker than for both speakers (Figure 3-6). ... 36
Figure 3-8: F2 and DeltaF2 of /6/ vs. /n/ in nasal context of female speakers, given succeeding vowel /o/. Notice that /6/ and /n/ occupy different ranges of F2 but not of DeltaF2...37
Figure 3-9: F2 and DeltaF2 of /6/ vs. /n/ in nasal context of individual female speakers, a) F#1, b) F#2, given succeeding vowel /o/. /6/ and /n/ are more distinctly separated for each individual speaker than for both speakers (Figure 3-8). ... 37
Figure 3-10: The average and standard deviations of F2 of /6/ vs. /d/ in stop context of female speakers, given the succeeding vowel /o/. Notice that the F2 of /6/ is significantly lower than th at o f /d /...3 9
Figure 3-11: The average and standard deviations of F2 of /6/ vs. /d/ in stop context of male
speakers, given the succeeding vowel /o/. Male speakers show similar trend as female speakers do . (F igure 3-10)...39
Figure 3-12: F2 and amplitude difference of /6/ vs. /d/ in stop context of female speakers. Notice that /6/ and /d/ are clearly separated by both F2 and amplitude difference...43
Figure 3-13: F2 and amplitude difference of /6/ vs. /d/ in stop context of male speakers. Unlike in the similar plot for female speakers (Figure 3-12), the regions of /6/ and /d/ overlap slightly for th e m ale sp eak ers...43
Figure 3-14: F2 and amplitude difference of /6/ vs. /d/ in stop context of individual female speakers a) F#1, and b) F#2. Notice that regions of /6/ and /d/ are clearly and consistently separated in b oth sp eak ers...44
Figure 3-15: F2 and amplitude difference of /6/ vs. /d/ in stop context of individual male speakers a) M# 1, b) M#2. /6/ and /d/ are more distinctly separated for each individual speaker than for both speakers (Figure 3-13) ... 44
Figure 3-16: F3 and Delta F3 of /6/ vs. /v/ in vowel context of a) female speakers, b) male speakers, given succeeding vow el //...50
Figure 3-17: F3 and Delta F3 of /6/ vs. /v/ in vowel context of a male speaker a) M#1, b) M#2 given succeeding vowel /i/. /6/ and /v/ are more distinctly separated for each individual
speaker than for both speakers (Figure 3-16b). ... 50
Figure 3-18: F3 and Delta F3 of /6/ vs. /v/ in vowel context of a female speaker a) F#1, b) F#2 given succeeding vowel /i/. /6/ and /v/ remain difficult to separate even when the speakers are analyzed individually...50
Figure 3-19: F3 and Delta F3 of /6/ vs. /v/ in vowel context of a male speaker a) M#1, b) M#2 in two pairs of sentences succeeded by similar vowels (/o/ and //). Notice the large variations in both F3 and D eltaF3 of /6/ and /v/. ... 51
Figure 3-20: F3 and Delta F3 of /6/ vs. /v/ in vowel context of a male speaker (M#1) a) in sentences #3 and #11 (succeeded by vowel /c/) b) in sentences #5 and #16 (succeeded by vowel /D/).
Notice the significant differences in F3 and DeltaF3 of both /6/ and /v/ between the two plots. ... 5 1 Figure 3-21: F3 and Delta F3 of /6/ vs. /v/ in vowel context of a male speaker (M#2) a) in sentences
#3 and #11 (succeeded by vowel /c/) b) in sentences #5 and #16 (succeeded by vowel /;/).
Notice similar decreases in F3 and DeltaF3 of both /6/ of /v/ are seen in graph b) as in Figure 3 -2 0 b ... 5 1 Figure A-1: F2 and DeltaF2 of /6/ vs. /n/ in nasal context of male speakers, given succeeding vowel
/i/. Notice that the regions of /6/ and /n/ overlap. ... 60
Figure A-2: F2 and DeltaF2 of /6/ vs. /n/ in nasal context of individual male speakers a) M#1, b) M#2, given succeeding vowel /i/. Notice that /6/ and /n/ are less separable for these males speakers than they are for females speakers (Figure 3-7)... 60
Figure A-3: F2 and DeltaF2 of /6/ vs. /n/ in nasal context of male speakers, given succeeding vowel /o /. ... 6 1
Figure A-4: F2 and DeltaF2 of /6/ vs. /n/ in nasal context of individual male speakers a) M#1, b) M#2, given succeeding vowel /o/. Notice that /6/ and /n/ become more separable (mostly by F2) for each individual speaker than for both speakers (Figure A-3), but the separation is not as distinct as in similar plots for the female speakers (Figure 3-9). ... 61
Figure A-5: The average and standard deviation of F3 of /6/ vs /v/ in vowel context of a) female speakers, b) male speakers, regardless of the succeeding vowel...62
Figure A-6: The average and standard deviation of F3 of /6/ vs /v/ in vowel context of a) female speakers, b) male speakers, given succeeding vowel /i/...62
Figure A-7: The average and standard deviation of F3 of /6/ vs. /v/ in vowel context, given succeeding vowel /i/, of an individual male speaker (M#1). Notice that the overlap becomes significantly reduced for a given speaker than for both male speakers (Figure A-6b)...62
Figure A-8: F3 and Delta F3 of /6/ vs. /v/ in vowel context of a) male, b) female speakers in two pairs of sentences succeeded by similar vowels (/3/ and /r/). Notice the wide ranges of F3 and D eltaF3 for both /6/ and /v/... 63
Figure A-9: F3 and Delta F3 of /6/ vs. /v/ in vowel context of a female speaker a) F#1, b) F#2 in two pairs of sentences succeeded by similar vowels (/3/ and /0/). Notice the large variations in both F3 and D eltaF3 of /6/ and /v/... 64
Figure A- 10: F3 and Delta F3 of /6/ vs. /v/ in vowel context of a female speaker (F# 1) a) in
sentences #3 and #11 (succeeded by I1/) b) in sentences #5 and #16 (succeeded by /o/)...64 Figure A- 11: F3 and Delta F3 of /6/ vs. /v/ in vowel context of a female speaker (F#2) a) in
sentences #3 and #11 (succeeded by vowel //) b) in sentences #5 and #16 (succeeded by vowel /3/). Notice the differences in F3 and especially in DeltaF3 between the two plots,
similar to those seen in the other speakers (Figure A-10, 3-20, 3-21)...64
Figure A-12: F3 and Delta F3 of /6/ vs. /v/ in vowel context of a) female speakers, b) male
speakers, given succeeding vow el /o/... 65
Figure A-13: F3 and Delta F3 of /6/ vs. /v/ in vowel context of individual female speakers a) F#1, b) F#2, given succeeding vowel /o/. Notice /6/ and /v/ are mixed in the same region...65 Figure A-14: F3 and Delta F3 of /6/ vs. /v/ in vowel context of individual male speakers a) M#1, b)
M#2, given succeeding vowel /o/. Notice /6/ have higher F3 and lower DeltaF3 than /v/--the same general pattern is see in A-13, despite its exceptions in individual enunciations. ... 65
Figure A-15: F3 and Delta F3 of /6/ vs. /v/ in vowel context of a) female, b) male speakers, given succeeding vow el /a /...66
Figure A-16: F3 and Delta F3 of /6/ vs. /v/ in vowel context of individual speakers a) F#1, b) F#2, c) M#1, and d) M#2, given succeeding vowel /w/. Notice that only c) shows clear distinction between /6/ and /v/. The average values of /6/ and /v/ of each plot, however, consistently show that /6/ has higher F3 and lower DeltaF3 than /v/... 66
Figure A-17: F3 and Delta F3 of /6/ vs. /v/ in vowel context of a) female, b) male speakers given succeeding vowel /I/. Notice /6/ tend to have higher F3 than /v/, but their DeltaF3 values tend to be in the sam e range. ... 67
Figure A- 18: F3 and Delta F3 of /6/ vs. /v/ in vowel context of individual speakers a) F# 1, b) F#2, c) M#1, d) M#2, given succeeding vowel /I/. Neither parameter is very effective at separating /6/ from /v/. In general, F3 is higher in /6/. The average DeltaF3 of /6/ seems slightly higher than that of /v/, which is an exception to the trend of DeltaF3 observed for the rest of the v ow els...6 7
List of Tables
Table 2-1: The contexts, close-sounding consonants, succeeding vowel, and phrases studied in the project. The underlined segments are the parts of the phrases analyzed in detail...19
Table 2-2: Number of utterances analyzed in the study for each context. ... 20
Table 3-1: F2 and F3 of /6/ vs. /n/ in the nasal context, listed by speakers and vowels. Notice that the corresponding F2 of /6/ is less than that of /n/ for all cases, but F3 does not show such consistency (the asterisks mark cases of inconsistency). Thus F2 is further analyzed...27
Table 3-2: Average F2 values for /6/ vs. /n/ in the nasal context, listed by gender and succeeding vowel. Notice that F2 varies according to gender and the succeeding vowel, but F2 of /6/ is always lower than the corresponding F2 of /n/... 27
Table 3-3: Average DeltaF2 of /6/ vs. /n/ in nasal context, listed by speaker and succeeding vowel. The average DeltaF2 is positive for utterances succeeded by /o/ and negative for those by /i/. DeltaF2 of /6/ is greater than that of /n/ in all cases. ... 32
Table 3-4: Average F2 values for /6/ vs. /d/ in stop context, listed by gender. Notice that F2 is higher in /d/ than in /6/. Note that for /6/ and /d/ only succeeding vowel /o/ is examined...38
Table 3-5: Amplitude difference between the high and mid frequency ranges of /6/ vs. /d/ in stop context, listed by speaker and enunciation. Notice /6/'s amplitude difference is usually
negative and is less than that of /d/ in almost all cases... 40
Table 3-6: Burst duration of /6/ vs. /d/ in stop context, listed by each speaker. Notice that no
consistent difference is seen between the burst duration of /6/ and /d/ across all speakers...41
Table 3-7: Average F2 and amplitude difference between high and mid frequency ranges of /6/ vs. /d/ in stop context, listed by gender. Notice that F2 is substantially lower in /6/ than in /d/ and Amp(High-Mid) is negative for /6/ but positive for /d/...42
Chapter I: Introduction
1.1 Motivation
Progress in the intense study of acoustics and speech recognition in the past century has
manifested in automatic speech recognition software such as SUMMIT used in the MIT-developed
Jupiter weather information system. Jupiter, in particular, has been achieving response accuracy of
about 90% for novice users and over 98% for experienced users [1]. Such software, however, has a
limited domain of acceptable queries, set by the limited number of recognized words; Jupiter can
only recognize about 2000 words. This limited scope of recognition is a result of the algorithm of
the speech recognition units, such as SUMMIT, which recognize words in the queries by matching
key segments of the speech signals with a pre-stored database of phonemes [1]. This kind of search
and match algorithm makes real-time recognition of continuous speech impractical, both in terms
of size limitations of the pre-stored library of vocabulary and the computation power currently
available to run such an algorithm.
In light of such limitations, this study is not interested in advancing automatic speech
recognition by looking for ways to reduce the limitations of the search and match algorithm
mentioned above, but by finding sets of acoustic cues that can unambiguously identify individual
phonemes in continuous speech. This study examines the spectral characteristics of phonemes and
aims to incorporate these characteristics into algorithms that computers can use to achieve
automatic phoneme recognition. In the process, the goal is to gain further understanding of how the
human perceptual system processes, identifies, and differentiates between similar-sounding
phonemes. In addition to building better recognition tools that can potentially identify every
phoneme in continuous speech, this research can also contribute to the development of
computer-based methods for transforming spoken speech into its written form. Such a function would be
highly valuable in a number of applications, such as taking notes for deaf and hard-of-hearing individuals.
1.2 Background Information
This project focuses on finding the acoustic characteristics of /6/ for two main reasons.
First, /6/ is one of the most common phonemes in English [2]. Because /6/ is found in common
function words such as they, them, those, then, and the etc, it is the 7th most frequent consonant in
spoken English and the most frequent consonant in word-initial position. Because function words
could be important for extracting the meaning of sentences, it is important to be able to recognize
intended /6/ in natural speech. Second, because /6/ is usually found at the same location, at the
beginning of words, /6/ is easier to study.
/6/ is a voiced fricative with weak noise, and is produced by air turbulence created when air
from the lungs is forced through the vocal tract constriction formed by the tongue and the teeth [3].
/6/ is generally unstressed, as in see the ball, but it can also be stressed, as in see that ball. As
mentioned, /6/ is often found at beginning of words, but it can also be found in middle of words,
such as bother, father, weather; and in end of a few words, such as seethe, bathe, and teethe [4].
Some recent research in consonants in varied contexts that occur in normal speech has
shown that the acoustic features of phonemes vary according to the identity of adjacent phonemes
auditory system may identify /6/ based on one of several different sets of cues, depending on the
perceived context. At the same time, given that our auditory system can recognize intended /6/ in
various contexts as /6/, it is possible that there exist a set of invariant acoustic cues for speech
perception--characteristics that are common of /b/ in all contexts. Since our purpose is to find such
invariant and context-dependent cues, characteristics of /6/ are analyzed in various contexts.
Spectral characterization of /6/ preceded by nasal consonants has already been studied for
/n/ [4]. The research found that /6/ assimilates and becomes nasalized when preceded by /n/, i.e. the
entire consonant region in the spectrogram of /6/ shows characteristics like those found in /n/. At
the same time, acoustic evidence suggests that contextually-nasalized /6/ retains its dental place of
articulation [4]. This evidence is based on the second formant frequency (f2) in the following
vowel. F2 is considerably lower at the release of contextually-nasalized /6/ than at the release of a
true /n/. Furthermore, listeners can generally tell the difference between natural tokens of win nose
and win those, even when /6/ is completely nasalized [4]. And when synthetic stimuli were
constructed in which signals differed only in F2 near the nasal consonant region of win nose and
win those, listeners systematically reported hearing the latter more often when F2 was low at the
release of the nasal consonant [4]. These results are consistent with the claims in literature that
despite contextual assimilation, listeners can recognize the intended phoneme [3]. Finding the
acoustic cues that help listeners to recognize all of the contextually modified /6/ as the same
phoneme is the objective of this research.
To achieve this objective, this study first analyzes characteristics of /6/ in isolated
enunciation of vowel-consonant(fricative)-vowel (VCV) combinations by comparing the
spectrogram of /6/ to that of its two closest phonemes, /v/ and /z/. It then proceeds to examine /6/ in
a variety of contexts in sentence material.
1.3 Preliminary Work
Preliminary characterization has been done for the spectrograms of fricatives /6/, /z/, and /v/
that occur in isolated vowel-fricative-vowel (VCV) combinations containing the vowels /a/, /x/, /e/,
/i/, and /u/.
The fricative /z/ has visible high frequency content in its spectrogram that is not found in
the spectrograms of /6/ and /z/. Thus, /z/ can easily be differentiated from the other two fricatives,
and efforts are subsequently focused on finding the more subtle spectral differences between /6/
and /v/. To do so, a program called
xkl
is used to extract frequency information from the original
spectrogram. (See Figure 1-1). An idealized spectrogram illustrating the features of /6/ and /v/ that
are measured and compared is displayed in Figure 1-2.
0 I kHz 7-4 23 ...-r~0.
a)
b
0
200 300 400 50 T TIME Time (ms)Figure 1-1: a) An example spectrogram, b) An example output of formant tracks extracted by
xkl.Note that this thesis denotes the second and third formant frequencies with lowercase "f", as "f2"
and "f3", and denotes the second and third formant frequencies at the onset of the succeeding vowel
with uppercase "F", as "F2" and "F3."
Onset of Fricative Release of Fricative
I I
Vowel(V) Fricative(C) Vowel(v)
-13 F3
fcativ dutatioh
-Fl El1
fi
Time (Ms)
Figure 1-2: An idealized spectrogram and the important acoustic features measured in the preliminary study.
The parameters measured include +F1, +F2, +F3, -F1, -F2, -F3, +Slope of F2, +Slope of F3,
-Slope of F2, -Slope of F3, and fricative duration. The most useful parameter for differentiating /6/
and /v/ turns out to be +F3. F3 values of /6/ are greater than those of /v/ in all of the CVC
enunciations studied. The rest of the parameters can also be useful in differentiating between /6/
and /v/, especially when the context is known.
Three common patterns of movements of F2 and F3 are observed, as shown in Figure 1-3.
dh dl
Time (ns) Time (ns) Time (ns)
Figure 1-3: Three commonly observed patterns in the second and third formant frequencies of /6/ and /v/.
Furthermore, using combinations of parameters, /6/ and /v/ can be distinguishable in a number of
utterances, but not in all. Figure 1-4 shows an example of a combination of characteristics that are
successful in distinguishing /6/ and /v/.
2600- 2500-2400- A S2300 - adh 2200-2100- Au 200 0 * * , * 2000 2100 2200 2300 2400 2500 2600 2700 F3
Figure 1-4: Example of a combination (F3 and -F3) that separates /6/ and /v/. Notice that a line
representing some differentiation criteria can be drawn and would separate all utterances of /6/
from those of /v/.
1.4 Research Objectives
The objective of the project is to apply the methods and results of the analysis of the
spectral characteristics of /6/ and /v/ in the simpler VCV enunciation toward finding cues that can
identify all intended /6/'s in various contexts in continuous speech. More specifically, the research
intends to accomplish the following:
1. Identify the invariant and contextual-based differences between the spectrograms and
spectra of /6/ and its close-sounding phonemes.
2. Gain insight into how the human perceptual system processes and identifies the
contextually-varying /6/ and other phonemes during cognitive processing of continuous
speech.
Chapter II: Methodology
11.1 Overview
This project examines the invariant- and contextual-based characteristics of /6/. A set of
eighteen sentences is designed such that /6/ and its close-sounding phonemes are between the same
preceding and succeeding context. These sentences are listed in Appendix A. Three contexts that
are studied are nasal, stop, and vowel, and the corresponding close-sounding phonemes of /6/ are
/n/, /d/ and /v/, respectively. Based on the finding of the preliminary work, useful characteristics in
identifying /6/, such as F2 and F3, are measured and analyzed for the new database of sentences.
Additional parameters of the burst of /6/ and /d/ in the context of stop consonants are also measured
and analyzed.
11.2 Database
Eighteen sentences containing /6/ and its close-sounding phonemes, /n/, /d/ and /v/, are
constructed to form the database for this project (See Appendix A). Phrases in the original
sentences that contain the consonants of interest are included in Table 2-1. The sequences of
preceding context, consonant (/6/; or /n/, /d/, and /v/), and succeeding vowel that are analyzed in
detail are underlined in Table 2-1. Because the succeeding vowel may influence the characteristics
of the consonants, the succeeding vowels of each pair of phrases are chosen to be the same, as seen
Type of Phoneme In Succeedin
Preceding The Preceding 161' Close Sounding g Phrase
Context Context Consonant (/6/ vs ...) oe
Nasal /n/ /n/ // 1.win those
win nose
/i/ 2. win these
win Niece
Stop
It!
/d/ /o/ 1. putthoseput dough
Vowel iV/ /i/ 1. guarantee these
guard TV's /1/ 2. see this
see Victorian
/u/ /3/ 3. to the racial
two veracious
/ai/ /W/ 4. dye that
dye vat
/a/ /o/ 5. via those
via votes
/ei/ /c/ 6. may then
may
vend
Table 2-1: The contexts, close-sounding consonants, succeeding vowel, and phrases studied in the project. The underlined segments are the parts of the phrases analyzed in detail.
To find the spectral characteristics of /6/ that are common to both genders, the sentences are spoken by both male and female speakers. Because there may be variations among speakers and
enunciations, each sentence is spoken by two male and two female speakers and is repeated three
times by each speaker.
For each context, the database provides the following number of consonant pairs, listed in
Type of Preceding Number of Pairs Number ofRepetitions Total Number of
Context of Phrases _umber____epetition Utterances Analyzed
Nasal 2 11 22
Stop 1 11 11
Vowel 6 11 66
Table 2-2: Number of utterances analyzed in the study for each context.
The actual number of data analyzed may be less than the numbers listed here, because some
formant frequencies are impossible to determine in some enunciations. Also, 12 repetitions (4
speakers and 3 repetition per speaker) were planned, but due to problems during recording one set
of utterances by one of the female speakers was not used for the study. So, only 11 repetitions for
pairs of sentences were available for analysis and study.
11.3 Parameters Analyzed
11.3.1 Second and Third Formant Frequencies at the Onset of the Succeeding Vowel (F2 and F3)
The onset time of the succeeding vowel is determined by the combination of three pieces of
information: changes in the enunciations' sound wave, the formant tracks extracted by xkl, and the
spectrogram. Because vowels, unlike consonants, are formed with no obstruction in the vocal tract,
significantly more sound energy is concentrated at the lower formant frequencies of vowels than in
the case of consonants. High amplitude of sound energy is represented by dark bands on the
spectrogram and by bold points in the formant tracks extracted by xkl. Thus, the abrupt appearance
of dark bands in the spectrogram and of bold formant frequencies points in the formant tracks give
the approximate onset time of the succeeding vowel.
A more exact onset time is determined by looking for abrupt changes in the waveform.
Because the vocal tract has different shapes for vowels and consonants as a speaker switches from a
consonant to a vowel, the change is reflected in the waveform, as shown in Figure 2-1. In the
example given below, the point of abrupt change (the appearance of the first negative peak) at
around 224 ms marks the onset of the vowel; this value would correspond to the times of abrupt
appearance of dark bands and bold points in the spectrogram and formant tracks, respectively.
4000 -464.18 mrs (405) 2000 --2000 -4000 170 180 190 200 210 220 230 240 250 TIME (ms)
Figure 2-1: A male speaker's waveform of the utterance "V" in "TV" (Sentence #12). The changes
in the waveform at around 224 ms indicate the onset of the vowel.
Because the interest is to study the pattern of change of the second and third formant
frequencies over time, a narrow time window that gives detailed time domain information is used.
In this case, a 6.0 millisecond Hamming window is chosen. Since the amplitudes of sound energy
in higher formant frequencies tend to be low for vowels-thereby making determination of F3
more problematic--the pre-emphasis parameter in
xklis set to 100 to raise the amplitude of the F3
prominence.
The formant tracks extracted by xkl (the right side figure in Figure 1-1) show abrupt jumps
that are uncharacteristic of formant frequencies, due to the measuring algorithm used in
xkl.To get
V. -. .
V
yfi
~l
a more accurate measurement of F2 and F3, the formant frequencies given by the 6.0 ms Hamming
window are averaged over 15 milliseconds--7 milliseconds before the onset time to 7 milliseconds
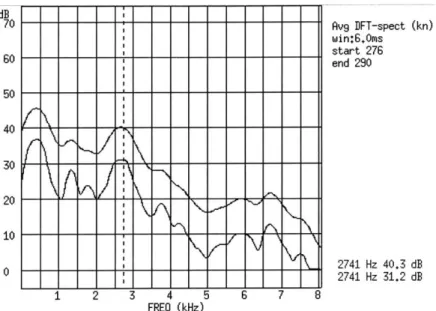
after. An example of the averaged spectrum is shown in Figure 2-2. The auto-pick option is turned
on to let xkl find the most accurate values for the formant frequencies, which correspond to the
peak frequencies (x-coordinates) seen in the spectrum.
dB 70 60 50 40 30 20 10 0
Figure 2-2: An exam
ple
1 2 3 4 57 7 8
FREQ (kHz)
spectrum showing auto-picked
value of F3Avg DFT-spect (kn) win:6.Oms start 276 end 290 2741 Hz 40.3 dB 2741 Hz 31.2 dB
(the dotted vertical line) by xkl.
11.3.2 Change of f2 and 3 Over a Period of 50 ms (DeltaF2 and DeltaF3)
The same parameter setting of 6.0 ms Hamming window, 100 pre-emphasis, and 15 ms
time-averaging is used to read the f2 and f3 values at 50 ms after the onset. The midpoint of the
time average is the onset time plus 50 ms. DeltaF2 and DeltaF3 are the differences of the f2 and f3
values at the later time minus those at the earlier time, respectively.
11.3.3 Amplitude Difference (Amp(High-Mid)) and Duration of Burst of /6/ and /d/
The burst spectrum of /d/ is expected to contain more energy in the higher frequency range
than that of /6/, and /d/ is expected to have longer duration than /6/. Thus the burst amplitude and
duration of the two consonant bursts are measured in the hope of finding characteristics that would
separate the two phonemes. Example spectra of bursts of /6/ and /d/ that illustrate the difference are
shown in Figure 2-3. dB 70 60 50 40 30 20 10 0 dB dB 70 60 50 40 30 20 10 0 _ 1 2 3 4 5 6 7 a 1 2 3 4 5 6 7
a)
FREO (kHz)b)
FREQ (kHz)Figure 2-3: Spectra of the burst of a) /6/ vs. b) /d/, of a female speaker. Notice that a prominent
peak at around 4.7 kHz is seen in the spectrum of /d/ but not in that of /6/.
To measure and quantify this spectral difference, the amplitudes of the peaks in the high and mid
frequency ranges are measured, and the difference is taken. This difference is named the amplitude
difference, and will be denoted as Amp(High-Mid) from here on.
Due to the differences in formant frequencies between the genders, the Amp(High-Mid)
value is defined slightly differently for each gender; the cutoff frequency defining the ranges is
higher for female speakers than for male speakers. More specifically:
1. For female speakers, Amp(High-Mid) equals the amplitude difference between the highest peak at frequencies higher than 4000 Hz and the highest peak (excluding the F1
peak) at under 3000 Hz.
2. For male speakers, Amp(High-Low) equals the amplitude difference between the highest
peak at frequencies higher than 3500 Hz and the highest peak (excluding the F1 peak) at
under 2500 Hz.
As done for the succeeding vowels, the spectra of /6/ and /d/ are also generated by a
6.0-Hamming window, averaged over 15 ms, and the formant frequencies for the spectra are
auto-picked by xkl. The midpoint of the time average is the onset of /6/ and /d/, which are easily
determined by looking for abrupt changes in the waveform. (See Figure 2-4.) The pre-emphasis is
set at 0, because /6/ and /d/ both have enough energy distributed in the higher frequencies for f3 to
be determined unambiguously. Figure 2-4 also illustrates how the duration of /6/ and /d/ are
determined.
-I -, -6000 4000 2000 0 -2000 -4000 -6000 275 280 285 290 295 300 305 310 TIME (ms) 315 320 325 330 335
Figure 2-4: Sample waveforms of a) /6/ and b) /d/. In each waveform, the two vertical lines
represent the points of waveform change, and the time in between the lines is the duration of the
burst.
In each waveform, the former and latter points of change indicate the beginning and the end of the
burst of /6/ or /d/. The time difference between the two points is the duration of the burst.
270.32 ms (54 6). 215 220 225 230 235 240 245 250 255 260 265 27, TIME (n) - e TI1E (sms)77 - r 013 ms-5477 - f
a)
6000 3000 0 -3000 -6000b)
w eChapter III: Results and Analysis
The second and third formant frequencies at the onset of the succeeding vowel (F2 and F3)
and their change over time (DeltaF2 and DeltaF3) were measured and analyzed for all three
contexts. The duration and the amplitude differences of the burst of /6/ and /d/ are also examined
in the context of a stop consonant. The resulting measurements of the three contexts are presented
in the tables and figures below. Pairs of parameters that show consistent differences between /6/
and its close-sounding phonemes are graphed as (x, y) pairs for the purpose of finding criteria that
would separate the consonants.
111.1 Context of Nasal Consonant
111.1.1 Second vs. Third Formant Frequencies (F2 vs. F3)
F2 and F3, the second and third formants at the onset of the succeeding vowel, were
measured for /6/ and /n/. Table 3-1 shows the average value of each speaker, given a particular
consonant and succeeding vowel (F#1 denotes female speaker #1, M#1 denotes male speaker #1,
and so on).
Parameter F2 F3 Vowel /o/ Consonant // F2 of Individual Speaker (Hz) F#1 F#2 M#J M#2 1654 1606 1260 1386 /n/ 2394 1952 1312 1533 /n/ /o/ 2856 3072 1 /n/ /n/ 3009 2825 3087 2993 2741 2694* 2667* 1974 2032 2342* 2258* 2426 2436
Table 3-1: F2 and F3 of /6/ vs. /n/ in the nasal context, listed by speakers and vowels. Notice that the corresponding F2 of /6/ is less than that of /n/ for all cases, but F3 does not show such consistency (the asterisks mark cases of inconsistency). Thus F2 is further analyzed.
Notice that in Table 3-1, given the same speaker and vowel, the F2 of /6/ is less than that of
/n/ for all cases. This difference is not only for the average values but for each enunciation as well.
F3, however, does not show the same consistency. The average F3 of /6/ is less than that of /n/ for
only 6 out of 8 of the cases (see Table 3-1; not true for the two sets of F3 appended with ""). The
relationship between F3 of /6/ and /n/ is even less consistent in each enunciation; only about half of
the enunciations have a higher F3 for /n/ than for /6/. Therefore, F2 is determined to be a better
parameter for identifying /6/ in nasal context and is thus further studied. 2363 2552 2773 2037 2394 2793 2016 2058 2667
111.1.2 Second Formant at the Onset of the Succeeding Vowel (F2) F2 of /6/ and /n/ is further analyzed by taking the average of F2
produced within each gender group. See Table 3-2 below for results.
for all of the utterances
Succeeding Vowel F2 of Female Speakers (Hz) F2 o Male Speakers (Hz)
/6/ /n/ /6/ /n/
/o/ 1660 1993 1360 1423
/i/ 2200 2473 1995 2045
Table 3-2: Average F2 values for /6/ vs. vowel. Notice that F2 varies according to
lower than the corresponding F2 of /n/.
/n/ in the nasal context, listed by gender gender and the succeeding vowel, but F2
and succeeding of /6/ is always
Table 3-2 indicates that corresponding F2's differ significantly between the genders, with
the difference ranging from around 200 to 570 Hz. This gender difference is expected because male speakers have longer vocal tracts, which produce lower formant frequencies, according to
perturbation properties of resonators [6].
Table 3-2 indicates that the succeeding vowel also significantly influences F2. F2 of both
/6/ and /n/ when succeeded by /o/ is consistently around 600 Hz lower than that of the consonants
when succeeded by /i/. F2's correlation with the succeeding vowels is expected, because different
vowels are results of different vocal tract shapes, which in turn resonate at different formant
frequencies, according to the perturbation properties of resonators [6]. The vowel /i/ is expected to
have a high F2 because /i/ has a fronted and high tongue body position [6]. On the other hand, /o/
has a back tongue position and thus should have a lower F2 [6]. The measured F2 agrees with these
expectations, and thus helps ensure the validity of the rest of the analysis.
The differences in F2 of the same consonant when succeeded by different vowels (Table
3-2) suggest that knowledge of the identity of the succeeding vowel could be important in the correct
identification of /6/. More specifically, if the succeeding vowel is not taken into consideration, the
average F2 of /6/ for female would be the average of 1660 and 2200 Hz (Table 3-2), or 1930 Hz;
and F2 of /n/ would be the average of 1993 and 2473 Hz (Table 3-2), or 2233 Hz. Given these
average F2 values of /6/ and /n/, a reasonable cutoff F2 to differentiate /6/ and /n/ could be the
midpoint, or 2082 Hz, i.e. consonants with higher F2 would be identified as a /n/, and consonants
with a lower F2 would be identified as a /6/. If this were the case, for /6/ and /n/ succeeded by /o/,
the vast majority of both /6/ and /n/ would be determined to be /6/, since more than half of the /n/
would have F2 less than 2082 Hz. To avoid this type of misclassification, differentiation criteria of
the consonants would be much more accurate is they are set with regard to a particular succeeding
vowel.
Table 3-2 also shows that for both genders and vowels, F2 of /n/ is consistently greater than
that of the corresponding /6/. This observation is reasonable based on the difference in the vocal
tract of the two consonant. Figure 3-1 shows that /6/ has more constriction in the back cavity than
/n/ (and /d/). The shape of the back cavity is known to have the strongest influence on the value of
F2: the more constriction, the lower F2 [6]. The data obtained are consistent with findings in the
literature and thus strengthen the validity of the results.
tongue
/d/ and /n/
/6/
Figure 3-1: The mid-sagittal view of the vocal track for /6/, /n/, and /d/ [5]. The back cavity is more restricted for /6/, the difference that leads to a lower F2 for /6/ than for /n/ and /d/.
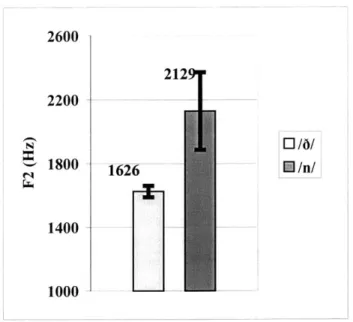
The average and standard deviation of F2 for vowel /o/ is calculated and graphed in Figure
3-2 and 3-3. The height of each bar represents the average F2 and the extension above and below the bar represents one standard deviation above and below the average.
N1 2600 2200 -1800 -1400 -1000 -0/a/ H/n/ 1626
-0
Figure 3-2: The average and standard deviations of F2 of /6/ vs. /n/ in nasal context of female speakers, given the succeeding vowel /o/. Notice that the F2 ranges of /6/ and /n/ do not overlap.
2600 2200 -N 1800 1400 -1000 -0 /6/ .I/n/ 1423 1323
LIr
Figure 3-3: The average and standard deviations of F2 of /6/ vs. /n/ in nasal context of male speakers, given the succeeding vowel /o/. Notice the slight overlap between the two F2 ranges.
30 212_
For female speakers, the ranges of F2 for /6/ and /n/ are relatively distinct. Most of their F2 values
fall in between 1590-1662 Hz for /6/, as opposed to 1886-2371 Hz for /n/. For male speakers,
however, F2 of /n/ and /6/ are less distinct and their ranges overlap (Figure 3-3). The ranges of the
majority of F2 values of male speakers are 1249-1398 Hz and 1301-1545 Hz, for /6/ and /n/
respectively.
The lack of overlap of F2 ranges in female speakers (Figure 3-2) suggests that substantial
differences exist between the F2's of the two consonants, and thus it is possible to set a criterion
that would separate most utterances of /6/ from /n/ on the basis of F2 alone. In this particular case,
the cutoff F2 that would best differentiate between the two consonants is somewhere between the
lower range of /n/ (1886 Hz) and the higher range of /6/ (1662 Hz). If the criterion is set half way
between the two values for simplicity, or at 1774 Hz, it would be 1.47 standard deviations away
from the mean F2 of /n/ and 4.11 standard deviations from mean F2 of /6/. Therefore, more than
93% of /n/ and virtually 100% of /6/ would be identified correctly, assuming Gaussian
distributions. With fine adjustments, the cutoff could be set so that it would be as many standard
deviations away from the average of both consonants as possible. Such adjustment would further
increase the accuracy of identifying the intended consonants.
The criterion for differentiating /6/ and /n/ based on F2 is harder to set for the given male
speakers. But since the two consonants are articulated similarly between the two genders, the
apparent greater difficulty in differentiating /6/ and /n/ in the male speakers is most likely speaker
two male speakers reveal substantial variation of F2 between the two speakers: F2 of one speaker is
significantly and consistently higher than that of the other. For each speaker, however, F2 of /6/ and
/n/ show differences similar to those observed in the female speakers Thus, the more acoustic
characteristics are known about a particular speaker, the more accurate the identification of /6/
would likely to be for that speaker.
111.1.3 Movement of f2 Over a Period of 50 ms (DeltaF2)
The second formant frequency at 50 ms after the onset of the vowel is measured by methods
described in Chapter II. The average frequency differences at the two times for a given speaker and
succeeding vowel are tabulated in Table 3-3.
Succeeding Vowel Consonant Average DeltaF2 of Individual Speaker (Hz)
F#1 F#2 M#1 M#2
/o/ /6/ -205 -94 -178 -147
/n/ -409 -188 -179 -221
/I /6/ 315 410 221 111
/n/ 205 241 179 74
Table 3-3: Average DeltaF2 of /6/ vs. /n/ in nasal context, listed by speaker and succeeding vowel. The average DeltaF2 is positive for utterances succeeded by /o/ and negative for those by /i/. DeltaF2 of /6/ is greater than that of /n/ in all cases.
Notice that the average DeltaF2 is negative for all speakers when the succeeding vowel is
/o/ and is positive when the succeeding vowel is /i/. This observation is also consistent with
characteristics of F2 of /o/ and /i/. As mentioned earlier, the tongue is raised and fronted when
producing /i/. These actions cause a widening of the back cavity of the vocal tract and are reflected
by a rising F2. The tongue is moved toward a back position when producing /o/, and the movement results in a lowering of F2, as observed in the data.
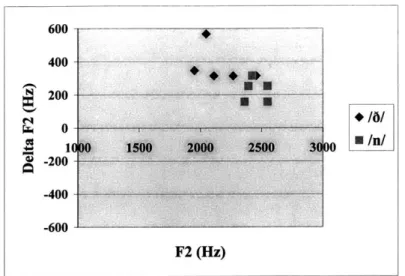
111.1.4 F2 and DeltaF2
Since F2 and DeltaF2 are, for the most part, consistently different for /6/ and /n/, they are
chosen to be graphed as x- and y-coordinates, i.e. (F2, Delta F2). Figure 3-4 and 3-5 show F2 and DeltaF2 of /6/ vs. /n/, regardless of the succeeding vowel, of the female and male speakers,
respectively. Notice that /6/ and /n/ are mixed together in both figures. It is impossible to draw a
line, representing a certain differentiation criterion, such that points of /6/ would be on one side and
points of /n/ on the other.
The F2 and DeltaF2 of /6/ and /n/ of the female speakers when plotted for a particular
succeeding vowel (/i/), shown in Figure 3-6, show better separation between /6/ and /n/ than in the
case of mixed vowels in Figure 3-4. The separation becomes even clearer in Figure 3-7, when the
plots of F2 and DeltaF2 are further narrowed down to each speaker. Notice that for both female
speakers, /6/ has lower F2 and higher DeltaF2 than /n/. The same trend is also observed for both
female speakers in /6/ and /n/ succeeded by /o/ in Figures 3-8 and 3-9. After normalization by
vowel and speaker, points for /6/ and /n/ can be separated onto different sides of a positively sloped
line. Such a line would be the graphical representation of an algorithm that differentiates intended
/6/ from /n/, and it would be specified by assigning the appropriate coefficients to F2 and DeltaF2. Figures 3-7 and 3-9 show that /6/ and /n/ are indeed distinct enough that it is possible for an
Similar plots of F2 and DeltaF2 of /6/ and /n/ of a particular vowel for the each of the two
male speakers are included in Appendix B (Figures A-2 and A-4). Notice that each of the four
graphs shows more separation of the /6/ and /n/ points than their corresponding plot in which the
two male speakers' data are mixed (Figures A-1 and A-3). Again, the clearer separation of /6/ and
/n/ in the plots of for each individual speaker shows that, in addition to having knowledge of the
succeeding vowel, knowledge of the particular speaker also greatly assists in separating /6/ from its
close-sounding phoneme.
The extent of separation between /6/ and /n/ in the four plots of Figures A-2 and A-4 for
male speakers, however, is not as clear and consistent as for the females (Figures 3-7 and 3-9).
Both Figure A-2a and A-4b show the same kind of separation as seen in the female speakers but
with less distinction, whereas Figures A-2b and A-4a have overlapping /6/ and /n/ points. Despite
the lack of more convincing separation in the male speakers, the clusters of /6/ and /n/ points are
located in similar positions relative to each other. This similarity is expected because speakers of
both genders articulate /6/ and /n/ by shaping their the vocal tracts in similar ways, thus resulting in
the same relationship in the values of F2 and DeltaF2 between /6/ and /n/. The lack of more
convincing separation for the male speakers is most likely due to the limited number of utterances
that were available for this study. Had more speakers of both genders been asked to repeat each
utterance more times, the pattern of relatively lower F2 and higher DeltaF2 of /6/ would probably
be more apparent, and the separation between the two consonants would be more distinct.
OUU
-Figure 3-4: F2 and DeltaF2 of /6/ vs. /n/ in nasal context of female speakers, regardless of the
succeeding vowel. Notice that it is impossible to draw a line such that /6/ points would be on one
side and /n/ points on the other.
Figure
3-5:
F2 and DeltaF2 of /6/ vs. /n/ in nasal context of male speakers, regardless of the
succeeding vowel. Notice that it is impossible to draw a line such that /6/ points would be on one
side and /n/ points on the other.
400 200 S-200 --400 -600 F2 (Hz) 600 400 200-0 10 0 -200--400 -600 F2 (Hz) M
Figure 3-6: F2 and DeltaF2
vowel /i/.
a)
of /6/ vs. /n/ in nasal context of female speakers, given succeeding
600 400 200 0 D/O -200J 0 n -400 -600 F2 (Hz)
b)
Figure 3-7: F2 and DeltaF2 of /6/ vs. /n/ in nasal context of individual female speakers, a) F#1, b)
F#2, given succeeding vowel /i/. /6/ and /n/ are more distinctly separated for each individual
speaker than for both speakers (Figure 3-6).
36
600 400 200 0 49 10 "'Do /n S-200i -400 -600 F2 (Hz) 600 400 200 SA 00 -20J0 -400 -600 F2 (Hz)600
r-Figure 3-8: F2 and DeltaF2 of /6/ vs. /n/ in nasal context of female speakers, given succeeding
vowel
/o/.
Notice that /6/ and /n/ occupy different ranges of F2 but not of DeltaF2.
a)
b)
Figure 3-9: F2 and DeltaF2 of /6/ vs. /n/ in nasal context of individual female speakers, a) F#1, b)
F#2, given succeeding vowel /o/. /6/ and /n/ are more distinctly separated for each individual
speaker than for both speakers (Figure 3-8).
400 200 0 + 16 0 4 -30 // -200 -400 -600 F2 (Hz) 600 400 200 0 mn 01A 10 2500, 3 0 -20/ -400 -600 F2 (Hz) 600 400 200 0 -200 -400 -600 U F2 (Hz) 00 15t~ ~2* ZRI 31 B
111.2 Context of Stop Consonant
111.2.1 Second vs. Third Formant Frequencies (F2 vs. F3)
Data on F2 and F3 similar to those in Table 3-1 were collected for phrases that compare /6/
and /d/. As in the case of nasal context, F2 of /6/ is consistently lower than that of /d/ whereas F3 of
/6/ and /d/ does not show a consistent pattern. Therefore, F2 is further analyzed.
111.2.2 The Second Formant Frequency at the Onset of the Succeeding Vowel (F2)
The second formant frequency of /6/ and /d/ is further analyzed by taking the average of F2
for all utterances produced by the female and male speakers separately. The results are summarized
in Table 3-4. Note that for /6/ and /d/ only succeeding vowel /o/ is examined.
F2 of Female Speakers (Hz) F2 of Male Speakers (Hz)
/6/ /d/ /6/ /d/
1695 2079 1367 1650
Table 3-4: Average F2 values for /6/ vs. /d/ in stop context, listed by gender. Notice that F2 is higher in /d/ than in /6/. Note that for /6/ and /d/ only succeeding vowel /o/ is examined.
Again, F2 varies significantly between the genders, on the order of about 300 Hz. F2 of /6/ is lower
than that of /d/, because like /n/, /d/ also has less constriction in the back cavity than /6/ (see Figure
3-1).
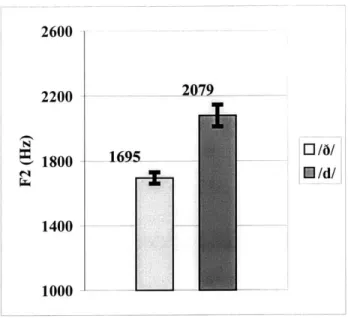
The average and standard deviation of F2 of female and male speakers are shown in Figures
3-10 and 3-11. As in Figure 3-2, the height of each bar represents the average F2, whereas the
extension above and below the bar represents one standard deviation away from the average.
2600 2200 - - 2079 1800 -- 169_ / M /d/ 1400 1000
-Figure 3-10: The average and standard deviations of F2 of /6/ vs. /d/ in stop context of female speakers, given the succeeding vowel /o/. Notice that the F2 of /6/ is significantly lower than that of /d/. 2600 -2200 -1800 1650/ 1397 1400 1000
Figure 3-11: The average and standard deviations of F2 of /6/ vs. /d/ in stop context of male speakers, given the succeeding vowel /o/. Male speakers show similar trend as female speakers do. (Figure 3-10)
For female speakers, the ranges of F2 of /6/ and /d/ are relatively distinct (Figure 3-10).
Most of the F2 values of /6/ fell between 1660-1729 Hz as opposed to 2012-2146 Hz for /d/. For
male speakers, F2 of /6/ and /d/ are relatively distinct too (Figure 3-11). Most F2 values of male
speakers are in the range of 1329-1465 Hz and 1552-1747 Hz, for /6/ and /n/ respectively. Because
the ranges do not overlap, as in the case of /6/ and /n/ in the nasal context, it is possible to set up a
cutoff of F2 such that /6/ and /d/ would be correctly identified by their lower and higher F2 values,
respectively.
111.2.3 Amplitude Difference In The Burst (Amp(High-Mid))
As described Chapter II, the energy distribution in the burst spectrum can potentially be
used to distinguish intended /6/ and /d/; the amplitude differences in the burst of /6/ and /d/ are
tabulated in Table 3-5.
Speaker Consonant Amplitude Difference (Amp(High-Mid)) (dB)
Enunciation Enunciation Enunciation Average of
#1 #2 #3 the Enunciations F#1 /a/ N/a -11.1 -14.5 -12.8 /d/ N/a 6.7 5.8 6.25 F#2 /6/ -18.1 -12.5 -8.1 -12.9 /d/ 17.3 14 6.3 12.6 M#1
/6/
-6.8 -8.1 -3.5 -6.1 /d/ -7.8 -1.2 -4.5 -4.5 M#2 / / 1.3 -1.3 -6.2 -2.1 /d/ 1 5.5 10.4 5.6Table 3-5: Amplitude difference between the high and mid frequency ranges of /6/ vs. /d/ in stop context, listed by speaker and enunciation. Notice /6/'s amplitude difference is usually negative and is less than that of /d/ in almost all cases.