The applied value of public investments in biomedical research
The MIT Faculty has made this article openly available.
Please share
how this access benefits you. Your story matters.
Citation
Li, Danielle, Pierre Azoulay, and Bhaven N. Sampat. “The Applied
Value of Public Investments in Biomedical Research.” Science 356,
no. 6333 (March 30, 2017): 78–81. © 2017 American Association for
the Advancement of Science (AAAS)
As Published
http://dx.doi.org/10.1126/science.aal0010
Publisher
American Association for the Advancement of Science (AAAS)
Version
Author's final manuscript
Citable link
http://hdl.handle.net/1721.1/111116
Terms of Use
Article is made available in accordance with the publisher's
policy and may be subject to US copyright law. Please refer to the
publisher's site for terms of use.
1
The Applied Value of Public Investments in Biomedical Research
Danielle Li
1, Pierre Azoulay
2,3, Bhaven N. Sampat
3,41Harvard Business School, Boston, MA 02163, USA. E-mail:
2Massachusetts Institute of Technology, Cambridge, MA 02142 USA 3National Bureau of Economic Research, Cambridge, MA 02138 USA
4Columbia University, New York, NY 10032 USA
Abstract
Scientists and policy makers have long argued that public investments in science have practical applications. Using data on patents linked to U.S. National Institutes of Health (NIH) grants over a 27 year period, we provide what we believe to be the first large-scale accounting of linkages between public research investments and subsequent patenting. We find that about 10 percent of NIH grants generate a patent directly, but 30 percent generate articles that are subsequently cited by patents. While policymakers often focus on direct patenting by academic scientists, the bulk of the impact of NIH research on patenting appears to be indirect. We also find no systematic relationship between the ‘basic’ vs. ‘applied’ research focus of a grant and its propensity to be cited by a patent.
The claim that investments in publicly funded science ultimately have practical application is perhaps the central assumption in postwar science policy (1). Though private-sector research and development (R&D) investments can be more easily linked to a firm’s own marketed products, knowledge generated by public investments in science is often meant to be freely accessible to multiple other parties, making it difficult to keep track of whether and by whom this knowledge is used. Moreover, publicly-funded research may have applications far from its original area, many years or even decades later, making the links between funding and commercial use difficult to predict (2). When public investments in science lay a foundation for innovation by others—with heterogeneous time lags and spillovers across topics—how can we credit these investments for contributing to the development of these innovations?
We analyze the output of research grants awarded by the US National Institutes of Health (NIH), the world’s largest single funder of research in the life sciences, with an annual budget of over 30 billion dollars (See Appendix A for a primer on NIH funding). NIH provides support for one third of biomedical R&D in the U.S. overall, as well as the majority of funding for so-called ‘basic’ biomedical research (3, 4). Using data on life-science patents (including drugs, devices, and other medical technologies) linked to NIH grants over a 27 year period, we provide what we believe to be the first large-scale accounting of linkages between public research investments and commercial applications. Recognizing that some patents are more valuable than others, we will also examine linkages between NIH grants and patents associated with marketed drugs (see Appendix B).
2
There are two basic ways through which NIH-funded research may impact patenting and drug development. First, NIH-funded scientists may themselves produce patents. The 1980 Bayh-Dole Act created incentives for these researchers and their institutions, typically universities, academic medical centers, and non-profit research institutes, to patent their discoveries, so that they could be licensed to private firms. The Act required institutions to report patents resulting from public funding to the government. This reporting requirement enables us to identify patents that are directly produced as a result of NIH funding (see Appendix C).
Public funding for biomedical research, however, is typically intended to have impact beyond the direct production of patents. To capture this broader impact, our second measure identifies private-sector patents that cite NIH-funded research. We collect all scientific publications that are listed in the “References Cited” section of private sector patents, determine which articles result from NIH funding, and the grant numbers for those that do (see Appendices C and D). Scientific references generated during the patent application process are part of the “prior art” against which patent examiners judge the patentability of inventions. References to prior articles are thus similar to references to prior patents, which have been widely used to examine the impact of science. Patent-article references, however, have two major advantages: (i) publications rather than patents are the primary output of academic research, and (ii) unlike citations to other patents, citations to published articles are much more likely to come from patent applicants themselves rather than from patent examiners (5). While citations to articles contained in patent documents are not perfect measures of knowledge flows, validation exercises against survey data suggest that patent-article citations provide better signals of the intellectual influence of public science than previously used measures (6). We are able to identify patents that build on NIH-funded research without making a priori assumptions about the diffusion of scientific knowledge over time and across disease areas (e.g., if grant funding by the National Cancer Institute leads to research cited by patents on AIDS treatments). Appendix E in the SOM provides details on the process followed to pair life science patents with the individual PubMed records they reference.
Our research builds on and extends previous work in several ways. While a considerable body of research has examined academic patenting linked to public research (7), and some authors have done so at the grant level (8), ours is the first to compare the relative magnitude of patenting through direct and indirect channels using individual grant data. While Sampat and Lichtenberg (9) examined the relative importance of these two channels for marketed drugs, their analysis was retrospective, while ours is prospective. Other papers (10) that take a prospective approach only consider one of the two channels, and only for a subset of NIH grants. The paper also adds to a long line of previous bibliometric research (11) by linking patents not just to scientific articles, but also linking the articles back to funding sources, and by attempting to categorize these grants by different measures of “basicness.”
Our sample consists of 365,380 grants funded between 1980 through 2007, almost all NIH grants over this period. Nearly half of these (164,378) are R01-equivalent grants, large project-based renewable grants that form the foundation of NIH’s extramural spending. 30,829 (8.4 percent) of these grants are directly acknowledged by patents, leading to 17,093 “Bayh-Dole” patents assigned primarily to universities and hospitals. A much larger set of grants, 112,408 (31 percent), produces research that is cited by 81,462 private-sector patents in aggregate (12). These indirectly-linked patents demonstrate the additional reach that publicly-funded science can have by building a foundation for private-sector R&D.
3
Figure 1A describes the lag times between NIH funding and follow-on patenting both via direct acknowledgements and indirect citation linkages. At a given point t on the x-axis, we plot the proportion of t year old grants that have been linked to a patent. This curve is generally increasing because a grant’s likelihood of being linked to a patent increases with age. In some cases, these curves turn downward in later years because of cohort effects; e.g., the proportion of grants linked to patents after 25 years does not include grants less than 25 years old (because these figures conflate time and cohort effects, we report a survival analysis in Appendix G that separately controls for grant cohort). The difference in the number of patents we are able to link to public science funding via these two different approaches is immediately apparent. Our results so far indicate that though Bayh-Dole and other policies emphasize patenting by academic researchers themselves, the impact of NIH research through traditional channels—private patents citing publications from NIH grants—is almost four times greater. Moving forward, we adopt this as our preferred measure of patenting associated with NIH funding.
We look separately at patents associated with drug approvals, using data from the Food and Drug Administration (FDA). In general, there are far fewer such patents—only 4,414 of the life science patent in our sample are associated with FDA-approved drugs—meaning that a smaller proportion of NIH-funded grants will be linked to such patents. Less than 1 percent of NIH grants are directly acknowledged by a patent associated with a marketed drug (Figure 1B). But 5 percent of grants result in a publication that is cited by a patent associated with the marketed drug. Here again, the indirect impact dominates the impact via the direct “Bayh-Dole” channel.
The question of whether more ‘basic’ or ‘applied’ grants are ultimately more valuable for progress is an old one in science policy (1, 13). One complication is that there is no consensus on the definitions and distinctions between the two (14, 15). ‘Basic’ research has been variously defined by whether it seeks general or specific knowledge (16), by the institutional environment where it takes place and norms regarding dissemination (17), by whether it is undertaken for its own sake or with some application in mind (14), and by whether or not it is targeted to a specific program or mission (13), among other ways.
Rather than try to resolve this debate, we examine four different dimensions that have been of interest to medical research policymakers: whether the research is disease-oriented, whether it is focused on patients (13, 18), and whether it is solicited by the funder or is investigator-initiated (19); for the subset of grants that are not disease-oriented, we also examine the complexity of the model organism studied (20). Except for the solicited vs. investigator-initiated distinction, all the ‘basicness’ measures rely on a semantic mapping, using a natural language processing tool (the Medical Text Indexer), between funded grant abstracts and Medical Subject Heading (MeSH) keywords, the controlled vocabulary maintained by the National Library of Medicine (see Appendix F).
A grant is said to be disease-oriented if its abstract can be mapped to at least one MeSH term corresponding to a disease (i.e., the MeSH code starts with the letter C). By this measure, 183,517 grants (50 percent of our sample) are disease-oriented.
Distinguishing patient-oriented grants from other projects is straightforward, since the MeSH controlled vocabulary includes a term for humans. Patient-oriented grants defined in this way include (but are not limited to) research that uses human subjects. Using this measure, 177,692 grants (49 percent of our sample) are patient-oriented.
4
Whether the research was solicited, via a Request for Applications (RFA), is based on NIH administrative data. RFAs (24% of our sample) are typically used to direct research at particular diseases or problems, and thus more likely to represent applied work.
We use MeSH terms to classify NIH grants by the complexity of the model organism they propose to study. While admittedly crude, this taxonomy captures the idea that scientists are more likely to bear the financial and logistical costs of working with higher-order animal models when conducting research intended to be more applicable to humans. In contrast, simple organisms are often chosen to elucidate fundamental biological phenomena, without consideration of therapeutic usefulness (21).
For this classification we restrict our sample to grants that are not disease oriented, based on the first measure above, to eliminate clinical or translational research that happens to study the effect of viruses or bacteria. We focus on grants that mention at least one organism in the abstract, and take into account the natural hierarchy of model organisms by grouping them into coherent non-overlapping sets: viruses, prokaryotes, unicellular eukaryotes, multicellular eukaryotes, invertebrates, vertebrates, rodents, other mammals, primates, and finally humans. When an abstract can be mapped to two or more levels of this hierarchy, we assign the grant to the higher-order organism (see Appendix F).
Grants targeting diseases are more likely to produce research that is cited by a patent, but this difference is small: 35 percent of disease-oriented grants versus 30 percent of non-disease oriented grants (Figure 2A). When we examine grants linked to patents on FDA-approved drugs, we find that non-disease targeted grants yield a similar number of high value patents (Figure 2B). The difference in these curves suggests that while non-disease oriented research may take more time to yield drug-related patents, its value levels off less slowly over time.
Non-patient-oriented research yields patents at virtually identical rates to patient-oriented research (Figure 2C). Non-patient-oriented research appears to continue accruing patents associated with FDA drugs even after this levels off for patient-oriented research (Figure 2D). Non-RFA-solicited research, more likely to be basic, produces patent output similar to RFA-solicited research (Figure 2E), though this time we find slightly more FDA-approved drugs for the set of RFA-solicited grants (Figure 2F).
Even non-disease-oriented research on simple organisms is almost as likely to produce research that is linked to patents as research on “higher-order” organisms (Figure 3). Taken together, Figures 2 and 3 suggest that, based on our measures, basic and applied grants are quite similar in their linkages to commercial patenting.
While our analysis is the first large scale evaluation of different types of linkages between NIH research and private patenting, there are important limitations. There may be under-reporting of “Bayh-Dole” patents to the federal government by academic institutions which would understate the importance of the direct linkages (23). Measuring indirect linkages through patents citing articles is also imperfect. Applicants may have incentives to over-cite known prior art (24), and the extent to which they search for prior art may vary by invention importance (25). Citations are made to satisfy legal criteria and may not necessarily reflect strong intellectual influences. On the other hand, our approach may underestimate linkages between NIH funding and patenting because not all intellectual influences are embodied in articles, e.g., the effects of NIH training. While patent-paper references improve on previous measures of knowledge flows (see above and in the SOM), more work is needed to understand potential noise or biases in these measures. While we look only at first generation citations, some grants may generate articles that are not cited by patents, but are
5
cited by other articles that in turn are cited by patents. This would lead us to underestimate links between NIH funding and patents. Finally, our measures of ‘basicness’ only capture, imperfectly, some of the relevant dimensions in the age old debates regarding basic vs. applied research.
Despite these limitations we provide several new stylized facts. About a third of NIH grants generate research that is cited by commercial patents. This is much greater than the share of grants directly yielding patents (less than 10 percent), even though policymakers often focus on this more easy-to-grasp metric to capture the near-term economic returns to public funding of biomedical R&D (26).
There is no obvious relationship between ‘basicness’ and likelihood of being cited by a patent. One interpretation of this is that ‘basic’ research is nearly as productive as ‘applied’ research, which may be surprising to those who question its value (27). On the other hand, we find little evidence for claims that basic research is substantially more impactful over the period we study (1, 28). Our results are consistent with arguments that the basic/applied distinctions may not be so useful in thinking about what types of research funding is more productive.
6 Figure 1: Grant-Patent lags, direct vs. indirect patenting
Note: Based on a sample of 365,380 NIH grants awarded between the years 1980 and 2007. A grant is directly linked to a patent if the patent contains a government interest statement explicitly referencing the grant (Panel A). A grant is indirectly linked to a patent if a publication acknowledges the grant within five years of the start of a particular funding period for the grant (covering the fiscal year in which it is first disbursed up until the year the funding runs out, typically 3 to 5 years), and a patent cites this publication as prior art (Panel B). For each year after approval, the percentage of linked patents is calculated using only grants that have reached that age.
0 10 20 30 40 % of g rant s lin ked to a t l eas t one pat en t 0 5 10 15 20 25
Years After Grant Approval
Indirect Citation Link Direct Acknowledgment
A. All Patents 0 1 2 3 4 5 % o f g ra nt s w ith a p at en t, F D A 0 5 10 15 20 25
Years After Grant Approval
Indirect Citation Link Direct Acknowledgment
7 Figure 2: Grant-Patent lags, by basic or applied orientation
Note: A grant is designated disease-targeted if its abstract can be mapped to at least one MeSH term corresponding to a disease through the Medical Text Indexer (Panels A & B). A grant is designated patient-oriented if its abstract can be mapped to the MeSH term for humans through the Medical Text Indexer (Panels C & D). A grant is designed as RFA if it is submitted as part of a request for applications (Panels E & F). “Bayh-Dole” patents that cannot be linked to a grant through a publication are excluded from the analysis. See Appendix F for further details on these classifications.
0 10 20 30 40 % of g ra nt s w/ p ub lic a tio n s ci te d by a p at en t 0 5 10 15 20 25
Years after grant approval
Disease Targeted Not Disease Targeted A. All Patents 0 2 4 6 % of g ra nt s w/ p ub lic a tio n s ci te d by a p at en t 0 5 10 15 20 25
Years after grant approval
Disease Targeted Not Disease Targeted B. FDA Approved 0 10 20 30 40 % of g ra nt s w/ p ub lic a tio n s ci te d by a p at en t 0 5 10 15 20 25
Years after grant approval
Patient Oriented Not Patient Oriented C. All Patents 0 2 4 6 % of g ra nt s w/ p ub lic a tio n s ci te d by a p at en t 0 5 10 15 20 25
Years after grant approval
Patient Oriented Not Patient Oriented D. FDA Approved 0 10 20 30 % o f g ra nt s w / p u bl ica tio n s ci te d by a p a te nt 0 5 10 15 20 25
Years after grant approval
RFA Non RFA E. All Patents 0 1 2 3 % o f g ra nt s w / p u bl ica tio n s ci te d by a p a te nt 0 5 10 15 20 25
Years after grant approval
RFA Non RFA F. FDA Approved
8 Figure 3: Grant-Patent lags, “animal kingdom” ordering
Note: Grants are assigned to animal kingdom categories based on the highest model organism that their abstract can be mapped into, through the Medical Text Indexer. The grants considered in this analysis exclude disease-oriented grants. “Bayh-Dole” patents that cannot be linked to a grant through a publication are excluded from the analysis. See Appendix F for further details on this classification.
References and Notes:
1. V. Bush, Science: The Endless Frontier. (Washington, DC: US General Printing Office, 1945).
2. H. Varmus, The Art and Politics of Science. (W. W. Norton & Company, 2009).
3. H. Moses, E. R. Dorsey, D. H. M. Matheson, S. O. Thier, Financial Anatomy of Biomedical Research. JAMA 303, 1333-1342 (2005).
4. See Appendix A in the Supplementary Online Material (SOM).
5. M. A. Lemley, B. Sampat, Examiner Experience and Patent Office Outcomes. Review of Economics and Statistics
94, 817-827 (2012).
6. M. Roach, W. M. Cohen, Lens or Prism? Patent Citations as a Measure of Knowledge Flows from Public Research. Management Science 59, 504-525 (2013).
7. A. J. Stevens et al., The Role of Public-Sector Research in the Discovery of Drugs and Vaccines. New England Journal of Medicine 364, 535-541 (2011).
0 10 20 30 40 50
% with private-sector patent, up to 25 years later
virus prokaryote eukaryote, unicellular eukaryote, multicellular invertebrates vertebrates rodents other mammals primates humans 0 2 4 6 8
% with patent associated with an FDA-approved drug, up to 25 years later
virus prokaryote eukaryote, unicellular eukaryote, multicellular invertebrates vertebrates rodents other mammals primates humans
9
8. M. J. Kalutkiewicz, R. L. Ehman, Patents as Proxies: NIH Hubs of Innovation. Nature Biotechnology 32, 536-537 (2014).
9. B. N. Sampat, F. R. Lichtenberg, What Are the Respective Roles of the Public and Private Sectors in Pharmaceutical Innovation? Health Affairs 30, 332-339 (2011).
10. B. N. Sampat, H. A. Pincus, Citations in Life Science Patents to Publicly Funded Research at Academic Medical Centers. Clinical & Translational Science 8, 759-763 (2015).
11. F. Narin, K. S. Hamilton, D. Olivastro, The Increasing Linkage Between US Technology and Public Science. Research Policy 26, 317-330 (1997).
12. Note that these two channels are not mutually exclusive.
13. J. H. Comroe, R. D. Dripps, Scientific Basis for the Support of Biomedical Science. Science 192, 105-111 (1976). 14. D. Stokes, Pasteur’s Quadrant: Basic Science and Technological Innovation. (Brookings Institution Press,
Washington, DC, 1997).
15. J. H. Marburger III, Wanted: Better Benchmarks. Science 308, 1087 (2005).
16. K. Pavitt, What Makes Basic Research Economically Useful? Research Policy 20, 109-119 (1991). 17. D. Partha, P. A. David, Toward a New Economics of Science. Research Policy 23, 487-521 (1994). 18. G. L. Westbrook, “Basic Research Considerations for NINDS: Analysis and Recommendations” (2009).
19. L. E. Rosenberg, “Scientific Opportunities and Public Needs: Improving Priority Setting and Public Input at the National Institutes of Health” (Report of the Committee on the NIH Research Priority-Setting Process, Institute of Medicine, 1998).
20. S. Fields, M. Johnston, Whither Model Organism Research? Science 307, 1885-1886 (2005).
21. Brown (2003) provides an illustration of this point in his case study of research on the tiny hermaphrodite worm caenorhabditis elegans.
22. A. Brown, In the Beginning Was the Worm: Finding the Secrets of Life in a Tiny Hermaphrodite. (Columbia University Press, New York, 2003).
23. A. Rai, B. Sampat, Accountability in Patenting of Federally-funded Research. Nature Biotechnology 30, 953 (2012). 24. C. A. Cotropia, M. A. Lemley, B. Sampat, Do Applicant Patent Citations Matter? Research Policy 42, 844-854
(2013).
25. B. N. Sampat, When Do Applicants Search for Prior Art? Journal of Law and Economics 53, 399-416 (2010). 26. D. C. Mowery, B. N. Sampat, in Essays in Honor of Edwin Mansfield: The Economics of R&D, Innovation, and
Technological Change, A. N. Link, F. M. Scherer, Eds. (Springer, New York, 2005), pp. 233-245. 27. C. Macilwain, Science Economics: What Science Is Really Worth. Nature 465, 682-684 (2010).
28. M. Trajtenberg, R. M. Henderson, A. B. Jaffe, University vs. Corporate Patents: A Window on the Basicness of Innovations. Economics of Innovation and New Technology 5, 19-50 (1997).
Acknowledgments: P.A. acknowledges the financial support of the National Science Foundation through its SciSIP Program (Award SBE-1460344).
10
The Applied Value of Public Investments in Biomedical Research
Supplementary Online Material
Danielle Li
1, Pierre Azoulay
2,3, Bhaven N. Sampat
3,41Harvard Business School, Boston, MA 02163, USA. E-mail: [email protected]
2Massachusetts Institute of Technology, Cambridge, MA 02142 USA
3National Bureau of Economic Research, Cambridge, MA 02138 USA
4Columbia University, New York, NY 10032 USA
Data and Code: Available on Bhaven Sampat's Dataverse:
https://dataverse.harvard.edu/dataverse.xhtml?alias=boffindata
The uploaded data include everything necessary to replicate the main paper figures, as well as the discrete time hazard models in Appendix G. The results in Table G1 make use of restricted access data from the Association of American Medical Colleges (AAMC), used to assign gender, age, and degree. Table G2 re-estimates our models without these variables, to allow for replication with publicly available data. To access restricted AAMC data, please
contact [email protected]
Appendix A: A Primer on NIH Funding
The National Institutes of Health (NIH) is the primary organization within the United States government with responsibilities for health-related research, with an annual budget of approximately $30 billion. NIH’s mission is “to seek fundamental knowledge about the nature and behavior of living systems and the application of that knowledge to enhance health, lengthen life, and reduce illness and disability” (29).
NIH includes 21 different Institutes (and several centers, though these are not included in our analyses). The Institutes have distinct though sometimes overlapping research foci. For example, the National Institute for Mental Health focuses on mental health related research. It shares interests with the National Institute of Aging on issues related to dementia. All Institutes receive their funding directly from Congress, and manage their own budgets.
More than 80% of the total budget supports extramural research through competitive grants that are awarded to universities, medical schools, and other research institutions, primarily in the United States. The largest and most established of these grant mechanisms is the R01, a project-based renewable research grant which constitutes half of all NIH grant spending and is the primary funding source for most academic biomedical labs in the United States. There are currently 27,000 outstanding awards, with 4,000 new projects approved each year. The average size of each award is 1.7 million dollars spread over 3 to 5 years, and the application success rate is approximately 20 percent (30).
11
Institutes included in the analysis. While there are 21 different Institutes, we exclude grants from the National Library of Medicine (NLM), the National Institute of Nursing Research (NINR), and the National Institute on Minority Health and Health Disparities (NIMHD), which together represent less than 3% of NIH’s total budget. We drop the NLM because it seldom supports extramural researchers. We drop NINR and NIMHD because we found no instances of the grants funded by these Institutes generating publications referenced in private-sector patents. Doing so effectively focuses our analysis on component institutes that are “at risk” of being linked to patents.
Grant Characteristics. Our analytic sample consists of 365,380 NIH grants awarded between 1980 and 2007. Approximately 8% of these grants are directly linked to academic patents and 30% are indirectly linked to commercial patents. Table A1 describes the breakdown by grant type for our full set of grants, and each of these subsets of patent-linked grants.
12 Table A1: Grant Characteristics
Grants Linked to Patents
Full Sample Directly
Linked Indirectly Linked Sample Coverage # Grants 365,380 30,829 112,408 Grant Characteristics % R01 equivalent grants 44.99 34.73 42.74 % RFA 23.89 17.90 15.13 % Disease-related keywords 50.23 49.64 51.50
By "highest" organism-related keyword
Human 48.63 44.52 44.42 Primate 0.47 0.28 0.59 Other Mammal 3.05 2.35 2.72 Rodent 8.46 8.18 8.70 Vertebrate 1.06 0.73 0.73 Invertebrate 1.38 0.98 0.94 Eukaryote, multicellular 0.82 0.83 0.75 Eukaryote, unicellular 0.77 0.61 0.86 Prokaryote 1.91 1.93 2.19 Virus 1.26 1.67 1.76 Undefined 32.19 37.91 36.34
Note: Sample is the set of all NIH-funded grants from 1980-2007, excluding NINR, NLM, and NIMHD grants. The sample is restricted to new and competitive renewal grants so that there is one observation per successful grant application cycle. A grant is defined as directly linked if it is acknowledged by a patent. A grant is defined as indirectly linked if there exists a patent that cites a publication that acknowledges funding from that grant. A grant is matched with a publication if it acknowledges the project number of the grant and is published within 5 years of the grant’s funding year. A patent is citation-linked to a grant if it cites a publication that is linked to a grant. R01 equivalents include the R23, R29, and R37.
13
Appendix B: “Life Science” Patents
To assess the indirect impact of NIH funding, we need to define a universe of life science patents. While we do not want to impose strong restrictions on where NIH funding could have an effect (e.g., by looking in specific disease areas) focusing on a specific subset of the universe of issued patents is necessary because linking NIH publications to patents requires probabilistic matching (see Appendix E), and the rate of false positives is much lower if we restrict the set of potential matches.
To do so, we started with the 5,269,968 patents issued by the USPTO between 1980 and 2012. Then, using the NBER patent categorization described in Hall et al. (31), we focused on patents in the classes belonging to NBER Categories 1 (Chemicals) and 3 (Drugs and Medical). This left 1,310,700 patents. Of these patents, 565,593 cite at least one non-patent reference. Using the algorithm described in Azoulay et al. (32) and Sampat and Lichtenberg (9) we determined that 312,903 patents cite an article indexed in PubMed. We refer to this set—patents in NBER Classes 1 and 3 that cite to at least one PubMed indexed article—as “life science patents.” Classes 1 and 3 cover a range of subcategories, listed in Table B1.
Private sector vs. public sector patents. We are primarily interested in the effect of NIH funding on the rate of production of private-sector patents, excluding those assigned to public research entities such as universities, research institutes, academic medical centers, or government agencies (e.g., the intramural campus of NIH). This focus is justified by our desire to focus on disembodied knowledge flows. Since the Bayh-Dole act, life science academics have considerably increased their rate of patenting (33, 34). Previous scholarship has documented the growing importance of patent-paper pairs (35) where a given piece of academic knowledge gives rise to both an article and a patent listing the authors of the article as inventors and their employer (often a public institution) as assignee. Including these patents in our analyses would make the interpretation of our results (which emphasizes indirect spillovers of knowledge) difficult. To separate private-sector from public-sector patents, we adapted Bronwyn Hall’s patent assignee name matching algorithm to isolate private-sector assignees (36). Using this method, we restrict the sample to 232,276 patents, or 74% of the life science patents. This creates no obvious biases if we limit our inferences to the effects of NIH research on private sector innovation.
Patents on FDA approved drugs. Though a substantial share of the life science patents are “pharmaceuticals” not all are therapeutic molecules or proteins. Even among those that are, there is substantial heterogeneity in value, since only a small share of drugs enter trials, and of these a small share receive marketing approval.
To examine heterogeneity of the effects of NIH funding, and to assess the effects on drug development, we isolated patents associated with drugs. We began with all patents from current and archival versions of the FDA’s Orange Book (officially named Approved Drug Product with Therapeutic Equivalence Evaluations). Since the 1984 Hatch-Waxman Act, branded firms are required to list on the Orange Book patent issued before drug approval with at least one claim covering a drug’s active ingredient, formulation, or methods of use for approved indications. Though there is strong incentive to list patents issued after drug approval as well (37), strictly speaking this is not required.
14 Table B1: Relevant Patent Classes
Cat.
Code Category Name
Sub-Cat.
Code Sub-Category Name Patent Classes
1 Chemical 11 Agriculture, Food, Textiles 8, 19, 71, 127, 442, 504
12 Coating 106,118, 401, 427 13 Gas 48, 55, 95, 96 14 Organic Compounds 534, 536, 540, 544, 546, 548, 549, 552, 554, 556, 558, 560, 562, 564, 568, 570 15 Resins 520, 521, 522, 523, 524, 525, 526, 527, 528, 530 19 Miscellaneous 23, 34, 44, 102, 117, 149, 156, 159, 162, 196, 201, 202, 203, 204, 205, 208, 210, 216, 222, 252, 260, 261, 349, 366, 416, 422, 423, 430, 436, 494, 501, 502, 510, 512, 516, 518, 585, 588
3 Drugs & Medical 31 Drugs 424, 514
32 Surgery & Medical Instruments 128, 600, 601, 602, 604, 606,
607
33 Biotechnology 435, 800
15
Appendix C: Linking NIH Grants to Patents Directly [Bayh-Dole Linkage]
Recipients of NIH grants and contracts are allowed to seek patent protection on project results. This practice emerged in the 1970s under Institutional Patent Arrangements between individual grantees (and contractors) and the Department of Health, Education, and Welfare, and intensified after the implementation of the Bayh-Dole Act in 1981. One Bayh-Dole requirement is for recipients of federal research funds to report to the funding agency any patent application they file. This information is stored in the Interagency Edison (iEdison) database. Another requirement is to acknowledge on patent documents the existence of federal funding and the fact that the government retains certain rights, in so-called “government interest” statements.
Recently iEdison data has been made available through NIH RePORTER. Since there is likely under-reporting of patents by grantees to the NIH (23) our data provide a lower-bound for the share of grants resulting in “Bayh-Dole” patents.
Appendix D: Linking NIH Grants to Publications
that Acknowledge NIH Support
The NIH asks grantees to acknowledge the agency’s support in any publications resulting from a grant, and to do so in a very specific format (38). Since the early 1980s, PubMed has recorded these acknowledgements in a separate field, and we use these data to link every grant in the NIH Compound Grant Applicant File (CGAF) with the publications that result. The process used to systematically map publication-to-grant linkages is relatively straightforward, but may be prone to measurement error. We discuss two potential issues below.
Dynamic linking inconsistency. In the vast majority of the cases, a grant acknowledgement provides a grant mechanism, a funding institute, and a grant serial number (as in R01GM987654), but typically no reference to a particular grant cycle. This limitation is potentially serious, since some of our analyses aim to measure the time elapsed between the receipt of funding and the citation to a publication listed in a patent. This duration is the sum of a publication pendency (the amount of time between grant funding and a publication) and a citation pendency (the amount of time necessary for a patent to cite the publication). Indeterminate grant cycles may add error to the measurement of publication pendency lag.
How did we address this? Our final dataset uses information from 987,799 unique publications that acknowledge a grant funded by NIH. 100% of these acknowledgements occur in a window of ten years before the year in which the article appeared in print. 93% of these publications are linked to the same grant within seven years, 83% within five years, and 47% within two years. To find the relevant grant cycle for each publication acknowledging a grant, we
adopted the following procedure: (i) look up the year of publication tpub for the acknowledging publication; (ii) create
a five year “catchment window” [tpub-5; tpub]; (iii) identify the most recent fiscal year tgrant in that window during which
the grant was funded either as a new grant or as a competitive renewal; and (iv) link the publication to the funding institute identified in the grant acknowledgement, the study section that evaluated this grant according to NIH records,
in the year tgrant. While we cannot directly observe whether a publication was funded by a different grant cycle, we have
verified that our benchmark results are robust to alternative choices for the length of the catchment window: [tpub-2;
16
Overclaiming of publications. NIH grant renewal is dependent on the research and publications stemming from that stream of funding. To our knowledge, NIH does not audit the acknowledgement trail systematically—this is left to the discretion of scientific review officers (the federal employees who manage the flow of information between reviewers in a particular study section and the NIH funding apparatus). Therefore, grantees may have an incentive to “over-attribute” publications—e.g., to credit some publications to the support of a grant, even if they were in fact enabled by other streams of funding. This raises the concern that we identify more linkages between individual grants and patents than are warranted, through the spurious channel of false attributions.
We believe that our results are unlikely to be driven by this behavior. The vast majority of public biomedical research funding in the US comes from NIH, meaning that most scientists do not have meaningful amounts of funding from other sources to support their research (39). Note that while scientists often use grant funding to subsidize research projects that are not directly related to the topic of their grant, in our view these projects should still be counted as a product of grant funding.
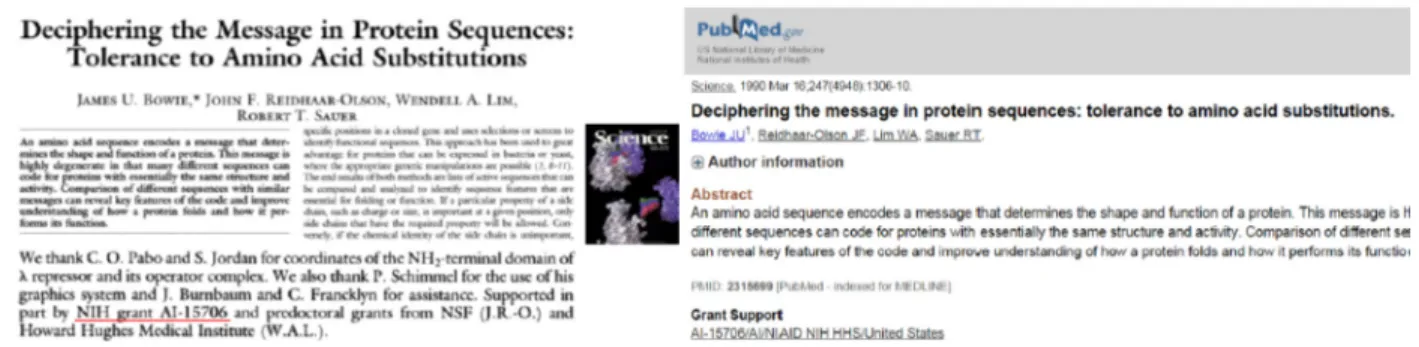
Example. We illustrate the procedure with the case of particular publication, Deciphering the Message in Protein Sequences: Tolerance to Amino Acid Substitutions, by Bowie et al., which appeared in the journal Science on March
16th, 1990 (see the left side of Figure D1). The publication credits grant support from NIH, specifically grant AI-15706.
Despite the fact that this acknowledgement appears at the very end of the paper as the ultimate reference in the bibliography (reference #46 on page 1310), PubMed captures this data accurately (see the right side of Figure D1). Note that the acknowledgement omits the grant mechanism, as well as the leading zero in the grant serial number. These issues, which are typical in the PubMed grant acknowledgement data, turn out to be unimportant. In particular, the National Institute of Allergy and Infectious Diseases (NIAID, code-named AI) has only one grant with serial number 015706: A project R01 grant first awarded to Robert T. Sauer, an investigator in the biology department at MIT, in 1979, and competitively renewed in 1982, 1987, 1992, 1997, and 2002. The grant was evaluated by the BBCA (Molecular and Cellular Biophysics) study section; its title is Sequence Determinants of Protein Structure & Stability, with a budget of $1,211,685 for the cycle that began in 1987, three years before the date of the publication above (whose last author is also Robert Sauer).
17
Appendix E: Linking PubMed References to USPTO Patents
We use patent-publication citation information to identify patents that build on NIH-funded research. Patent applicants are required to disclose any previous patents or articles that are relevant to the patentabilty of their inventions. Failure to do so can result in strong penalties for the applicant and attorney, and invalidation of the patent (40). There is a long history of using patent-patent citation data as measures of intellectual influence or knowledge flows between public and private sector research (41, 42). Recent work (25, 43), however, shows that patent examiners rather than applicants insert many patent-patent citations, casting doubt on their utility as measures of knowledge flows or spillovers (44).
We instead use information on patent citations to published scientific articles. (These “front page” citations are also included in the References Cited section of issued patents.) This is appealing both because publications rather than patents are the main output of scientific researchers (45), but also because the vast majority of patent-paper citations, over 90 percent, come from applicants rather than examiners, and are thus more plausibly indicators of real knowledge flows than patent-patent citations (5). Roach and Cohen (6) provide empirical evidence on this point.
Determining whether patents cite publications is more difficult than tracing patent citations: while the cited patents are unique seven-digit numbers, cited publications are free-form text (46). Moreover, the USPTO does not require that applicants submit references to literature in a standard format. For example, Harold Varmus’s 1988 Science article “Retroviruses” is cited in 29 distinct patents, but in numerous different formats, including Varmus. “Retroviruses” Science 240:1427-1435 (1988) (in patent 6794141) and Varmus et al., 1988, Science 240:1427-1439 (in patent 6805882). As this example illustrates, there can be errors in author lists and page numbers. Even more problematic, in some cases certain fields (e.g. author name) are included, in others they are not. Journal names may be abbreviated in some patents, but not in others.
To address these difficulties, we developed a matching algorithm that compared each of several PubMed fields—first author, page numbers, volume, and the beginning of the title, publication year, or journal name—to all references in all biomedical and chemical patents issued by the USPTO since 1976. Biomedical patents are identified by technology class, using the patent class-field concordance developed by the National Bureau of Economic Research (31). We considered a dyad to be a match if four of the fields from PubMed were listed in a USPTO reference.
Overall, the algorithm returned 1,058,893 distinct PMIDs cited in distinct 322,385 patents. Azoulay, Graff- Zivin, and Sampat (32) report that the algorithm performs well against hand matching, returning correct PMID information 86 percent of the time, with few false positives. In a more recent validation exercise we found similar results when comparing to hand collected references for a sample of patents associated with neurology drugs. For the 314 references, the algorithm returned the correct PMID (including none, in cases when hand matching suggests the reference does not match a PMID) 90 percent of the time. For less than 3 percent of the references the algorithm produced a false positive: it incorrectly found a PMID where hand matching did not find one. For 8 percent of the references the algorithm produced a false negative: hand matching identified a PMID, but the algorithm did not. In our setting, the presence of false negatives means that we will underestimate the share of grants cited in NIH patents.
Example. We illustrate the procedure with the case of particular patent, #6,687,006, issued on March 15, 2005 and assigned to the biopharmaceutical firm Human Genome Sciences, Inc. In the section of the patent entitled “Other Publications”, we can find a citation to “Bowie, J.U., et al., Deciphering the Message in Protein Sequences…,” precisely the publication we took as an example in Appendix D.
18 Figure E1: Example of Patent-to-Publication Citation
19
Appendix F: “Measuring Basicness”
Linking NIH Grants and their Abstracts to MeSH Keywords
An important and longstanding challenge in understanding the allocation of research funding across types of research has been the ability to classify grants according to the “basicness” of the research they support.
We attempt to capture different dimensions of basicness. For several of the measures we use information from the title and full-text abstract for each grant (47). Specifically, we map words in the title and abstract to terms from the MeSH thesaurus, using a natural language processing tool, the Medical Text Indexer (MTI), a natural language processing tool which enables researchers to map full text paragraphs onto the MeSH controlled thesaurus (48). We batch process each grant title and abstract with the MTI tool, resulting in 18,557,642 unique grant-MeSH term combinations for 1,423,873 distinct grant applications. On average, MTI maps a grant to 13 MeSH terms. (The median is also 13; the range is from one to 101).
The MeSH keywords are used to construct three of the measures. The first is whether a grant is targeted at a particular disease. 4,586 unique MeSH terms (16.70% of the terms in the MeSH thesaurus) correspond to diseases (49). 52.54% of the grants in the data are supporting research that is targeted at a disease. Figure F1 provides a graph for the evolution of the relative importance of disease vs. non-disease targeted research over time.
Another measure based on the MeSH hierarchy is based the model organism that NIH-funded PIs rely upon for their research. Although there is a long list of potential model organisms, there is a shorter list of organisms that have been used extensively over the years as common models, making them standards in research. Examples include the fruit fly drosophila melanogaster, the tapeworm caenorhabditis elegans, the zebrafish danio reiro, the yeast saccharomyces cerevisiae, or the plant arabidopsis thaliana, in addition to mammals such as mice, rats, and non-human primates. Helpfully, model organisms can be identified unambiguously through MeSH terms as well. 2,508 unique MeSH terms (9.13% of the terms in the MeSH thesaurus) correspond to model organisms (50). Model organisms differ in their costs, the number of offspring they generate, reproduction time, and biological complexity. We divide model organisms in the following ten categories, from least to most complex: (i) viruses; (ii) prokaryotes; (iii) unicellular eukaryotes; (iv) multicellular eukaryotes; (v) invertebrates; (vi) rodents; (vii) other mammals; (viii) primates; and finally (ix) humans. Figure F2 provides a frequency distribution of these organisms in the grant data, focusing only on the set of grants that are not disease-targeted (51). Humans are most commonly studied, followed by rodents. The analyses also distinguish between patient-oriented research and other research. We use the same approach for constructing this measure. In a third measure, grants studying the “human” organism are classified as patient-oriented. To measure the fourth dimension of basicness, we take a different approach. This measure is not based on grant keywords, but rather whether the grant is the result of a Request for Applications (RFA). RFAs are used by the NIH to solicit specific research, and are viewed as more targeted grants than “investigator-initiated” research projects (19, 52). We obtained data on which grants were the result of RFAs from NIH RePORTER.
It is difficult to validate our measures against an objective yardstick of basicness since, to our knowledge, none exists. One intuitive check is to examine whether grants funded by the National Institute of General Medical Sciences (NIGMS)—which considers itself the Institute most responsible for funding basic research (53)—are indeed more basic according to our measures of disease and patient orientation. We find that NIGMS grants are less likely to be disease-oriented (19 percent vs. 54 percent for all other institutes) and less likely to be patient-oriented (23 percent vs. 52 percent), providing some evidence of face validity. Further, though our basicness designations capture different dimensions, they are also internally consistent: for example, among non-disease oriented grants, 34 percent focus on humans, compared to 63 percent among disease-oriented grants.
20
Figure F1: Disease-Targeted vs. Non-Disease Targeted Grants, 1972-2007
Figure F2: Classification by Model Organisms. N=365,380 grants, not disease-targeted
Type Example Frequency
Viruses bacteriophage 8,290 1.79%
Prokaryotes escherichia coli 21,994 4.74%
Unicellular eukaryotes saccharomyces cerevisiae 8,937 1.92%
Multicellular eukaryotes cryptococcus neoformans 9,163 1.97%
Invertebrates caenorhabditis elegans 15,057 3.24%
Vertebrates xenopus laevis 13,785 2.97%
Rodents rats, sprague-dawley 69,472 14.96%
Other mammals rabbits 31,377 6.76%
Non-human Primates macaca mulatta 4,515 0.97%
21
Appendix G: Discrete-time Hazard Models
The analysis presented in the main body of the manuscript consists of plots of the proportion of grants that are linked (directly or indirectly) to patents, by grant age. The advantage of this graphical approach is that it is transparent and non-parametric. There are two main disadvantages. First, these curves conflate analysis time and calendar time, by pooling grants t years after issue, regardless of the calendar year in which they were awarded. Second, the graphical approach does not lend itself easily to multiple levels of stratification.
Accordingly, as a complement to the graphical exposition, we also provide multivariate analyses below. In order to accommodate the discrete nature of patenting events, we employ discrete-time hazard rate models (54, 55). The use of discrete-time models (as opposed to continuous-time models such as the Cox (56) is motivated by the fact that survival times in our data are grouped into discrete intervals (years). For a grant i during experience interval t, let the
discrete-time hazard rate be pit = Prob[Ti = t | Ti ≥ t, Xi ], where Ti is the time at which grant i experiences an event and
Xi a vector of covariates.
Discrete-time survival models can be estimated via maximum likelihood. Estimation makes use of the property that the sample likelihood can be rewritten in a form identical to the likelihood for a binary dependent variable and applied to a specially organized dataset (57). Specifically, we use a logistic regression function to link the hazard rate with time and the explanatory covariates:
1
where pit is a set of experience interval indicator variables. This is otherwise known as the discrete-time proportional
hazards model, with a piecewise constant baseline hazard (58).
Covariates. Covariates include characteristics of the grant and its principal investigator (PI). Grant-specific covariates include: (i) an indicator for new grant application (to distinguish them from competing continuations); (ii) the budget of the grant (deflated by the Producer Price Index for Biomedical R&D) over it entire cycle; (iii) and the grant type (fellowship and training grants, R01 and R01-equivalent project grants, research center grants, and other research grants). PI-level covariates were obtained by merging the NIH Compound Applicant Grant File (CGAF) with the Faculty Roster from the Association of American Medical Colleges (AAMC). Included in the specifications are: (i) an indicator variable for PI gender (assigned probabilistically based on first names); (ii) PI highest degree (MD, PhD, or MD/PhD—we dropped from the samples a handful of grants where the PI’s highest degree was a Master’s degree); and (iii) the PI’s career age and its square.
In addition to these control covariates, our specifications also include several variables of more substantive interest: whether the grant is disease-oriented; whether it is patient-oriented; and whether the application is a response to a Request for Application (RFA). All specifications also include a full set of funding institute indicator variables, funding year indicator variables, and organism indicator variables.
Sample and Results. The resulting sample includes 226,781 grants funded between the years 1980 and 2005. This is smaller than the sample in the main body of the manuscript because the PI covariates are not available for the universe of grants, but only for the subsample of grant applicants who appeared in the AAMC Faculty Roster between 1980 and 2005. We separately model four distinct events. The first model, reported in Column 1, focuses on whether the grant is associated with a patent through a direct (Bayh-Dole) link or through an indirect (citation) link. The second column reports results form a model that limits the patents to those with indirect (citation) links. The third column restricts the sample further, to only private sector assignees. Finally the fourth focused only on patents associated with FDA-approved drugs.
22
Table G1 displays the results as exponentiated coefficients. (Coefficient estimates equal to 1.00 mean a variable has no effect.) The results are consistent across columns. Grants from female PIs are much less likely to be associated with a patent, a finding consistent with prior research (59). The propensity for a grant to be linked to a patent decreases monotonically with PI age, and PIs with only a PhD degree are less likely to see their grants associated with patents, relative to MD-degree and MD/PhD- degree holders.
Of the grant level covariates, we find that the budget of a grant clearly matters. In the first column, the average marginal effect for the grant budget covariate implies that a 1% increase in budget boosts the odds of being associated with a patent by about 1% (recall that we already hold constant grant type). New grant applications are also much less likely to yield a patent than are follow-on grant cycles.
There is no clear pattern across the measures in the effects of “basicness.” Disease-oriented grants are associated with a 15 to 20% greater patent propensity, but this is not the case for patient-oriented grants, even controlling for other organism types. Grants that were funded through requests for applications are less likely to be associated with a patent, though this effect is not statistically significant.
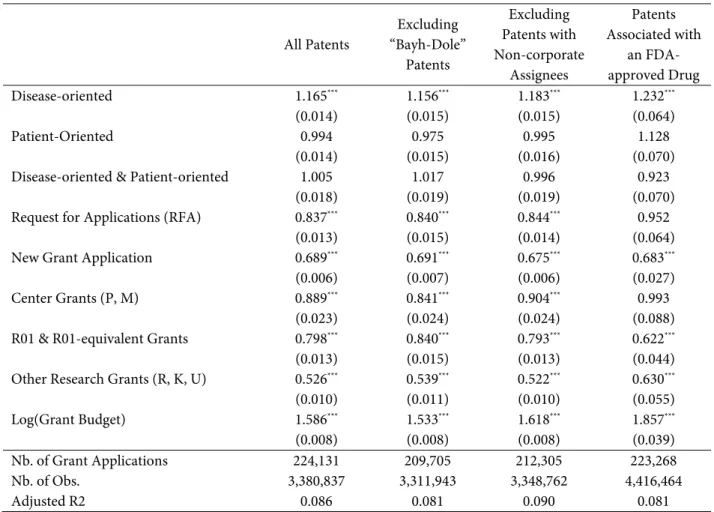
Table G2 replicates the specifications displayed in Table G1, with one modification: we omit the PI gender, age, and degree variables which cannot be shared publicly because of our license with AAMC. The results are qualitatively similar.
Table G3 provides evidence that we can separately identify the effects of the different measures of “basicness,” by introducing them one-by-one into the model (the risk modeled is that of a link, direct or indirect, to any life science patent). Column 6 of Table G3 and the first column of Table G1 are identical.
23 Table G1: Discrete-time Hazard Specifications
All Patents Excluding “Bayh-Dole” Patents Excluding Patents with Non-corporate Assignees Patents Associated with an FDA-approved Drug Disease-oriented 1.148*** 1.140*** 1.164*** 1.185** (0.014) (0.015) (0.015) (0.062) Patient-Oriented 0.993 0.975 0.994 1.099 (0.015) (0.015) (0.016) (0.068)
Disease-oriented & Patient-oriented 0.998 1.010 0.988 0.911
(0.017) (0.019) (0.019) (0.069)
Request for Applications (RFA) 0.839*** 0.842*** 0.844*** 0.953
(0.014) (0.015) (0.015) (0.064)
New Grant Application 0.652*** 0.656*** 0.639*** 0.644***
(0.006) (0.007) (0.006) (0.026)
Center Grants (P, M) 0.910*** 0.863*** 0.922** 0.998
(0.024) (0.026) (0.025) (0.091)
R01 & R01-equivalent Grants 0.838*** 0.882*** 0.834*** 0.697***
(0.014) (0.016) (0.015) (0.051)
Other Research Grants (R, K, U) 0.539*** 0.553*** 0.533*** 0.637***
(0.010) (0.011) (0.011) (0.056) Log(Grant Budget) 1.601*** 1.544*** 1.631*** 1.867*** (0.008) (0.009) (0.009) (0.041) MD 0.946*** 0.932*** 0.944*** 1.327*** (0.015) (0.016) (0.016) (0.087) PhD 0.788*** 0.786*** 0.773*** 0.826** (0.011) (0.012) (0.012) (0.052) Female PI 0.739*** 0.753*** 0.725*** 0.650*** (0.008) (0.009) (0.009) (0.039) PI Career Age 0.982*** 0.984*** 0.983*** 0.961*** (0.001) (0.001) (0.001) (0.006)
PI Career Age, squared 1.000*** 1.000*** 1.000*** 1.001***
(0.000) (0.000) (0.000) (0.000)
Nb. of Grant Applications 224,131 209,705 212,305 223,268
Nb. of Obs. 3,380,837 3,311,943 3,348,762 4,416,464
Adjusted R2 0.089 0.083 0.093 0.085
Note: Estimates from logistic specifications. All models incorporate a full suite of application year effects, funding institute effects, grant type effects, and organism type effects. Displayed estimates correspond to exponentiated coefficients. For example, the estimates in the first column imply that disease-oriented grants are 14.8% more likely than non-disease, non-patient-oriented grants to be associated with a patent.
24
Table G2: Discrete-time Hazard Specifications, with publicly available data
All Patents Excluding “Bayh-Dole” Patents Excluding Patents with Non-corporate Assignees Patents Associated with an FDA-approved Drug Disease-oriented 1.165*** 1.156*** 1.183*** 1.232*** (0.014) (0.015) (0.015) (0.064) Patient-Oriented 0.994 0.975 0.995 1.128 (0.014) (0.015) (0.016) (0.070)
Disease-oriented & Patient-oriented 1.005 1.017 0.996 0.923
(0.018) (0.019) (0.019) (0.070)
Request for Applications (RFA) 0.837*** 0.840*** 0.844*** 0.952
(0.013) (0.015) (0.014) (0.064)
New Grant Application 0.689*** 0.691*** 0.675*** 0.683***
(0.006) (0.007) (0.006) (0.027)
Center Grants (P, M) 0.889*** 0.841*** 0.904*** 0.993
(0.023) (0.024) (0.024) (0.088)
R01 & R01-equivalent Grants 0.798*** 0.840*** 0.793*** 0.622***
(0.013) (0.015) (0.013) (0.044)
Other Research Grants (R, K, U) 0.526*** 0.539*** 0.522*** 0.630***
(0.010) (0.011) (0.010) (0.055) Log(Grant Budget) 1.586*** 1.533*** 1.618*** 1.857*** (0.008) (0.008) (0.008) (0.039) Nb. of Grant Applications 224,131 209,705 212,305 223,268 Nb. of Obs. 3,380,837 3,311,943 3,348,762 4,416,464 Adjusted R2 0.086 0.081 0.090 0.081
Note: Estimates from logistic specifications. All models incorporate a full suite of application year effects, funding institute effects, grant type effects, and organism type effects. Displayed estimates correspond to exponentiated coefficients. For example, the estimates in the first column imply that disease-oriented grants are 14.8% more likely than non-disease, non-patient-oriented grants to be associated with a patent.
25 Table G3: Discrete-time Hazard Specifications, All Patents
(1) (2) (3) (4) (5) (6)
Disease-oriented 1.143*** 1.185*** 1.148***
(0.010) (0.014) (0.014)
Patient-Oriented 0.957*** 0.948*** 0.993
(0.009) (0.013) (0.015)
Disease-oriented & Patient-oriented 0.958* 0.998
(0.017) (0.017)
Request for Applications (RFA) 0.838*** 0.839***
(0.014) (0.014)
New Grant Application 0.640*** 0.635*** 0.642*** 0.639*** 0.654*** 0.652***
(0.006) (0.006) (0.006) (0.006) (0.006) (0.006)
Center Grants (P, M) 0.939* 0.932** 0.942* 0.936* 0.935* 0.910***
(0.025) (0.024) (0.025) (0.025) (0.025) (0.024)
R01 & R01-equivalent Grants 0.895*** 0.866*** 0.905*** 0.878*** 0.887*** 0.838***
(0.014) (0.014) (0.014) (0.014) (0.014) (0.014)
Other Research Grants (R, K, U) 0.548*** 0.530*** 0.556*** 0.541*** 0.561*** 0.539***
(0.010) (0.010) (0.010) (0.010) (0.010) (0.010) Log(Grant Budget) 1.581*** 1.577*** 1.584*** 1.582*** 1.599*** 1.601*** (0.008) (0.008) (0.008) (0.008) (0.008) (0.008) MD 0.947*** 0.936*** 0.950** 0.941*** 0.950*** 0.946*** (0.015) (0.015) (0.015) (0.015) (0.015) (0.015) PhD 0.778*** 0.788*** 0.776*** 0.785*** 0.777*** 0.788*** (0.011) (0.011) (0.011) (0.011) (0.011) (0.011) Female PI 0.742*** 0.738*** 0.744*** 0.742*** 0.743*** 0.739*** (0.008) (0.008) (0.008) (0.008) (0.008) (0.008) PI Career Age 0.982*** 0.982*** 0.982*** 0.982*** 0.982*** 0.982*** (0.001) (0.001) (0.001) (0.001) (0.001) (0.001)
PI Career Age, squared 1.000*** 1.000*** 1.000*** 1.000*** 1.000*** 1.000***
(0.000) (0.000) (0.000) (0.000) (0.000) (0.000)
Nb. of Grant Applications 224,131 224,131 224,131 224,131 224,131 224,131
Nb. of Obs. 3,380,837 3,380,837 3,380,837 3,380,837 3,380,837 3,380,837
Adjusted R2 0.087 0.088 0.087 0.088 0.088 0.089
Note: Estimates from logistic specifications. All models incorporate a full suite of application year effects, funding institute effects, grant type effects, and organism type effects. Displayed estimates correspond to exponentiated coefficients. For example, the estimates in column 6 imply that disease-oriented grants are 14.8% more likely than non-disease, non-patient-oriented grants to be associated with a patent.
Robust standard errors in parentheses, clustered at the level of the grant. †p < 0.10, *p < 0.05, **p < 0.01.
References and Notes:
1. V. Bush, Science: The Endless Frontier. (Washington, DC: US General Printing Office, 1945).
2. H. Varmus, The Art and Politics of Science. (W. W. Norton & Company, 2009).
3. H. Moses, E. R. Dorsey, D. H. M. Matheson, S. O. Thier, Financial Anatomy of Biomedical Research. JAMA
303, 1333-1342 (2005).
26
5. M. A. Lemley, B. Sampat, Examiner Experience and Patent Office Outcomes. Review of Economics and
Statistics 94, 817-827 (2012).
6. M. Roach, W. M. Cohen, Lens or Prism? Patent Citations as a Measure of Knowledge Flows from Public
Research. Management Science 59, 504-525 (2013).
7. A. J. Stevens et al., The Role of Public-Sector Research in the Discovery of Drugs and Vaccines. New England
Journal of Medicine 364, 535-541 (2011).
8. M. J. Kalutkiewicz, R. L. Ehman, Patents as Proxies: NIH Hubs of Innovation. Nature Biotechnology 32,
536-537 (2014).
9. B. N. Sampat, F. R. Lichtenberg, What Are the Respective Roles of the Public and Private Sectors in
Pharmaceutical Innovation? Health Affairs 30, 332-339 (2011).
10. B. N. Sampat, H. A. Pincus, Citations in Life Science Patents to Publicly Funded Research at Academic
Medical Centers. Clinical & Translational Science 8, 759-763 (2015).
11. F. Narin, K. S. Hamilton, D. Olivastro, The Increasing Linkage Between US Technology and Public Science.
Research Policy 26, 317-330 (1997).
12. Note that these two channels are not mutually exclusive.
13. J. H. Comroe, R. D. Dripps, Scientific Basis for the Support of Biomedical Science. Science 192, 105-111
(1976).
14. D. Stokes, Pasteur’s Quadrant: Basic Science and Technological Innovation. (Brookings Institution Press,
Washington, DC, 1997).
15. J. H. Marburger III, Wanted: Better Benchmarks. Science 308, 1087 (2005).
16. K. Pavitt, What Makes Basic Research Economically Useful? Research Policy 20, 109-119 (1991).
17. D. Partha, P. A. David, Toward a New Economics of Science. Research Policy 23, 487-521 (1994).
18. G. L. Westbrook, “Basic Research Considerations for NINDS: Analysis and Recommendations” (2009).
19. L. E. Rosenberg, “Scientific Opportunities and Public Needs: Improving Priority Setting and Public Input at
the National Institutes of Health” (Report of the Committee on the NIH Research Priority-Setting Process, Institute of Medicine, 1998).
20. S. Fields, M. Johnston, Whither Model Organism Research? Science 307, 1885-1886 (2005).
21. Brown (2003) provides an illustration of this point in his case study of research on the tiny hermaphrodite
worm caenorhabditis elegans.
22. A. Brown, In the Beginning Was the Worm: Finding the Secrets of Life in a Tiny Hermaphrodite. (Columbia
University Press, New York, 2003).
23. A. Rai, B. Sampat, Accountability in Patenting of Federally-funded Research. Nature Biotechnology 30, 953
(2012).
24. C. A. Cotropia, M. A. Lemley, B. Sampat, Do Applicant Patent Citations Matter? Research Policy 42, 844-854
(2013).
25. B. N. Sampat, When Do Applicants Search for Prior Art? Journal of Law and Economics 53, 399-416 (2010).
26. D. C. Mowery, B. N. Sampat, in Essays in Honor of Edwin Mansfield: The Economics of R&D, Innovation, and
Technological Change, A. N. Link, F. M. Scherer, Eds. (Springer, New York, 2005), pp. 233-245.
27. C. Macilwain, Science Economics: What Science Is Really Worth. Nature 465, 682-684 (2010).
28. M. Trajtenberg, R. M. Henderson, A. B. Jaffe, University vs. Corporate Patents: A Window on the Basicness
of Innovations. Economics of Innovation and New Technology 5, 19-50 (1997).
29. NIH, Mission and Goals. https://www.nih.gov/about-nih/what-we-do/mission-goals. Last accessed
December 29, 2016., (2015).
30. D. Li, Expertise versus Bias in Evaluation: Evidence from the NIH. American Economic Journal: Applied
Economics (Forthcoming).
31. B. H. Hall, A. Jaffe, M. Trajtenberg, The NBER Patent Citation Data File: Lessons, Insights and
27
32. P. Azoulay, J. S. G. Zivin, B. N. Sampat, in The Rate & Direction of Inventive Activity Revisited, J. Lerner, S.
Stern, Eds. (University of Chicago Press, Chicago, IL, 2012), chap. 2, pp. 107-155.
33. P. Azoulay, W. Ding, T. Stuart, The Effect of Academic Patenting on the Rate, Quality, and Direction of
(Public) Research Output. Journal of Industrial Economics 57, 637-676 (2009).
34. P. Azoulay, W. Ding, T. Stuart, The Determinants of Faculty Patenting Behavior: Demographics or
Opportunities? Journal of Economic Behavior & Organizations 63, 599-623 (2007).
35. F. Murray, S. Stern, Do Formal Intellectual Property Rights Hinder the Free Flow of Scientific Knowledge?
Journal of Economic Behavior and Organization 63, 648-687 (2007).
36. http://eml.berkeley.edu/~bhhall/pat/namematch.html. Note that this creates no obvious biases if we limit our inferences to the effects of NIH research on private sector innovation.
37. C. S. Hemphill, B. N. Sampat, Evergreening, Patent Challenges, and Effective Market Life In Pharmaceuticals.
Journal of Health Economics 31, 327-339 (2012). 38. http://grants.nih.gov/grants/acknow.htm.
39. NIH accounted for 70% of the research budget of academic medical centers in 1997 (Commonwealth Fund
Task Force on Academic Health Centers 1999); within Graduate Schools of Arts and Sciences, who cannot rely on clinical income to support the research mission, one would expect the NIH share to be greater still. As a practical matter, supplementary analyses (available on request) show that the main results are unchanged if we exclude grants to PIs with any concurrent HHMI funding, to those who were ever HHMI investigators, and to those with multiple concurrent NIH grants.
40. B. N. Sampat, Academic Patents and Access to Medicines in Developing Countries. American Journal of
Public Health 99, 9-17 (2009).
41. A. B. Jaffe, M. Trajtenberg, Patents, Citations, and Innovations: A Window on the Knowledge Economy. (The
MIT Press, 2005).
42. F. Narin, D. Olivastro, Status Report: Linkage between Technology and Science. Research Policy 21, 237-249
(1992).
43. J. Alcácer, M. Gittelman, B. Sampat, Applicant and Examiner Citations in U.S. Patents: An Overview and
Analysis. Research Policy 38, 415-427 (2009).
44. J. Alcácer, M. Gittelman, Patent Citations as a Measure of Knowledge Flows: The Influence of Examiner
Citations. Review of Economics and Statistics 88, 774-779 (2006).
45. A. Agrawal, R. Henderson, Putting Patents in Context: Exploring Knowledge Transfer from MIT.
Management Science 48, 44-60 (2002).
46. J. Callaert, B. Van Looy, A. Verbeek, K. Debackere, B. Thijs, Traces of Prior Art: An Analysis of Non-Patent
References Found in Patent Documents. Scientometrics 69, 3-20 (2006).
47. Downloaded from the NIH Reporter web site at https://exporter.nih.gov/crisp_catalog.aspx.
48. https://ii.nlm.nih.gov/MTI/. MeSH is the National Library of Medicine’s controlled vocabulary thesaurus. It consists of sets of terms naming descriptors in a hierarchical structure that permits searching at various levels of specificity. There are 27,455 descriptors in the 2015 MeSH edition used in this manuscript.
49. For instance, MeSH term C02.782.815.616.400.040 correspond to “Acquired Immunodeficiency Syndrome.”
All disease terms are in one branch of the MeSH tree—all of them begin with the letter C.
50. For instance, MeSH term B01.050.150.900.090.180.610.500 correspond to xenopus laevis, a common type of
aquatic frog often used in developmental biology. All model organisms are in one branch of the MeSH tree— all of them begin with the letter B (including humans).
51. When a grant is tagged by more than one such model organism, we assign to it the organism that is the most
biologically complex.
52. B. N. Sampat, Mission-oriented Biomedical Research at the NIH. Research Policy 41, 1729-1741 (2012).