Publisher’s version / Version de l'éditeur:
Vous avez des questions? Nous pouvons vous aider. Pour communiquer directement avec un auteur, consultez la
première page de la revue dans laquelle son article a été publié afin de trouver ses coordonnées. Si vous n’arrivez pas à les repérer, communiquez avec nous à PublicationsArchive-ArchivesPublications@nrc-cnrc.gc.ca.
Questions? Contact the NRC Publications Archive team at
PublicationsArchive-ArchivesPublications@nrc-cnrc.gc.ca. If you wish to email the authors directly, please see the first page of the publication for their contact information.
https://publications-cnrc.canada.ca/fra/droits
L’accès à ce site Web et l’utilisation de son contenu sont assujettis aux conditions présentées dans le site LISEZ CES CONDITIONS ATTENTIVEMENT AVANT D’UTILISER CE SITE WEB.
Analytical Chemistry, 91, 6, pp. 4164-4171, 2019-03-19
READ THESE TERMS AND CONDITIONS CAREFULLY BEFORE USING THIS WEBSITE. https://nrc-publications.canada.ca/eng/copyright
NRC Publications Archive Record / Notice des Archives des publications du CNRC :
https://nrc-publications.canada.ca/eng/view/object/?id=ac19ab5b-64c8-4c28-9041-783f81df564b https://publications-cnrc.canada.ca/fra/voir/objet/?id=ac19ab5b-64c8-4c28-9041-783f81df564b
NRC Publications Archive
Archives des publications du CNRC
This publication could be one of several versions: author’s original, accepted manuscript or the publisher’s version. / La version de cette publication peut être l’une des suivantes : la version prépublication de l’auteur, la version acceptée du manuscrit ou la version de l’éditeur.
For the publisher’s version, please access the DOI link below./ Pour consulter la version de l’éditeur, utilisez le lien DOI ci-dessous.
https://doi.org/10.1021/acs.analchem.9b00020
Access and use of this website and the material on it are subject to the Terms and Conditions set forth at
High-precision measurements of the isotopic composition of common
lead using MC-ICPMS: comparison of calibration strategies based on
full gravimetric isotope mixture and regression models
Tong, Shuoyun; Meija, Juris; Zhou, Lian; Methven, Brad; Mester, Zoltán;
Yang, Lu
High-Precision Measurements of the Isotopic Composition of
Common Lead Using MC-ICPMS: Comparison of Calibration
Strategies Based on Full Gravimetric Isotope Mixture and
Regression Models
Shuoyun Tong,
†,‡Juris Meija,
‡Lian Zhou,
†Brad Methven,
‡Zoltán Mester,
‡and Lu Yang
*
,‡†
State Key Laboratory of Geological Processes and Mineral Resources, School of Earth Science, China University of Geosciences, Wuhan 430074, People’s Republic of China
‡
National Research Council Canada, 1200 Montreal Road, Ottawa, Ontario K1A 0R6, Canada
*
S Supporting InformationABSTRACT: The determination of isotope ratios of lead
finds many important applications in earth and planetary
sciences. In this study, we report the first independent and fully calibrated absolute isotope ratio measurements of a common lead since the seminal work by the NIST in the 1960s, which has provided the widely used standards SRM 981 and SRM 982. This work employs MC-ICPMS for the absolute isotope ratio measurements, which were calibrated using two independent methods: the full gravimetric isotope mixture method based on the use of all four near-pure lead isotopes (the first application of this primary method to lead) and the regression method with NIST SRM 997 thallium
isotopic standard as the primary calibrator. Both calibration methods provide results consistent to a few parts in 104, which were
used to characterize isotope ratios of lead in an NRC candidate reference material, high-purity common lead HIPB-1.
1. INTRODUCTION
The natural variability of the atomic weight of lead was
demonstrated over a century ago,1 and this observation has
led to numerous important applications. A classic early example of the utility of lead isotope ratio measurements is
the elucidation of the age of earth.2 As Richards noted in his
1919 Nobel lecture, the natural variations of the atomic weights of lead are not only characteristic of the specimens concerned but also provide us clues as to their origin and
history.3 Modern applications of lead isotope ratios in earth
and planetary sciences require high precision and
accu-racy.4−21 Thermal ionization mass spectrometry (TIMS) and
multicollector inductively coupled plasma mass spectrometry (MC-ICPMS) are the two most commonly used instruments for lead isotope ratio measurements, with MC-ICPMS
gradually becoming the method of choice.22
In comparison to TIMS, MC-ICPMS exhibits an approximately 10-fold larger instrumental isotopic
fractiona-tion effect (also known as the mass bias).22 To obtain
accurate isotope ratios, it is therefore essential to correct for this discrimination effect, which typically remains the single largest source of uncertainty in the measurement process. The majority of this bias can be modeled using well-established mass-dependent laws, such as the exponential
law.22However, many isotopes (e.g., Nd, Ce, W, Sr, Ge, Pb,
Hg, Si, Hf, Ba, and Os isotopes) are known to exhibit
instrumental fractionation which cannot be explained by the mass difference of the nuclide masses alone, a phenomenon
known as mass-independent fractionation (MIF).22
Con-sequently, proper correction of instrumental isotopic fractionation is necessary when MC-ICPMS is used. Most applications of isotope ratio measurements rely on properly characterized reference materials to calibrate the instruments. In fact, two certified reference materials from the National
Institute of Standards and Technology (NIST)23 have
underpinned virtually all lead isotope ratio calibrations worldwide for the past 50 yearsthe common lead standard
SRM 981 and the equal atom lead standard SRM 982.24Both
SRM 981 and SRM 982 were based on TIMS measurements and gravimetric mixture calibration of two near-pure isotopes,
206Pb and 208Pb, to derive the isotope ratio calibration factor
K208/206, whereas other two calibration factors, K207/206 and
K204/206, were derived from K208/206using a linear function. As
detailed elsewhere,22 although this simplified two-isotope
mixing approach obviates the use of all enriched materials to cut down the cost and efforts associated with the character-ization of the pure isotopes, it requires the use of a mass-dependent fractionation model to derive K values for other
Received: January 2, 2019
Accepted: February 25, 2019
Published: March 7, 2019
pubs.acs.org/ac
Cite This:Anal. Chem. 2019, 91, 4164−4171
Downloaded by NATL RESEARCH COUNCIL CANADA at 12:03:33:462 on May 23, 2019
isotope pairs, which in turn might produce biased results for isotopes that display MIF in MC-ICPMS.
In this work, the full gravimetric isotope mixture (FGIM) method is developed for mass bias correction, a primary method that is based on the use of all four near-pure lead
isotopes (204Pb,206Pb,207Pb, and 208Pb) and six independent
binary mixtures each at a 1:1 isotope ratio. This redundancy in calibration protocol allows for enhanced confidence in the resultant isotopic fractionation calibration factors. To the best of our knowledge, this is the first application of this novel isotope mixture analysis to lead. In addition, we have also
employed a cost-effective regression method25−27 which
utilizes NIST SRM 997 thallium isotopic standard as the primary calibrator. Considering the costs of materials, procuring all four lead isotopes in nearly 1 g quantities cost us approximately 40 times more than the thallium standard. Both methods are able to deal with mass-independent fractionation effects, and both provide results
consistent to a few parts in 104, which is a further testament
to the validity of the regression method for high-precision isotope ratio measurements.
2. EXPERIMENTAL SECTION
2.1. Materials and Reagents. Near-pure separated lead
isotopes in metal form (204Pb, 206Pb, 207Pb, and 208Pb,
designated herein as materials A−D, respectively) were purchased from Oak Ridge National Laboratory (Oak Ridge TN, USA). The chemical purity of the lead-206 (B) was determined by glow discharge mass spectrometry (GDMS) at the NRC. Afterward, these four near-pure lead
metals were cleaned with 5% HNO3(nitric acid in this work
was prepared on a by-volume basis), rinsed with water, and dried in a class 10 fume hood before their quantitative
dissolution in 30% HNO3. Dilution was performed to yield
mass fractions of w(Pb,A) = 1997.0 mg kg−1, w(Pb,B) =
7686.6 mg kg−1, w(Pb,C) = 1998.0 mg kg−1, and w(Pb,D) =
1998.1 mg kg−1, respectively. Working standard solutions of
lead isotope materials of w(Pb,A) = 14.965 mg kg−1, w(Pb,B)
= 14.978 mg kg−1, w(Pb,C) = 14.605 mg kg−1, and w(Pb,D)
= 14.929 mg kg−1, respectively, were gravimetrically prepared
by serial dilution of their perspective stocks in 2% HNO3.
High-purity lead (NRC candidate CRM HIPB-1) is a 2.4 mm diameter lead metal wire which was sourced from ESPI Metals (Ashland, OR, USA). It was cut into ca. 2000 1 g pieces of 22 mm length using a wire electrical discharge machine at the NRC and bottled in 4 mL glass vials filled
with argon. More details are provided in the Supporting
Information.
2.2. Instrumentation. A VG 9000 (VG Microtrace,
Windford, U.K., subsequently supported by Thermo Fisher Scientific; Waltham, MA, USA) reverse Nier−Johnson magnetic sector high resolution GDMS was used in this work for purity measurements. It was fitted with a pin-source tantalum cell that was cooled to near liquid nitrogen temperature (to minimize outgassing as the discharge heats). A combination of Faraday and Daly detector systems with a linear range of 10 orders of magnitude, which are conveniently cross-calibrated through use of argon isotopes
from the discharge gas (38Ar+ and 40Ar+) permits impurity
elements to be determined at ng g− 1 levels. The
determination of purity of material B (206Pb) followed the
protocol reported in previous studies,28,29 with the exception
that all four lead isotopes were used to derive the mass
fractions of impurity elements. The purity (mass fraction) of
lead in the material B (206Pb) was obtained by the mass
balance method from the measured elemental impurities. All elements present below the detection limit were treated as if they were present at levels equal to half their detection limit.
Details on sample preparation are given in the Supporting
Information.
A Thermo Fisher Scientific Neptune Plus (Bremen, Germany) MC-ICPMS instrument equipped with nine Faraday cups and a combination of cyclonic and Scott-type spray chambers with a PFA self-aspirating nebulizer MCN50 (Elemental Scientific; Omaha, NE, USA) operating at 50 μL
min−1 was used for all isotope ratio measurements at the
NRC. The plug-in quartz torch was fitted with a platinum guard electrode. A low-resolution mode was used in this study. Optimization of the Neptune was performed as recommended by the manufacturer’s manual; typical
operating conditions are summarized inTable S1.
A high-resolution ICPMS Element XR (Thermo Fisher Scientific; Bremen, Germany) was used to determine the elemental impurities in the other three near-pure lead isotope
materials (A, 204Pb; C, 207Pb; D, 208Pb) at the NRC. The
HR-ICPMS instrument was equipped with a combination of
cyclonic and Scott-type spray chambers, a 50 μL min−1
MCN50 PFA nebulizer (Elemental Scientific; Omaha, NE, USA), a plug-in quartz torch with a quartz injector, and a platinum guard electrode and was operated under standard conditions.
A four-digit Mettler Toledo balance AG245 (Fisher Scientific, Ottawa ON, Canada) was used to weigh all samples.
2.3. Sample Preparation and Analysis for Lead Isotope Ratio Measurements Using a Full Gravimetric Isotope Mixture (FGIM) Isotopic Fractionation
Correc-tion Model by MC-ICPMS.Fifteen stock solutions (labeled
Pb1−Pb15) of HIPB-1 were prepared. The lead pins, each
weighing approximately 1 g, were cleaned with 10% HNO3
for 10 min, rinsed with water, and dried under argon. The pins were weighted, individually dissolved in 20 mL of 30%
HNO3 with mild heating, and diluted with deionized water,
resulting in a nominal mass fraction of w(Pb) = 8000 mg
kg−1. A mixed stock solution (labeled Pb
mix) was prepared by
blending equal aliquots (2 g each) of Pb1−Pb15 solutions
which were used for the isotope amount ratio measurements in HIPB-1.
Five sets of solution mixtures such as a typical set of
solutions given inTable S2 were gravimetrically prepared by
weighing suitable amounts of pure isotope solutions of A−D
followed by dilution with 2% HNO3 to result in a mass
fraction of 0.75 mg kg−1of lead. Individual solutions of A−D
were prepared similarly to contain the same amount of total
Pb, as given in Table S2. A sample solution of HIPB-1 was
prepared by dilution of Pbmixin 2% HNO3. In addition to the
10 calibrator solutions and the HIPB-1 sample, an additional lead sample (designated as ELED) was employed to monitor the drift in isotope ratios during the measurement sequence. This material was prepared by mixing appropriate amounts of materials A−D to result in an equal atom isotopic composition of all four lead isotopes to within a few percent. Each set of test solutions was analyzed by MC-ICPMS in the following sequence: blank-ELED-A-B-C-D-blank-HIPB-1-ELED-AB-AC-AD-blank-BC-BD-CD-ELED. A single meas-urement sequence takes 90 min using the Faraday cup
Analytical Chemistry Article
DOI:10.1021/acs.analchem.9b00020
Anal. Chem. 2019, 91, 4164−4171
configuration shown in Table S1, at the optimum rf power
(P0). This measurement sequence was repeated 5−10 times
for each set of solutions. Since enriched spikes were
measured, a 1.5 min wash with 10% HNO3 and 2% HNO3,
separately, between each solution was conducted to efficiently reduce the lead signals to the blank levels. Intensities of lead
isotopes obtained from a blank solution of 2% HNO3 were
subtracted from all analytical signals from all samples. Since this method involves a sequential measurement of 10 solutions of four lead materials (A−D) and six mixtures (AB, AC, AD, BC, BD, and CD), efforts were made to match both the mass fraction of lead and the sample matrix (nitric acid levels) across these samples. To ensure stable signals, the instrument was conditioned for at least 1 h prior to each measurement sequence. An isotopic fractionation drift monitoring solution (ELED) was repeatedly measured. In all cases, the observed drift in the isotope ratios was insignificant and the measured ratios were therefore not subjected to any drift corrections.
2.4. Sample Preparation and Analysis for Lead Isotope Ratios Using a Regression Model (RM) for
Isotopic Fractionation Correction by MC-ICPMS. For
the determination of lead isotope amount ratios in HIPB-1,
replicate solutions of Pbmixwith w(Pb) = 1.00 mg kg−1 were
prepared by diluting the stock solution in 2% HNO3followed
by spiking with the stock solution of thallium (NIST SRM
997), yielding the mass fraction w(Tl) = 0.50 mg kg−1. A
self-aspiration mode was used for sample introduction. A static run was employed for simultaneous collection of isotopes of
202Hg, 203Tl, 204Pb, 205Tl, 206Pb, 207Pb, and 208Pb using the
Faraday cup configuration as shown in Table S1. Similar to
the settings for the measurements of iridium26and osmium27
in our previous studies, the plasma radio frequency (rf)
power was gradually increased from the optimum value P0
(corresponding to the highest sensitivity, typically at 1275
W) to Pmax, wherein the lead isotope signal decreased by
approximately 25%, in comparison to its value at P0. The
isotopic composition of each sample was determined five
times with incrementally increasing rf power with values of P0
+ N(Pmax− P0)/4, where N = 0−4. This procedure takes 15
min and provides five sets of Pb and Tl isotope ratios. The measurement duration at each rf power setting was kept identical, and the signals of all monitored isotopes were
blank-corrected using the signals from 2% HNO3 blank at rf
power P0.
2.5. Sample Preparation and Analysis for
Homoge-neity of Lead Isotope Ratios in HIPB-1. To assess the
homogeneity of lead isotope amount ratios in HIPB-1, 16
solutions (Pb1−Pb15 and Pbmix) at w(Pb) = 1.00 mg kg−1
were prepared by diluting their respective stocks in 2%
HNO3 followed by spiking with the stock solution of the
thallium isotopic standard, yielding a mass fraction of 0.50
mg kg−1for thallium. Relative isotope ratios (isotope deltas)
of the 15 lead standard solutions (Pb1−Pb15) were measured
against the Pbmix using the combined standard-sample
bracketing and (thallium) internal standard isotopic
fractio-nation correction model22,30by MC-ICPMS at the optimum
rf power P0.
Although relative isotope ratio measurements do not necessarily have to be corrected for mass bias, better precision can be obtained with the use of an internal standard (thallium). Isotope deltas of lead in the 15 standard
solutions (Pb1−Pb15) relative to the Pbmix solution were
obtained as exemplified below for the lead isotope ratio 208/ 206: δ = − ‐ i k jjjjj y{zzzzz r R m m ( Pb,Pb ) ( Pb,Pb ) ( Pb,Pb ) 1 f HIPB 1208/206 1 208/206 1 208/206 mix 208 206 (1) Here, the exponent f accounts for the thallium internal
standard and is obtained as follows:22
=
(
)
+(
)
f m m m m ln ln( / ) ln ln( / ) r r R r ( Tl,Pb ) ( Tl,Pb ) 205 203 ( Pb,Pb ) ( Pb,Pb ) 208 206 205/203 mix 205/203 1 208/206 mix 208/206 mix (2)In the above equations, R(208/206Pb,Pb
mix) is the “true”
isotope ratio value assigned to Pbmix (HIPB-1) using two
mass bias correction models, the full gravimetric model and the regression model.
2.6. Spectral Interferences. A potential spectral
interference on lead isotopes is 204Hg, which cannot be
eliminated even in high mass resolution mode. Analysis of
lead sample solutions (1 mg kg−1) revealed that the mass
fractions of Hg were less than 10 ng kg−1, insignificant in
causing isobaric interferences since the mass fraction of lead in the analyzed samples is several orders of magnitude higher.
Therefore, no correction of Hg contribution on 204Pb is
needed.
3. RESULTS AND DISCUSSION
3.1. Chemical Purity of Lead Isotopes. Crucial to the
calibrated isotope ratio measurements is the chemical purity of the near-pure isotopes used. Efforts were made to use high-purity specimens of metallic lead isotopes which were produced in a similar fashion. Given that we had the largest amounts of metallic lead-206 (material B) at our disposal
(800 mg), its purity was determined by GDMS at NRC.28,29
This is a simple and direct method able to provide SI traceable purities of high-purity metals. A purity value of
w(Pb,B) = 0.99995(5) kg kg−1(u
c, k = 1) was obtained for
material B, which is comparable to the value provided by the Oak Ridge National Laboratory (estimated as 0.99993 kg
kg−1). Calcium, sodium, and oxygen were found to constitute
the majority of impurities (see Table S3).
Unfortunately, the other lead isotope materials (A, C, and D) were only available to us in a form of a brittle metal foil and thus were not amenable to GDMS analysis. Therefore,
solutions of 200 mg kg−1 of A−D were prepared separately
from their stocks and measured (using a bracketing sequence B-A-B-C-B-D-B) by HR-ICPMS Element XR for 68 impurity
elements (Table S3) to establish the relative intensities of
impurity elements in A, C, and D relative to B. Carbon, nitrogen, and oxygen contents in materials A, C, and D were assumed to be the same as in B. This, in turn, provides mass fractions of impurity elements in materials A, C, and D on the basis of the values in material B as obtained by GDMS. The following mass fractions of lead were obtained: w(Pb,A)
= 0.99943 kg kg−1, w(Pb,C) = 0.99954 kg kg−1, and w(Pb,D)
= 0.99985 kg kg−1. Given that the purity estimates of
materials A, C, and D are all traceable to B, we treated them as highly correlated results.
3.2. FGIM Isotopic Fractionation Correction Model.
As detailed elsewhere,22,31 for an element with N stable
isotopes, the FGIM primary method requires, at minimum, measurements of all N − 1 isotope amount ratios in all N
pure materials and in N − 1 independent gravimetric mixtures of any two enriched materials. Lead has four stable isotopes, which lead to three isotope ratios. In order to calibrate these three isotope ratios, three correction factors (K204/206, K207/206, K208/206) are needed which require
measurements of at least three independent mixtures of any two of four pure materials. Following the successful application of gravimetric isotope mixture calibration on a
three-isotope system,32−37 we implemented a robust
exper-imental design for lead on the basis of six independent binary
mixtures each at 1:1 isotope ratio as shown inFigure 1. This
redundancy in calibration protocol allows for enhanced confidence in the resultant isotopic fractionation calibration factors.
The mathematical complexity of the full gravimetric isotope mixture model increases rapidly with the number of
isotopes.22,32−37 Consequently, analytical solutions for lead
isotope ratio correction factors (K204/206, K207/206, and
K208/206) are extensive, as exemplified below for the K204/206
calculation based on isotope ratio measurements of A, B, C, D, AB, AD, and CD.
The FGIM is based on comparing the observed isotope ratio of a certain isotope mixture with the corresponding expected isotope ratio on the basis of the amount balance. As an example, consider a gravimetric mixture of materials A and B, for which we measure the isotope ratio 204/206. The expected isotope ratio in this mixture is given from the isotopic composition of lead in materials A and B as well as
the masses of these materials (mA(AB) or mB(AB)) used to
prepare the blend AB:
= + + R x m M x m M x m M x m M / / / / 204/206,AB
204,A A(AB) A 204,B B(AB) B
206,A A(AB) A 206,B B(AB) B (3) The isotopic abundances (x) and molar masses (M) in this equation can be fully rewritten in terms of the measured
isotope ratios (r), which are related to the actual isotope ratios (R) as R = Kr where K represents the isotope ratio correction factors: = + + r r r m P m P m P m P 204/206,AB 204/206,A 204/206,B A(AB) 206,A B(AB) 206,B A(AB) 206,A B(AB) 206,B (4) where P206,B= ∑im Ki i/206 /206,Bri (i = 204, 206, 207, 208)
and mi are the nuclide masses of lead isotopes. Together,eq
4 forms a measurement model equation linking the various
input quantities (masses of components A and B and measured isotope ratios in materials A, B, and AB, as well as the lead nuclide masses) with three unknown output
quantities (K204/206, K207/206, and K208/206). In order to obtain
the values for these three isotope ratio correction factors, it is necessary to have three such equations. We have employed a total of six binary mixtures from the four isotopic lead materials (AB, AC, AD, BC, BD, and CD), and we utilized only the single major isotope ratio from each of these mixtures. For example, mixture AB contains mostly lead-204 and lead-206 and therefore the isotope ratio 204/206 was measured for this mixture. Likewise, mixture CD contains mostly lead-207 and lead-208 and therefore only the isotope ratio 207/208 was used from this mixture. All other minor isotope ratios from these lead mixtures were not used in calculations. To further improve the quality of the results, all binary mixtures were made to result in a 1:1 isotope ratio. Together, one set of isotope ratios from these 6 binary mixtures provides 20 different groupings of three equations which can be used to obtain the isotope ratio correction
factors. Analytical solutions for K204/206, K207/206, and K208/206
are prohibitively complex. As an example, the equations below applicable for set AB-AC-BD need to be solved for K204/206, K207/206, and K208/206: + + = · m r P m r P m P m P r eq AB
A(AB) 204/206,A 206,B B(AB) 204/206,B 206,A
A(AB) 206,B B(AB) 206,A 204/206,AB
(5a) + + = m r P m r P m P m P r eq AC
A(AC) 204/207,A 207,C C(AC) 204/207,C 207,A A(AC) 207,C C(AC) 207,A
204/207,AC (5b) + + = m r P m r P m P m P r eq BD B(BD) 206/208,B 208,D D(BD) 206/208,D 208,B B(BD) 208,D D(BD) 208,B 206/208,BD (5c) Given the complexity of the analytical solutions, one can also adopt numerical techniques to solve the systems of
equations.22 This can be done using either nonlinear
minimization of the residuals using a Newton-type algorithm or a naive iterative approach whereby one assumes a certain
initial values of the sought-after correction factors, K204/206,
K207/206, and K208/206, and then solves the relevant system of
equations for K204/206, K207/206, and K208/206. The new values
of the K factors are updated, and the process is repeated until all the correction factors converge.
Figure 1.Framework of lead isotope ratio calibration protocol using a full gravimetric isotope mixture of pure isotopes. Lead isotope ratios were measured in 10 solutions: A, B, C, D, AB, AC, AD, BC, BD, and CD. Only major 1:1 isotope ratios were utilized from the mixtures AB, AC, AD, BC, BD, and CD.
Analytical Chemistry Article
DOI:10.1021/acs.analchem.9b00020
Anal. Chem. 2019, 91, 4164−4171
3.3. Isotope Amount Ratio Correction Factors. Isotopic composition measurements of the 10 materialsA, B, C, D, AB, AC, AD, BC, BC, and CDalong with the masses of these materials used to prepare all 6 binary
mixtures provide 20 sets of K204/206, K207/206, and K208/206.
From these 20 sets, four are discarded because they do not utilize all four lead materials. These sets are BC-BD-CD (excludes the material A), AC-AD-CD (excludes the material B), AB-AD-BD (excludes the material C), and AB-AC-BC (excludes the material D). A typical set of results is
summarized in Figure 2.
The consistency among the correction factors obtained from the 16 sets of mixtures is on the order of one part per thousand. However, it is interesting to recognize an additional hierarchy within the remaining 16 combinations.
We note that the best estimates of K204/206will be produced
from sets involving the mixture AB. There are eight such sets: AB-AC-AD, AB-AC-BD, AB-AC-CD, BC, AB-AD-CD, AB-BC-BD, AB-BC-AB-AD-CD, and AB-BD-CD. Likewise, the
best estimates of K207/206will be produced from sets involving
the mixture BC, and the best estimates of K208/206 will be
produced from sets involving the mixture BD. We call these sets well-tempered. Indeed, uncertainty analysis confirms that
improvements in the precision of K204/206, K207/206, and
K208/206 are achieved if only well-tempered mixtures are
selected. Therefore, eight combinations of mixtures for each Ki/206 were selected for the final calculations of K204/206,
K207/206, and K208/206.
3.4. Measurement Results of Lead Isotope Ratios Using FGIM Isotopic Fractionation Correction Model. To the best of our knowledge, this is the first application of the full gravimetric isotope mixture isotopic fractionation correction model for lead isotope ratio measurements by MC-ICPMS. In 1994, Henrion introduced the concept of matching isotope ratios to 1:1 to reduce potential errors in
isotope dilution results.38 Similar effects have also been
shown to more complex higher-order isotope dilution
models.39 These observations, when they are led to their
logical conclusion, would suggest that the FGIM model too might exhibit more robust performance when 1:1 isotope amount ratio matching is employed. Although all our measurement sets involve matched isotope ratios, we have performed an additional experiment where isotope ratios in the six mixtures deviate significantly from 1:1. As shown in Table 1, results obtained from the nonmatched set (set F)
appear significantly different from the matched sets (sets A− E). Further studies will have to be conducted to better understand the full effect of this observation, as our results hint at the limitations of isotope ratio calibration using the full gravimetric isotope mixture model.
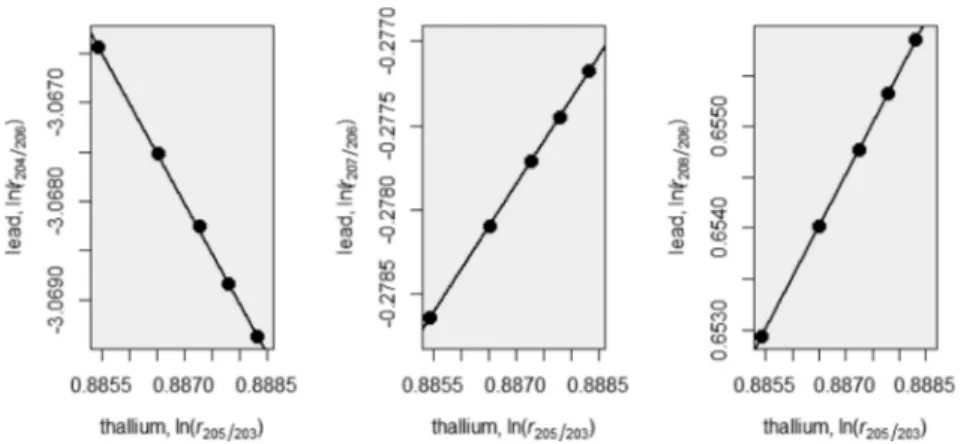
3.5. Measurement Results of Lead Isotope Ratios
Using Regression Model. In addition to the full
gravimetric isotope mixture method, we have also employed
the regression model,25−27 which provides calibrated lead
isotope ratio measurements in HIPB-1 using eqs 6 and 7:
= + r a b r ln(iPb/206) i iln(205/203Tl ) (6) = RiPb/206 (R205/203Tl )b aiei (7)
Here, coefficients ai and bi are the intercepts and slopes of
the corresponding linear regressions which are obtained using the ordinary least-squares fitting of the data. Note that the regression model provides values for all lead isotope ratios separately. As such, there is no need to involve mathematical
models22 which relate the isotope ratio correction factors
Figure 2. Calculated lead isotope ratio correction factors from a typical measurement set (D.3). Black circles represent the well-tempered combinations of mixtures involving AB (for K204/206), BC
(for K207/206), and BD (for K208/206). Open circles represent all other
possible combinations of mixtures as listed on the x axis. Omitted from this plot are the four sets of mixtures BC-BD-CD, AC-AD-CD, AB-AD-BD, and AB-AC-BC which utilize only three of the four lead isotopes.
Table 1. Effect of Matching Isotope Ratios in the Mixtures on Lead Isotope Ratios
set matching ratio in mixtures useda R
208/206 A AB (0.99), AC (1.15), AD (1.05), BC (0.89), BD (0.99), CD (0.88) 1.8917(8) b B AB (0.99), AC (1.02), AD (1.02), BC (0.97), BD (0.97), CD (0.98) 1.8929(8) C AB (0.99), AC (1.02), AD (1.00), BC (1.01), BD (1.00), CD (1.00) 1.8919(8) D AB (0.99), AC (1.02), AD (1.00), BC (1.00), BD (1.01), CD (1.02) 1.8922(8) E AB (1.01), AC (1.00), AD (1.00), BC (1.00), BD (1.01), CD (1.02) 1.8924(8) F AB (1.25), AC (0.64), AD (1.83), BC (1.22), BD (1.61), CD (0.66) 1.8956(10)
aValues in parentheses are the main isotope ratios in each mixture.
For example, CD (0.88) means that the isotope ratio R207/208 in
mixture CD is 0.88.bValues in parentheses are standard uncertainties
(such as the Russell law40). Introduced only two decades ago, the regression model for isotope ratio measurements has proven reliable and already has been used to assign standard
atomic weights of four elements (Ge, Hg, In, and Ir).41
Lead isotope ratio measurements in HIPB-1 were performed with replicate solutions containing w(Pb) = 1.00
mg kg−1and w(Tl) = 0.50 mg kg−1during a 3 month period
from December 2017 to February of 2018. During this period, five different sets of ICP cones were used and a total of 164 sets of lead−thallium isotope ratio regressions were
obtained, all with high coefficients of determination (R2 >
0.9995). The results are summarized in Figure 3and Figure
1S.
3.6. Homogeneity of Lead Isotope Ratios in NRC
HIPB-1. The results shown in Figure 4 indicate that the
HIPB-1 material is homogeneous for lead isotope ratios to within 20 ppm (207/206 and 208/206) and to within 40 ppm (204/206). Such a level of inhomogeneity is approximately 1 order of magnitude below the combined measurement uncertainty of the regression method, and therefore we can conclude that the material is homogeneous within the stated measurement uncertainties.
3.7. Uncertainty Evaluation.Uncertainty estimations for
the calibrated lead isotope ratios were done in accordance with the JCGM 100:2008 “Guide to the Expression of
Uncertainty in Measurement”42 and its Supplement 1.43
For the full gravimetric isotope mixture model, the uncertainty of lead isotope ratios was estimated using the Monte Carlo method. In short, a data generation model was set up to reflect the hierarchy and correlations inherent to the data set and then parametric bootstrap resampling was performed on input quantities in accordance with the available information regarding their uncertainty. This process
was repeated 104times, and the resulting simulation provides
us with the lead isotope ratios (see Figure S2) and their
uncertainties and covariances.
For the regression model, an ordinary least-squares fit was applied to each regression set and the corresponding intercept and slope and their uncertainties were obtained. From these values, lead isotope ratios were calculated using
eq 7. The values for the three input variables in the
measurement model (eqs 7; R205/203Tl , ai, and bi) were modeled
as random numbers drawn from the probability distributions representing the available knowledge about them. In
particular, R205/203Tl was modeled as a normal distribution
with the mean value and its uncertainty coinciding with the
values certified by the NIST, whereas ai and bi for each
measurement set is modeled jointly as a bivariate normal distribution with the mean estimates and covariance matrix derived from the ordinary least-squares fitting of the data (parametric bootstrap resampling). This procedure was
repeated 104 times, and the best estimate of the calibrated
Figure 3.Typical regression plots of NRC HIPB-1 lead against NIST SRM 997 thallium using MC-ICPMS.
Figure 4.Relative isotope ratio differences (isotope deltas) of HIPB-1 samples Pb1−Pb15against their mixed blend (Pbmix) using the combined
standard-sample bracketing and internal normalization (with thallium) isotopic fractionation correction model. Isotope deltas are expressed as relative deviations from the Pbmixin parts per million.
Analytical Chemistry Article
DOI:10.1021/acs.analchem.9b00020
Anal. Chem. 2019, 91, 4164−4171
lead isotope ratios and their uncertainties was obtained from the resulting histograms. Typical uncertainty budgets for lead isotope ratios in HIPB-1 using both calibration methods are
given inTable S4. We note that the full gravimetric mixture
method can be readily improved with the use of better balances or larger amounts of starting materials. Alternatively, one could rely on titrimetry, as the NIST did for the
measurements of SRM 981 reference material in the 1960s,23
but the uncertainty of titrimetric results at such a level of
precision remains contested.44
The uncertainty of isotopic abundances and the atomic weight of lead were propagated from the corresponding isotope ratios, while the covariances were taken into
account.45 Uncertainty propagation of the isotope ratios
into the corresponding isotopic abundances and atomic
weight were done using the R package CIAAWconsensus.46
The atomic masses of lead isotopes used for calculations in
this report are from the 2016 Atomic Mass Evaluation,47
where m208 = 207.9766512(12) Da, m207 = 206.9758967(12)
Da, m2 0 6 = 205.9744651(12) Da, and m2 0 4 =
203.9730434(12) Da with standard uncertainties quoted in parentheses.
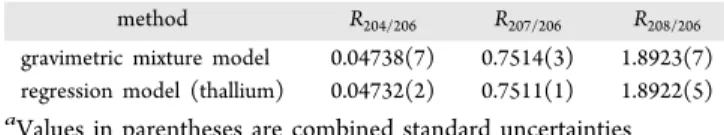
3.8. Comparison of the Results from Both
Calibra-tion Strategies. To the best of our knowledge, this is the
first cross-validation of the regression method with the full
gravimetric isotope mixture analysis. The results of lead isotope ratios in NRC HIPB-1 common lead are shown in Table 2.
Owing to the good agreement between the two methods and the lower uncertainties of the regression method, we have chosen to adopt the results of the regression model for HIPB-1. The corresponding atomic weight of lead in HIPB-1
is Ar(Pb) = 207.1791(1)k=1, and all derived isotope ratios and
isotopic abundances of lead are summarized in Table 3.
The isotopic composition of NRC HIPB-1 is markedly different from that of NIST SRM 981 (with certified values
of 0.059042(19)k=1, 0.91464(17)k=1, and 2.1681(4)k=1 for
R204/206, R207/206, R208/206, respectively), thus providing an
alternative lead reference material. As an example, the isotopic abundance of lead-207 is ca. 10% lower in HIPB-1 in comparison to SRM 981, whereas the abundance of lead-206 is ca. 10% higher. As another comparison, we were able to assign values to lead isotope ratios in NRC HIPB-1
common lead with a slightly better precision in comparison to NIST SRM 981, with the exception of the 208/206 ratio, whose relative uncertainty in our material equals that of SRM 981. In addition, the full gravimetric isotope mixture model used in NRC HIPB-1 was based on all four near-pure lead materials to derive three isotope ratio calibration factors. As noted earlier, the original measurements of NIST SRM 981 were based on a gravimetric mixture of only two near-pure
isotopes (206Pb and 208Pb) to derive the isotope ratio
calibration factor K208/20623, and the other two calibration
factors were obtained from the linear mass-dependent model:
i.e., K207/206 = 1/2K208/206and K204/206= 1/K208/206. Although
this simplified two-isotope mixing approach does not involve
all enriched materials,22 it relies on the mass-dependent
fractionation model to calibrate other isotope pairs. In turn, such an approach rests on the validity of the mass-dependent fractionation models. Overall, our work highlights the strengths of the optimized regression model and should instill additional confidence in this secondary isotope ratio calibration method.
■
CONCLUSIONSIn this work, we have performed the first independent lead isotope ratio measurements since the pioneering work conducted at the NIST in the 1960s. This provides an additional independently certified isotopic reference material of lead in support of various applications in earth sciences. The optimized regression model offers a cost-effective alternative to the primary method of the full gravimetric isotope mixture model. We have successfully applied the full gravimetric isotope mixture method to lead isotope measure-ments for the first time and suggest that this method be employed only with carefully selected pairs of mixtures which are all designed to produce 1:1 isotope ratios. Good
agreement within a few parts in 104 was demonstrated
between these two independent calibration methods, and the results were applied to characterize the NRC common lead HIPB-1 reference material, available in the form of 1 g pins of metallic lead.
■
ASSOCIATED CONTENT*
S Supporting InformationThe Supporting Information is available free of charge on the
ACS Publications website at DOI:
10.1021/acs.anal-chem.9b00020.
Materials and reagents, sample preparation and purity determination of lead-206 material by GDMS, MC-ICPMS operating conditions, sample preparation using the FGIM isotopic fractionation correction model, impurities measured in enriched Pb materials, repre-sentative uncertainty budget for 208/206 lead isotope ratio measurements in NRC HIPB-1 common lead Table 2. Results of Lead Isotope Ratios in NRC HIPB-1
Common Lead Standarda
method R204/206 R207/206 R208/206
gravimetric mixture model 0.04738(7) 0.7514(3) 1.8923(7) regression model (thallium) 0.04732(2) 0.7511(1) 1.8922(5)
a
Values in parentheses are combined standard uncertainties
Table 3. Isotopic Composition of Lead in NRC HIPB-1 Common Lead Standarda
quantity i = 204 i = 206 i = 207 i = 208
isotope ratio, Ri/204 1 21.133(7) 15.873(7) 39.99(2)
isotope ratio, Ri/206 0.047319(15) 1 0.75107(11) 1.8922(5)
isotope ratio, Ri/207 0.06300(3) 1.3314(2) 1 2.5193(4)
isotope ratio, Ri/208 0.02501(13) 0.52849(14) 0.39694(6) 1
isotopic abundance, xi 0.012822(6) 0.27096(4) 0.203511(13) 0.51271(5)
standard, isotope ratio measurements in NRC HIPB-1 common lead standard using regression method against NIST SRM 997 thallium, and isotope ratio measure-ments in NRC HIPB-1 common lead using the full
gravimetric mixture method (PDF)
■
AUTHOR INFORMATIONCorresponding Author
*E-mail for L.Y.:lu.yang@nrc-cnrc.gc.ca.
ORCID
Zoltán Mester: 0000-0002-2377-2615 Lu Yang: 0000-0002-6896-8603
Notes
The authors declare no competing financial interest.
■
ACKNOWLEDGMENTSFinancial support from the China Scholarship Council and National Natural Science Foundation of China (Nos. 41473007, 41673013, and 41273005) for S.T. during the study are gratefully acknowledged.
■
REFERENCES(1) Richards, T. W. J. Am. Chem. Soc. 1914, 36, 1329−1344. (2) Nier, A. O. Phys. Rev. 1939, 55, 153−163.
(3) Grünewald, H. Angew. Chem., Int. Ed. Engl. 1968, 7, 84−84. (4) Muench, O. B. Geol. Soc. Am. Bull. 1950, 61, 129−132. (5) Kanasewich, E. R. Geophys. J. Int. 1962, 7, 158−168. (6) Cooper, J. A.; Green, D. H. Earth Planet. Sci. Lett. 1969, 6, 69−76.
(7) Gariépy, C.; Allègre, C. J.; Rong Hua, X. Earth Planet. Sci. Lett. 1985, 74, 220−234.
(8) Blichert-Toft, J.; Weis, D.; Maerschalk, C.; Agranier, A.; Albarède, F. Geochem., Geophys., Geosyst. 2003, 4, 1−27.
(9) Nielsen, S. G.; Rehkämper, M.; Halliday, A. N. Geochim. Cosmochim. Acta 2006, 70, 2643−2657.
(10) Simon, J. I.; Reid, M. R.; Young, E. D. Geochim. Cosmochim. Acta 2007, 71, 2014−2035.
(11) De Muynck, D.; Cloquet, C.; Smits, E.; de Wolff, F. A.; Quitte, G.; Moens, L.; Vanhaecke, F. Anal. Bioanal. Chem. 2008, 390, 477−486.
(12) Gao, B.; Liu, Y.; Sun, K.; Liang, X.; Peng, P.; Sheng, G.; Fu, J. Anal. Chim. Acta 2008, 612, 114−120.
(13) Hanano, D.; Scoates, J. S.; Weis, D. Am. Mineral. 2009, 94, 17−26.
(14) Nobre Silva, I. G.; Weis, D.; Barling, J.; Scoates, J. S. Geochem., Geophys., Geosyst. 2009, 10, 1−23.
(15) Qiu, Z.; Wu, F.; Yang, S.; Zhu, M.; Sun, J.; Yang, P. Chin. Sci. Bull. 2009, 54, 658−668.
(16) Bouvier, A.; Wadhwa, M. Nat. Geosci. 2010, 3, 637−641. (17) Shiel, A. E.; Weis, D.; Orians, K. J. Sci. Total Environ. 2010, 408, 2357−68.
(18) Takagi, M.; Yoshinaga, J.; Tanaka, A.; Seyama, H. Anal. Sci. 2011, 27, 29−35.
(19) Zurbrick, C. M.; Gallon, C.; Flegal, A. R. Anal. Chim. Acta 2013, 800, 29−35.
(20) Pierce, A. M.; Gustin, M. S.; Christensen, J. N.; Loría-Salazar, S. M. Sci. Total Environ. 2018, 615, 1411−1427.
(21) Smith, K. E.; Shafer, M. M.; Weiss, D.; Anderson, H. A.; Gorski, P. R. Biol. Trace Elem. Res. 2017, 177, 33−42.
(22) Yang, L.; Tong, S.; Zhou, L.; Hu, Z.; Mester, z.; Meija, J. J. Anal. At. Spectrom. 2018, 33, 1849−1861.
(23) Catanzaro, E. J.; Murphy, T. J.; Shields, W. R.; Garner, E. L. J. Res. Natl. Bur. Stand., Sect. A 1968, 72A, 261−267.
(24) Taylor, R. N.; Ishizuka, O.; Michalik, A.; Milton, J. A.; Croudace, I. W. J. Anal. At. Spectrom. 2015, 30, 198−213.
(25) Malinovsky, D.; Dunn, P. J. H.; Goenaga-Infante, H. J. Anal. At. Spectrom. 2016, 31, 1978−1988.
(26) Zhu, Z.; Meija, J.; Zheng, A.; Mester, Z.; Yang, L. Anal. Chem. 2017, 89, 9375−9382.
(27) Zhu, Z.; Meija, J.; Tong, S.; Zheng, A.; Zhou, L.; Yang, L. Anal. Chem. 2018, 90, 9281−9288.
(28) Meija, J.; Methven, B.; Sturgeon, R. E. Metrologia 2017, 54, 796−804.
(29) Sturgeon, R. E.; Methven, B.; Willie, S. N.; Grinberg, P. Metrologia 2014, 51, 410−422.
(30) Hou, Q. H.; Zhou, L.; Gao, S.; Zhang, T.; Feng, L.; Yang, L. J. Anal. At. Spectrom. 2016, 31, 280−287.
(31) Meija, J. Anal. Bioanal. Chem. 2012, 403, 2071−2076. (32) Rienitz, O.; Pramann, A.; Schiel, D. Int. J. Mass Spectrom. 2010, 289, 47−53.
(33) Pramann, A.; Rienitz, O.; Schiel, D. Int. J. Mass Spectrom. 2011, 305, 58−68.
(34) Pramann, A.; Rienitz, O.; Schiel, D.; Güttler, B.; Valkiers, S. Int. J. Mass Spectrom. 2011, 299, 78−86.
(35) Yang, L.; Mester, Z.; Sturgeon, R. E.; Meija, J. Anal. Chem. 2012, 84, 2321−7.
(36) Vocke, R. D.; Rabb, S. A.; Turk, G. C. Metrologia 2014, 51, 361−375.
(37) Ren, T.; Wang, J.; Zhou, T.; Lu, H.; Zhou, Y. J. J. Anal. At. Spectrom. 2015, 30, 2449−2458.
(38) Henrion, A. Fresenius' J. Anal. Chem. 1994, 350, 657−658. (39) Pagliano, E.; Mester, Z.; Meija, J. Anal. Bioanal. Chem. 2013, 405, 2879−2887.
(40) Russell, W. A.; Papanastassiou, D. A.; Tombrello, T. A. Geochim. Cosmochim. Acta 1978, 42, 1075−1090.
(41) Meija, J.; Coplen, T. B.; Berglund, M.; Brand, W. A.; Bièvre, P. D.; Gröning, M.; Holden, N. E.; Irrgeher, J.; Loss, R. D.; Walczyk, T.; Prohaska, T. Pure Appl. Chem. 2016, 88, 265−291.
(42) Evaluation of Measurement DataGuide to the Expression of Uncertainty in Measurement; JCGM 100:2008; JCGM: Paris, France, 2008.
(43) Supplement 1 to the “Guide to the expression of uncertainty in measurement” − Propagation of distributions using a Monte Carlo method; JCGM 101:2008; JCGM: Paris, France, 2008.
(44) Meija, J.; Michałowska-Kaczmarczyk, A. M.; Michałowski, T. Anal. Bioanal. Chem. 2016, 408, 4469−4471.
(45) Meija, J.; Mester, Z. Metrologia 2008, 45, 53−62. (46) Meija, J.; Possolo, A. Metrologia 2017, 54, 229−238. (47) Wang, M.; Audi, G.; Kondev, F. G.; Huang, W. J.; Naimi, S.; Xu, X. Chin. Phys. C 2017, 41, 030003.
Analytical Chemistry Article
DOI:10.1021/acs.analchem.9b00020
Anal. Chem. 2019, 91, 4164−4171