Earth Pressure Balance (EPB) Tunneling Induced Settlements in the Tren
Urbano Project, Rio Piedras, Puerto Rico
by
Alejandro J. Abrams
Bachelor of Science in Civil Engineering Polytechnic University of Puerto Rico, 2006
Submitted to the Department of Civil and Environmental Engineering in Partial Fulfillment of the Requirements for the Degree of
MASTER OF ENGINEERING in Civil and Environmental Engineering
at the
MASSACHUSETTS INSTITUTE OF TECHNOLOGY
June, 2007
@ 2007 Alejandro J. Abrams. All rights reserved. The author hereby grants to MIT permission to reproduce
and to distribute publicly paper and electronic copies of this thesis document in whole or in part
in any medium known or hereafter created. /
7/W
Signature of Author:Department of Civil j•dEnrironmental Engineering May 14, 2007
A /7 N14 Certified by:
Professor Andrew J.T Whittle Department of Civil and Environmental Engineering Thesis Supervisor Accepted by: MASSACHUSETTS INT E OF TECHNOLOGY
JUN 0. 7 2007
LIBRARIES
Professor Dbniele Veneziano Chairman, Departmental Committee for Graduate Students
ARCHIVES
•f
A-Earth Pressure Balance (EPB) Tunneling Induced Settlements in the Tren
Urbano Project, Rio Piedras, Puerto Rico
by
Alejandro J. Abrams
Submitted to the Department of Civil and Environmental Engineering on May 14, 2007 in partial fulfillment of the requirements for the Degree of Master of Engineering in Civil and
Environmental Engineering.
ABSTRACT
Underground construction of the Rio Piedras section of the Tren Urbano project involved the construction of twin tunnels (6.3m diameter) with Earth Pressure Balance machines in weathered alluvial soil. The depth of the cover over the tunnel crown varies from 13m to 10m. The twin tunnels, which connect the Rio Piedras Station and University of Puerto Rico Station, each have a length of 433 meters. Precast concrete linings offered the final structural support. Ground deformations were monitored throughout the construction of both twin tunnels. Volume loss is defined as the volume of ground loss as a proportion of the final tunnel volume and is measured in the plane perpendicular to the tunnel heading. Volume losses corresponding to the process of tunnel construction are identified in this thesis. Settlement troughs both over single and twin tunnels (when symmetric) are often described by a Gaussian curve. However, previous studies have suggested that the settlement trough due to twin tunnels is not symmetric with respect to the midpoint between the two tunnels. The current research shows that the superposition methods proposed by Suwansawat and Einstein (2007) are able to describe the observed settlement trough of the two bored tunnels with volume losses ranging from 0.9 to 1.8% for each bore. These results are up to a factor of 2 larger than volume losses predicted by empirical methods based on overload factors (Macklin, 1999).
Thesis Supervisor: Andrew J. Whittle
ACKNOWLEDGMENTS
I wish to express my gratitude and appreciation to those individuals who helped make this an unforgettable experience:
First of all, I would like to thank my advisor, Professor Andrew J. Whittle for giving me the opportunity of working with him. His guidance and efforts helped me in the culmination of this thesis.
I would also like to thank Dr. John T. Germaine and Professor Herbert H. Einstein for their support in several stages of this work. Their input was very much appreciated.
Special thanks to Gonzalo Corral for his continuous support throughout my entire MIT experience. None of this could have been possible without your help.
I would like to extend my gratitude to the entire MEng group of 2007 for their support throughout the entire year. Through good times and bad, we always found away to make the best of it.
I would also like to acknowledge my family and friends, specially, Andrea, for all her support and encouragement. Thanks for being the joyful thought during the most stressful times.
Finally, to my parents: Jose and Awilda, to whom I dedicate this thesis. You have been the inspiration and motivation throughout my entire life. Thank you for your support in my interest and goals, both in academia and elsewhere. Los quiero mcuho.
TABLE OF CONTENTS
A B ST R A C T ... ... 2
ACKNOWLEDGMENTS ... 3
TABLE OF CONTENTS ... ... 4
LIST OF TABLES ... ... 6
LIST O F FIG U RES ... ... 7
1. INTRODUCTION...9
1.1. OVERVIEW OF TREN URBANO ... 9
1.2. OVERVIEW OF Rio PIEDRAS SECTION ... ... 10
2. EARTH PRESSURE BALANCE (EPB) SHIELD TUNNELING METHOD 2.1. H ISTORY OF SHIELD TUNNELING ... ... 15
2.2. SHIELD M ACHINE TYPES ... ... 15
2.3. EPB SHIELD TUNNELING ... ... 17
2.3.1. 2.3.2. 2.3.3. 2.3.4. BACKGROUND ... 17 EXCAVATION... ... 17
TUNNEL LINING INSTALLATION ... 18
TAIL GROUTING ... ... ... ... 18
3. GROUND DEFORMATION PREDICTION METHODS ... 3.1. INTRODUCTION ... ... 24
3.2. EMPIRICAL METHODS ... 25
3.2.1. PECK (1969) ... 25
3.2.2. O'REILLY AND NEW (1982) ... ... 26
3.2.3. MAIR AND TAYLOR (1997) ... ... 27
3.2.4. M ACKLIN (1999) ... 27
---... O...•i
4. RIO PIEDRAS SECTION ... 36 4.1. GEOLOGICAL BACKGROUND ... 36 4.1.1. B ED RO C K ... 37 4.1.2. Q UARTERNARY D EPOSITS ... 37 4.2. SITE INVESTIGATION ... 37 4.2.1. STRATIGRAPHY ... 37 4.2.2. INDEX PROPERTIES... ... 39 4.2.3. GROUNDWATER TABLE...39
4.2.4. STRENGTH AND DEFORMATION PROPERTIES...40
5. GROUND MOVEMENT DUE TO EPBM ... 48
5.1. CONSTRUCTION SEQUENCE ... ... 48
5.2. INSTRUM ENTATION ... 48
5.3. MEASURED GROUND DEFORMATIONS ... 49
6. SETTLEMENT TROUGH AND GROUND LOSS... ... 61
6.1. SETTLEMENT TROUGH ... 61
6.1.1. SETTLEMENT TROUGH FOR FIRST TUNNEL (BR) ... .... ... 61
6.1.2. SETTLEMENT TROUGH FOR SECOND TUNNEL (BL) ... ... 62
6.1.3. SETTLEMENT TROUGH FOR TWIN TUNNELS ... 62
6.2. GROUND Loss ... 63
6.2.1. GROUND LOSS (MACKLIN, 1999) ... ... 63
6.2.2. GROUND LOSS (PECK, 1969) ... ... 64
1 CONCLUSION REFERENCES ... 72
...
...
m .. mLIST OF TABLES
TABLE 3.1 SUMMARIZED SETTLEMENT TROUGH DATA FOR DIFFERENT SOILS ... 29
TABLE 4.1 EFFECTS OF DRYING ON THE INDEX PROPERTIES OF THE OLD ALLUVIUM ... 41
TABLE 5.1 SUMMARY OF DISPLACEMENTS MEASURED IN SETTLEMENT RODS SR37 TO SR42...51
LIST OF FIGURES
FIGURE 1.1 PHASE I FINAL SYSTEM CONFIGURATION... 12
FIGURE 1.2 PLAN ALIGNMENT AND TUNNELING METHODS FOR SECTION 7 ... 13
FIGURE 1.3 VERTICAL ALIGNMENT OF SECTION 7 SHOWING ENGINEERING INTERPRETATION OF STRATIGRAPHY ... 13
FIGURE 1.4 STACKED DRIFT METHOD (FROM WHITTLE, ET AL, 2003) ... 14
FIGURE 2.1: BRUNEL'S "SCREW" AND "COMPARTMENT" SHIELDS ... ... 20
FIGURE 2.2: THAMES RIVER COMPARTMENT SHIELD... 21
FIGURE 2.3: TYPES OF EARTH PRESSURE BALANCE (EPB) SHIELDS ... ... 21
FIGURE 2.4 LOVAT® MP254SE SERIES 16600... 22
FIGURE 2.5: PRINCIPLE OF EARTH PRESSURE BALANCE MACHINE ... 22
FIGURE 2.6 TYPICAL BOLT CONNECTION FOR SEGMENTAL LINING OF SECTION 7 TUNNELS ... 23
FIGURE 2.7 GROUTING HOLES IN SEGMENTAL LINING OF SECTION 7 TUNNELS (GAY ET AL, 1999) 23 FIGURE 3.1 GROUND LOSS AT THE SHIELD FACE ... ... 30
FIGURE 3.2 GROUND LOSS DUE TO OVER-CUTTING...30
FIGURE 3.3 GROUND LOSS DUE TO PITCHING ... ... ... 31
FIGURE 3.4 GROUND LOSS DUE TO GROUND DISTURBANCE ... ... 31
FIGURE 3.5 GROUND LOSS DUE TO TAIL VOID CLOSING ... ... 31
FIGURE 3.6 NORMAL PROBABILISTIC CURVE USED TO DESCRIBE TRANSVERSE SETTLEMENT T R O U G H ... ... 32
FIGURE 3.7 RELATION BETWEEN SETTLEMENT TROUGH WIDTH PARAMETER AND TUNNEL DEPTH FOR DIFFERENT GROUND CONDITIONS ... ... 32
FIGURE 3.8 SOIL DEFORMATION AROUND TUNNEL ... 33
FIGURE 3.9 RELATION BETWEEN SETTLEMENT TROUGH WIDTH PARAMETER AND TUNNEL DEPTH FOR VARIOUS GROUND CONDITIONS...33
FIGURE 3.10 TYPICAL GEOMETRY FOR A SHIELD DRIVEN TUNNEL IN CLAY ... 34
FIGURE 3.1 ICRITICAL STABILITY RATIO ... 34
FIGURE 4.1 THE GREATER ANTILLES ... 42
FIGURE 4.2 MAP OF PUERTO RICO ... ... 43
FIGURE 4.3 GEOLOGICAL PROFILE OF SECTION 7 ... ... 44
FIGURE 4.4 PLASTICITY INDEX AND SPT N-VALUES FOR OLD ALLUVIUM ... 45
FIGURE 4.5 EFFECTS OF DRYING ON THE PSD OF THE OLD ALLUVIUM...45
FIGURE 4.6 PARTICLE SIZE DISTRIBUTION (PSD) FOR DIFFERENT DRYING CONDITIONS...46
FIGURE 4.7 EFFECTS OF REMOLDING ENERGY AND DRYING ON THE ATTERBERG LIMITS ... 46
FIGURE 4.8 CONSOLIDATION CURVE OF UPPER CLAY ... 47
FIGURE 4.9 CHANGE IN COEFFICIENT OF CONSOLIDATION ON LOAD-UNLOAD CYCLES ... 47
FIGURE 5.2 CONSTRUCTION SEQUENCE FOR THE EPB TUNNELS ... ... 53
FIGURE 5.3 INSTRUMENTATION LAYOUT FOR EPB SECTION ... 54
FIGURE 5.4 CROSS SECTION B-B ... 55
FIGURE 5.5 CROSS SECTION C-C ... 55
FIGURE 5.6 GROUND DISPLACEMETN RECORDED BY SR37... ... 56
FIGURE 5.7 GROUND DISPLACEMENTS RECORDED BY SR38 ... ... 56
FIGURE 5.8 GROUND DISPLACEMENTS RECORDED BY SR39 ... ... 57
FIGURE 5.9 GROUND DISPLACEMENTS RECORDED BY SR40 ... ... 57
FIGURE 5.10 GROUND DISPLACEMENTS RECORDED BY SR41 ... 58
FIGURE 5.11 GROUND DISPLACEMENTS RECORDED BY SR42 ... ... 58
FIGURE 5.12 CONTOURS OF MAXIMUM SURFACE SETTLEMENT RECORDED AFTER CONSTRUCTION OF BAYAMON RIGHT TUNNEL ... 59
FIGURE 5.13 CONTOURS OF MAXIMUM SURFACE SETTLEMENT RECORDED AFTER CONSTRUCTION OF BAYAMON LEFT TUNNEL ... 60
FIGURE 6.1 SURFACE SETTLEMENT TROUGH AFTER BR TUNNEL CONSTRUCTION IN TRANSVERSE SE C T IO N C -C ... ... 66
FIGURE 6.2 SURFACE SETTLEMENT TROUGH AFTER BR TUNNEL CONSTRUCTION IN TRANSVERSE SECTION B-B ... 66
FIGURE 6.3 SURFACE SETTLEMENT TROUGH AFTER BL TUNNEL CONSTRUCTION IN TRANSVERSE SE C T IO N C -C ... 67
FIGURE 6.4 SURFACE SETTLEMENT TROUGH AFTER BL TUNNEL CONSTRUCTION IN TRANSVERSE SECTION B-B ... 67
FIGURE 6.5 SURFACE SETTLEMENT TROUGH FOR TRANSVERSE SECTION C-C WITH SU PERPO SITIO N ED CU RV E ... 68
FIGURE 6.6 SURFACE SETTLEMENT TROUGH FOR TRANSVERSE SECTION B-B WITH SUPERPOSITIONED CURVE .. ... 69
1.
Introduction
Tren Urbano is an urban transit system in the metropolitan area of Puerto Rico. The Phase I of the project, completed on December 17, 2004, consists of a 17 kilometer, double track system with 16 stations that connects the municipalities of Bayamon, Guaynabo and San Juan (Figure 1.1). Although plagued by construction delays and contractual disputes between the government and the contractors, Phase I was officially inaugurated on December 4, 2004. The Rio Piedras Alignment, Section 7, is a 1,500 meter long underground segment which was constructed by various tunneling methods including cut-and-cover excavations, stacked drift method, New Austrian Tunneling Method (NATM) and Earth Pressure Balance (EPB) tunneling machines.
Due to the preservation of historically rich buildings in the town of Rio Piedras, control of ground deformations was the principal factor in the design of the underground sections. To mitigate the potential for settlement damage to adjacent structures, improved methods for tunneling were implemented throughout the project. To minimize the magnitude of the
settlements, EPB machines were used in an extensive part of Section 7 (Figure 1.2).
The principal difficulty in designing for ground movements is the lack of prediction methods that can link the operational control of the EPB machines (e.g., face pressures, rate of advance, etc.), with known soil properties to estimate the magnitude and distribution of the ground deformations. As a result, much simpler empirical methods (refer to Peck, 1969, se renew by Mair and Taylor, 1997) provide the primary basis for estimating ground movements (i.e., data from past projects which correlate ground movements to soil type/properties and tunneling methods).
The objective of this thesis is to assess the magnitudes of ground deformations due to EPM tunneling in Section 7 of the Tren Urbano project, and re-evaluating its performance. Some of this information has been previously documented by Perez (2002).The current work relates the settlements to the ground loss for EPB sections of Tren Urbano in Rio Piedras.
1.1. Overview of Tren Urbano
The Tren Urbano project was constructed to cope with the heavily congested urban roadway networks in and around the vicinity of the city of San Juan, Puerto Rico's capital. With an
approximate cost of 2.25 billion dollars, the Tren Urbano project was the first major underground transit construction project in the United States that implemented the design/build procurement.
Phase I of the Tren Urbano connects the municipality of Bayam6n with Santurce, passing through the municipality of Guaynabo and through the districts of central San Juan known as Rio Piedras and Hato Rey. The Phase I alignment of Tren Urbano is described as follows (Alba-Carb6, 1998), (Figure 1.1):
* From Bayam6n to PR-21 and the De Diego Ave. Interchange (Sta. 182+60), the alignment runs slightly above existing grade through 65th Infantry Expressway
corridor.
* From PR-3 at Rio Piedras (De Diego Station) to PR-3 at Rio Piedras, the alignment is elevated and intersects the highly developed areas of Villa Nevairez, Veteran's Hospital and Centro M6dico.
* From PR-3 at Rio Piedras up to Central Ave. (PR-17), the route descends underground as it proceeds through the downtown area of Rio Piedras.
* From Central Ave. to the end of the track at Sagrado Coraz6n, the route crosses the congested financial district known as "Milla de Oro".
Approximately 40% of the alignment is near or at grade. The remainder of the alignment, with the exception of the underground section through Rio Piedras, is generally elevated above roadway right-of-ways. The following section gives an overview of Section 7.
1.2. Overview of Rio Piedras Section
Section 7 alignment of the Tren Urbano project comprises a total length of 1,500 meters of underground tunnels with two underground station caverns (Rio Piedras and University of Puerto Rico, Figure 1.2). This section connects Villa Nevarez (Section 6) on the south to the Hato Rey (Section 8) on the north. The alignment passes Barriada Venezuela, crosses PR-3 near station 219, and continues underground at Juliin E. Blanco Street through Rio Piedras until Station 231 near Mariana Bracetti Street. Much of the alignment of Section 7 runs beneath and parallel to the Ponce de Le6n Avenue. Section 7 was developed to serve the traditional town center of Rio Piedras and the University of Puerto Rico (UPR). The section also includes tunnel portals for the
future extension of the Tren Urbano system to Carolina Centro (Phase II), which will run due east from Rio Piedras Station parallel to PR-3 (Figure 1.1).
The Rio Piedras Station was constructed beneath buildings and utilities adjacent to the Commercial Center Historic District, along the Ponce de Le6n Avenue. A variety of tunneling methods were adopted to protect the sensitive existing buildings, which consist of old masonry structures. The tunnels and the UPR Station were constructed by the cut-and-cover method, while the rest was done using the following methods (Figure 1.3):
* Earth Pressure Balance Tunneling machines * Stacked drift method (Figurel.5)
* Sequential excavation supported with shotcrete and girders (also known as the New Austrian Tunneling Method (NATM) of construction)
These different types of tunneling methods were implemented to cope with specific design and/or site constraints in which only these types of methods would meet the requirements.
An extensive grouting program was implemented to cope with the owner specified threshold limits for various levels of settlements. Compensation grouting was used as an appropriate building protection method to mitigate settlements caused by excavation of the various tunnels. Compensation grouting was also undertaken as required during the excavation work to compensate for ground loss and limit settlement to an acceptable range. Consolidation grouting was also used in the stack drift construction to control ground movements, achieving only minimal success.
/i ~il S - £-a S~ Si 0
z
C CU I-at C~r Q CU( 12 I. * a :asb i~ ist
i" A•i I Srk
00000 o LO~n * )N 07(I CL ul V 0 US 0 Ur, 09 2 13 C) 8 0u ' 0o4A 0 0 a
0
-0E C >• oY&
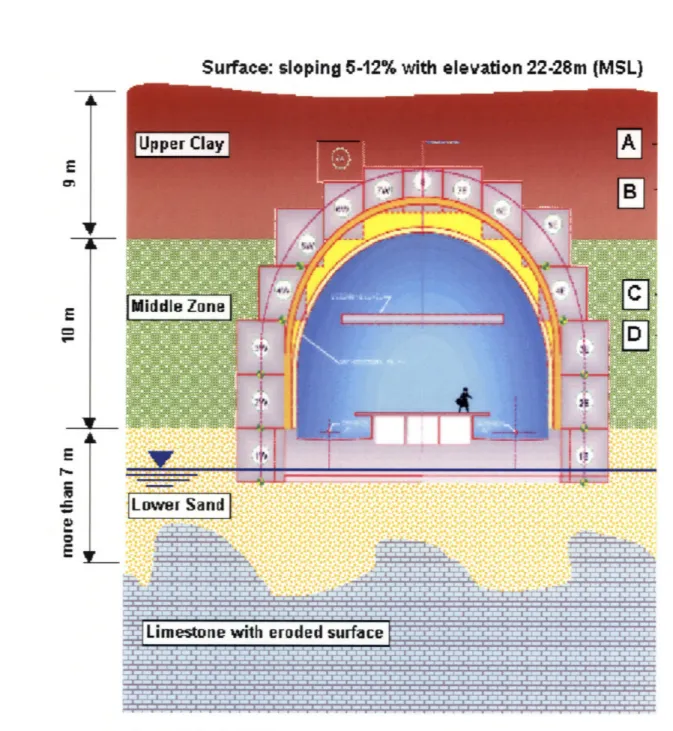
0 I 0 Cu @ @ •0 0 I-i 34 0 Ua *-.50 U 0 2 U 3-a g E8 8Surface:
sloping 5-12% with elevation 22-28m (MSL)
Lower Sand I ý ý T ;-'-rTS;"
'J I ,1i ILimestone with eroded surface r
---- ----
--~-9-·r~~" ~ "~-,i,~QSJ li t' 1? 1 1 I'? ¶1 I
Figure 1.4 Stacked drift method (from Whittle, et al, 2003)
14 r r '2 T-7-1 I L"A I r !
2.
Earth Pressure Balance (EPB) Shield Tunneling Method
2.1. History of Shield Tunneling
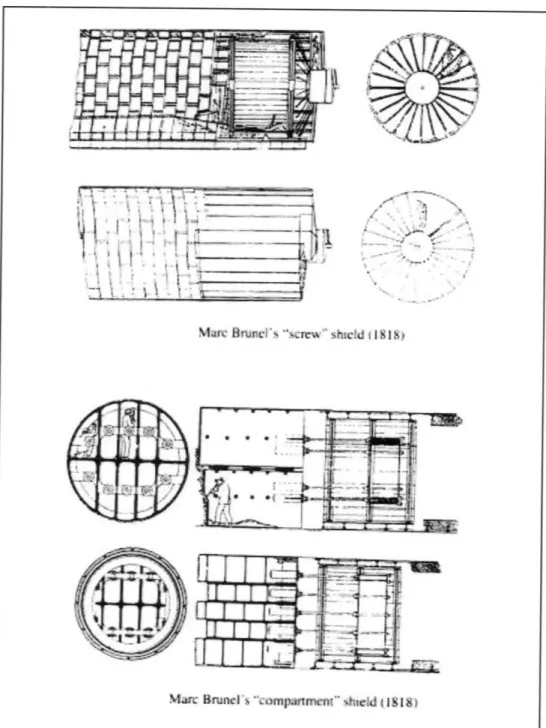
Shield tunneling methods in soft ground were first introduced by Marc Isambard Brunel in England. Brunel introduced two types of circular shields in 1818: the screw shield and the compartment shield (Figure 2.1). The screw shield used hydraulic jacks to push itself forward. It can be considered as the predecessor of the modern Earth Pressure Balance. In the second system shown in the figure, the shield is divided into compartments which are forced forward by jacks while workmen in each separate compartment remove the soil ahead. After completion of the excavation section, the jacks positioned at the rear of the shield react against the newly erected tunnel lining and move the shield forward.
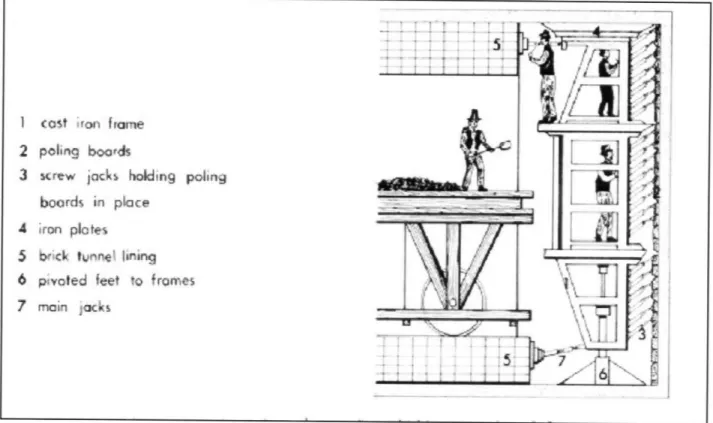
The first tunnel project to adopt Brunel's shield tunneling was the Thames River Tunnel in London in 1825 (Figure 2.2). The shield was made of cast iron with twelve frames which were divided into three sections, an upper, middle and lower section. Each chamber had one worker so that there were 36 workers altogether. The shield functioned according to the following pattern: first, timber plates were pushed ahead into the soil with the help of spindles. The timber plates were subsequently removed, and soil was excavated. The plates were reinstalled and supported by the spindles. The brick liner was built right behind the shield and served as the abutment for the whole frame (Suwansawat, 2002). Construction was completed in 1843 after more than five cases of serious flooding. In 1869, James Greathead excavated a tunnel underneath the Thames River using a circular shield. This was the first project to employ cast iron linings. Greathead's circular shield became the model for all open-faced shields developed thereon. The first mechanical shields were introduced in 1876 by John and George Brunton. The shield had a hemispherical rotating cutter head consisting of several plates. Mechanical shields with a fluid supported face were later introduced.
2.2. Shield Machine Types
The main principle of a shield is based on a cylindrical steel assembly pushed forward along the axis of the tunnel while excavating the soil at the same time. The shield secures the excavated void until the final linings are installed. The shield has to withstand the pressures of the surrounding soil and prevent the migration of ground water. There are different measures used
for stabilizing the tunnel face (Figure 2.3). These methods yield the great advantage of shield tunneling: allowing the soil to be stabilized during the excavation process.
The specific method of soil excavation is an important factor in shield machines. Manual excavation methods are used only in special cases such as for short distances to be driven under specific geological conditions. For example, the stacked drift construction of the Rio Piedras cavern involved 3m by 3m rectangular drifts that were hand excavated over a 150 meter length between two 30 meter shafts (see Figures 1.2 and 1.4). The more typical approach is the use of machines for mechanized open-faced excavations and closed-faced excavation. They are guided by operating personnel or automatically. A variety of closed-faced excavations can be carried out depending on the geology encountered.
Open-faced shields are shields without a system for pressure regulation at the tunnel face. Usually, the open-faced shields can be used in ground conditions with no groundwater or where the groundwater was lowered beforehand. In cases where support of the tunnel face to counteract earth pressure is required, this can be achieved mechanically (Figure 2.3a).
The tunnel face in closed-faced tunneling can be supported by three methods: compressed air, slurry or Earth Pressure Balance (EPB). Compressed air shields (Figure 2.3b) prevent the ingress of groundwater by means of compressed air, thus allowing tunneling below bodies of free water or below the water level. Besides keeping out groundwater, the compressed air shield provides earth pressure support.
The tunnel face in slurry shields (Figure 2.3c) is supported, as the name implies, by pressurized slurry. The support medium of the face in slurry shields is a low friction fluid. It consists of water and an additive (generally Bentonite) that form an impervious layer at the fluid-soil interface. This layer transfers the pressure of the support fluid to the tunnel face.
In Earth Pressure Balance (Figure 2.3d) shields, the material being excavated by the cutting wheel serves as the support medium. The following section discusses EPB machines in more detail.
2.3. EPB Shield Tunneling 2.3.1. Background
Earth Pressure Balance (EPB) shields control the stability of the tunnel face and subsidence of the ground surface by monitoring and adjusting the pressures inside the cutter-head chamber to achieve a balance with the pressure in front of the cutter-head; hence the name Earth Pressure Balance. Work on this concept was originated in the 1960's by the Sato Kogyo Company in Japan. It was developed to comply with the environmental regulations and laws in effect in many of the cities of Japan. These included air and water pollution laws, waste disposal, public cleaning laws, and prevention of oxygen deficiency and prevention of compressed air hazard ordinances, etc. In 1974, the first EPB shield with an outside diameter of 3.72 meters was used for tunnel excavation of 1,900 meters in Tokyo.
In the following years, Earth Pressure Balance shields have been produced by numerous manufacturers under different names such as pressure holding shield, slime shield, soil pressure shield, confined soil shield, mud pressurized shield or muddy soil shield (Suwansawat, 2002). All of these terms apply to the same principal, known as Earth Pressure Balance system.
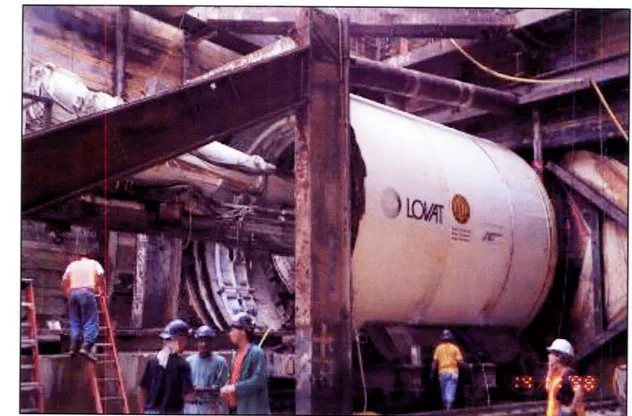
The twin bore guideway tunnels constructed in the Section 7 between the University of Puerto Rico Station and the Rio Piedras Station, span a distance of approximately 433 meters. The tunnel boring machine used to excavate the tunnels was a Lovat MP254SE series 16600 (Figure 2.4), Earth Pressure Balance (EPB) tunnel boring machine to excavate through the 6.3 meter outside diameter twin tunnels.
2.3.2. Excavation
The excavation in EPB shield tunneling is done by the shield cutter face. The excavated soil, or spoil, is taken out through the screw conveyor and belt conveyor from the earth chamber and transported by means of pumping or muck skips pulled by locomotives (Figure 2.5). To minimize ground movement, earth pressure at the face is carefully monitored and controlled as follows:
Target face pressures at each excavation cycle have to be predetermined prior to excavation. They are used as a control parameter during excavation.
* During excavation, the face pressure must be recorded, controlled and maintained at the targeted pressure (face pressures in EPB machines in the Section 7 varied from 200 to
350 kPa).
* For each ring excavation, the face target pressure and the actual face pressure needs to be recorded in the excavation report which will be used later as reference.
The shield operator must closely observe the excavation in order to ensure that the shield is operating under the predetermined pressure. Also, the shield operator must monitor all other operational parameters at all times during excavation.
The excavation and shield advancement are carried out simultaneously. As the cutting face advances through the soil, hydraulic jacks behind the shield extend and push against the tunnel lining to slide the shield ahead. For the Section 7 segment, the jacking against the last lining segment installed advanced the machine by 1.2 meter after the subsequent installation of the next lining. Careful positioning, vertical and horizontal deviations and current alignment are required during shield advancement. These factors should be carefully recorded in each excavation cycle.
2.3.3. Tunnel Lining Installation
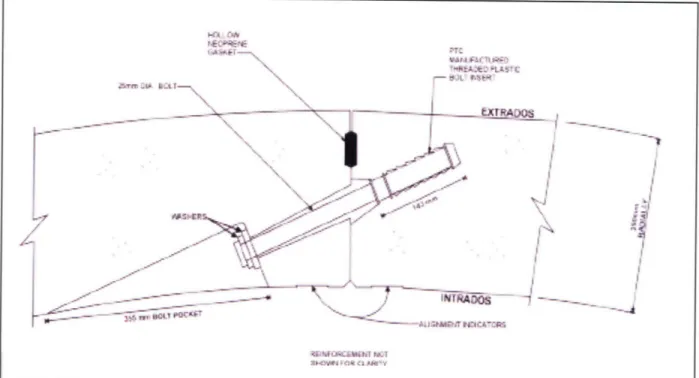
The lining segments are usually erected within the protection of the cylindrical tail shield. They act as a one-pass system that provides both stabilization of the tunnel opening during the excavation, as well as the permanent lining segment. Section 7 used a one-pass precast concrete segmental lining system where individual segments with gasketed joints were bolted to form a watertight lining (Figure 2.6). The lining is a seven piece, 250 mm thick, 1.2 meter wide ring. The circumferential reinforcing is eight #6 reinforcement bars on each face. Each segment was joined using two 25 mm bolts in the circumferential direction and twelve 25 mm bolts in the longitudinal direction. Grouting of the gap behind the segmental lining left by the over-excavation was done immediately behind the shield.
2.3.4. Tail Grouting
The diameter of the shield face is always larger than that of the prefabricated lining. Firstly because the shield skin plate must overlap the lining to permit correct assembly, and secondly because there must be clearance between the outside of the lining and the tail to allow steering of the shield around curves and to correct misalignment. As a result, a tail void is left around the
perimeter of the lining as the shield is jacked forward. This tail void must be grouted to minimize ground deformations outside the tunnel.
The tail skin seal protects the rear end of the shield against groundwater, the surrounding ground and support fluid (grout). Tail skin seals facilitate support of the tunnel face according to the above mentioned support methods. The tail skin seal also separates the shield from the ring annulus. It is designed to seal reliably the joint existing between the tail skin and the segmental lining. It should withstand the earth pressures, water pressures, and the grouting pressures, all of which are very high.
The grouting is injected via holes left in the prefabricated segments. The holes are fitted with screwed connection pieces and closed by plugs during ring installation. As shown in Figure 2.7, the precast segments used in Section 7 of the Tren Urbano project have a socket through which the grout was injected after the lining was installed and bolted in place. With the high pressure injection of the grout, the material can effectively prevent ground displacements towards the tunnel. With measurements carried out at the highest point of injection (tunnel crown), backfill grouting of the segments did not exceed 170kPa. The grouting volume and pressure are monitored and recorded at every excavation cycle. Secondary grouting for soil improvement was used throughout Section 7 (see Figure 1.2) but not in areas of the EPB tunneling considered in this thesis.
I
~ ;~--·c ~ x, *: i 's ~iibi 48 ),,* ~-*-i ·-, iMa BrI jnc's "cre'w" shlcd 118 IS)
Marc Bruncl's "compartmnent" ~held 1818}
Figure 2.1: Brunel's "Screw" and "Compartment" shields
i
3
r ktl
I_7 :7:T
!
Figure 2.2: Thames River Compartment Shield Open Face Cutting Wheel cutting wheel a)L o steel plates cutting arm Compressed Air Earth Pressure Balance (EPB) Slurry b compressed air b) Earth paste > screw conveyor -Ta C)
s lu rry - . air pressure
d) . suspension
Figure 2.4 Lovat@ MP254SE Series 16600
Screw conveyor Screw Cutter driving
Belt convey
Figure 2.6 Typical Bolt Connection for Segmental Lining of Section 7 Tunnels (Gay et al., 1999)
Figure 2.7 Grouting Holes in Segmental Lining of Section 7 Tunnels (Gay et al, 1999)
\
I....
-,AŽ
-1' / I4
AtWT kADO,h'DOS
C "'t~ , • •;•3.
Ground Deformation Prediction Methods
3.1. Introduction
In any type of tunneling through soft ground, the soil moves toward the opening, since this is where the stress relief has occurred. Furthermore, if the soil is below the water table, ground water will migrate towards the opening. Tunneling in soft ground causes deformations in two ways. First, there is deformation caused by the tunnel excavation; this is often the largest and is often characterized by the term "ground loss." The second is consolidation settlement, which is a long-term settlement caused by increasing the in-situ stress around the tunnel. The latter usually occurs over a long period of time.
Ground loss in shield tunneling occurs in five different phases (Suwansawat, 2002) (Figures 3.1to 3.5):
Phase 1: Ground loss occurs when an open-faced shield is used or when the shield is used at low
face pressures such that the soil is allowed to move towards the face (Figure 3.1).
Phase 2: Over-excavation outside the tunnel perimeter at the face of the machine that is caused
by over-cutters that can extend up to 100 mm outside the perimeter (Figure 3.2).
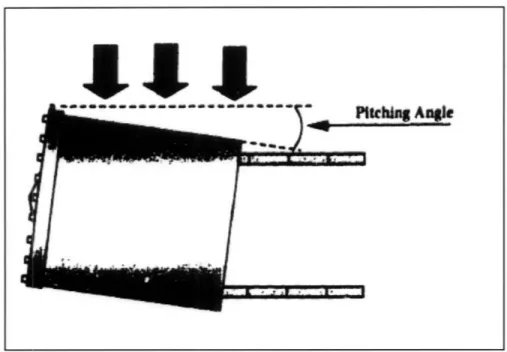
Phase 3: Plowing of the machine caused by pitching can cut an irregular shaped cross-sectional
area that is larger than the area of the shield (Figure 3.3).
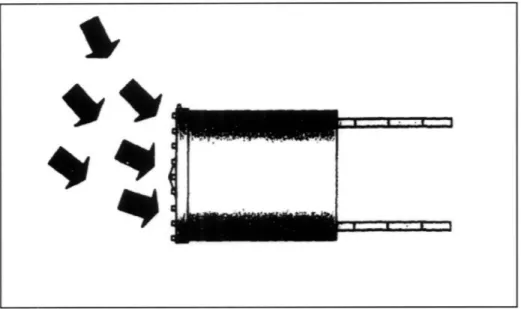
Phase 4: A disturbed zone around the shield surface due to shoving of the large diameter shield
can cause ground movement over the shield body (Figure3.4).
Phase 5: After the shield has advanced, the tail void can cause additional deformation due to
closure of the soil into the gap (Figure 3.5). This is usually eliminated by grouting around the lining as it emerges from the tail of the shield, before the soil displaces into the gap.
Although the construction of tunnels inevitably causes ground movements, their prediction and the assessments of potential effects on the infrastructure is very important in the planning, design and construction of a tunneling project in the urban environment.
3.2. Empirical Methods 3.2.1. Peck (1969)
Using data from many tunnel projects, Peck (1969) observed that the transverse settlements trough over a single tunnel could be represented by the error function or normal probability curve (also known as Gaussian curve). Peck's (1969) solution provides an estimate of the settlements to be expected at varying distances laterally from the centerline of the tunnel.
The properties of the normal distribution curve (i.e. Gaussian distribution) and its relationship to the dimensions of the tunnel are shown in Figure 3.6. The radius of the tunnel is represented by R, and the depth to the center of the tunnel is represented by z. The maximum settlement is the empirical determined maximum settlement Smax above the crown of the tunnel so that the displacement, 5, at any distance x from the centerline can be obtained by the following equation:
[3-1]
max 2
The points of inflection of the curve are located at a distance i at either side of the centerline. According to the properties of the normal distribution function, the settlement at x= i should be 0. 6&max.
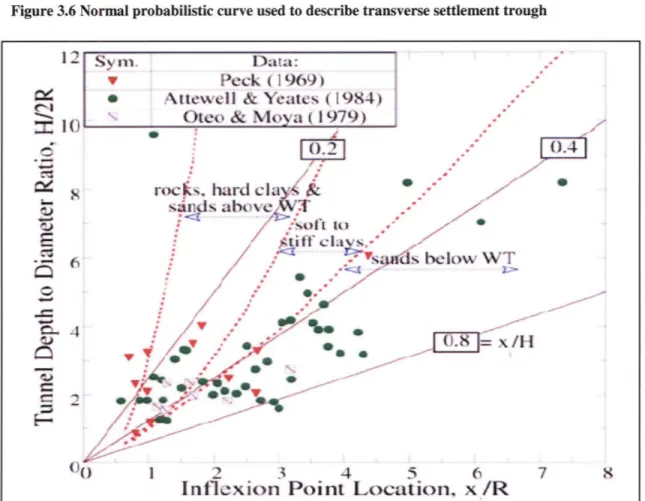
Using settlement data, some values of i have been calculated. Figure 3.7 shows a dimensionless plot with i/R in the x-axis and z/2R in its y-axis. Peck (1969) suggests a relationship between the parameter i, tunnel depth and tunnel diameter, depending on the ground conditions.
The volume of the surface settlement trough (per unit length of the tunnel), Vs can be evaluated by the integration of Equation 3-1 to obtain:
Vs = 2.5injd x
[3-2]
According to Cording and Hansmire (1975), the ground loss, GL, for most tunnels in clay, is equal to the volume of the settlement trough, GL= Vs. although this logically applies to undrained conditions (i.e., where there is no volume change). It need not apply where there are volume
strains in the soil (e.g., in drained or partially drained conditions). Since most clayey soils have relatively low permeability and compressibility, zero volume strain is assumed (as in Section 7 design). Typically, ground loss is expressed as the percentage fraction of excavated area of the tunnel (i.e., for circular tunnel of diameter D):
Vs
GL(%) )T DlO0
2 [3-3]Hence, 6max, can be obtained if the volume of ground loss is known.
3.2.2. O'Reilly and New (1982)
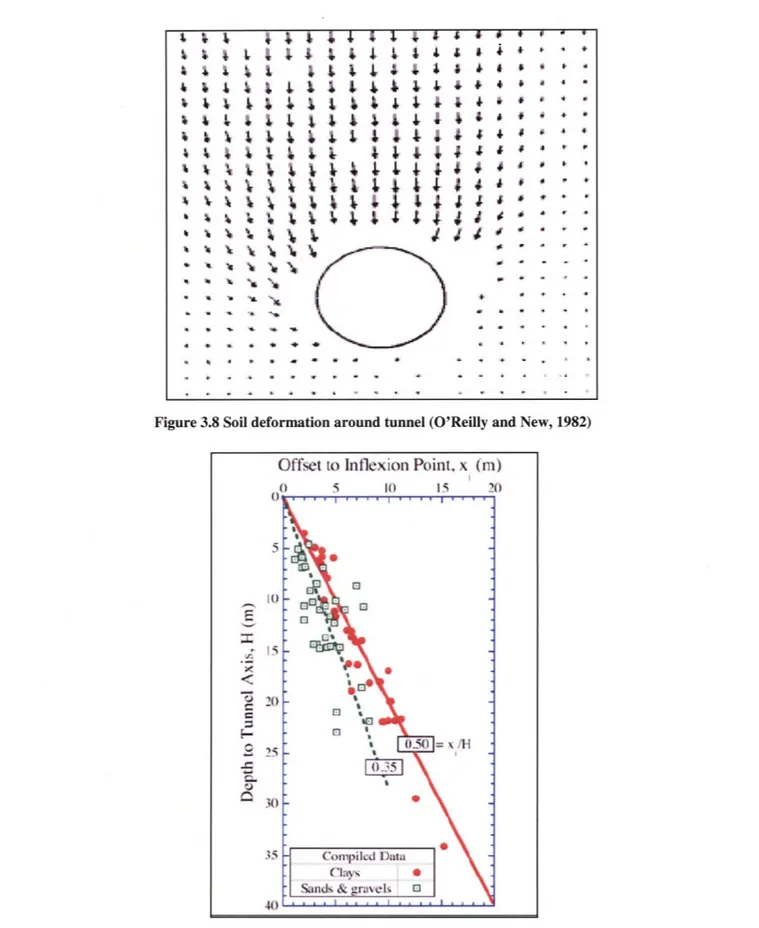
O'Reilly and New (1982) proposed, based on an extensive database, that ground movements above tunnels can be estimated using an empirical method similar to Peck's (1969). O'Reilly and New (1982) assumed that all movements in the soil occurred along radial paths toward the tunnel axis and that conditions of plane strain constant volume deformation apply. Along with field observations of settlements above a tabular mine opening, they suggested that the flow is directed towards a "sinkhole" which is located at a point below the axis level of the tunnel, closer to the invert level of the tunnel (Figure 3.8).
The assumption of radial flow means that the width of the zone of ground deformation decreases linearly with depth below the ground surface. This results in the magnitude if the ground movements increasing linearly with depth below the ground surface to conform to the plane strain constant volume assumption:
i = Kz
where i is the trough width parameter (i.e., inflection point) at a height z above [Lek4unnel axis and K is an empirical constant of proportionality which is equal to 0.5 for cohesive soil or 0.25 for granular soils (Suwansawat, 2002). Further review of field data suggests that for clays, K varies from 0.4 (stiff clays) to 0.7 (soft, silty clays). Granular materials above the water table have K values in the range of 0.2 to 0.3. Typical values for parameter K for a range of soil types and tunneling methods are shown if Table 3.1.
3.2.3. Mair and Taylor (1997)
Mair and Taylor (1997) reviewed an extensive database of field measurements and developed trough width parameters or inflection points based on their findings (Figure 3.9). Their analysis confirmed the conclusions of O'Reilly and New (1982) that for the majority of cases i=0.5z for practical purposes, irrespective of whether the tunnel was in soft clay or stiff clay. Although there was some scatter in the data, the envelope was bounded by i=0.4z and i=0.6z.
Furthermore, the expression of i=0.5z for tunnels in clay was reasonably consistent with the findings of Fujita (1981), who examined data from a large number of case histories in Japan for tunnels constructed in clay using different construction methods including: hand mined tunnels, blind shields, slurry shields and EPB shields. Fujita confirmed the conclusion of O'Reilly and New (1982) that the width of the surface settlement profile above the tunnels in clay is independent of the construction method. However, the solution hereon presented for cohesive soils is unlikely to be applicable to granular soils. Mair and Taylor (1997) determined an average value of K=0.35 for tunnels in granular soils.
3.2.4. Macklin (1999)
The relationship between volume loss and load factor was first addressed by Mair et al, and proposed that volume loss (e.g. ground loss) should be related to the load factor (LF),
defined as N/N NC (N being the stability ratio and N,.the critical stability ratio). The stability
ratio based on the definition by Broms and Bennermark is:
N= (US +) [35]UT
sU [3-5]
where o- is the surface surcharge (if any), y is the unit weight of the soil, z is the depth to the
tunnel axis, r, is the internal support pressure, and su is undrained shear strength of the clay.
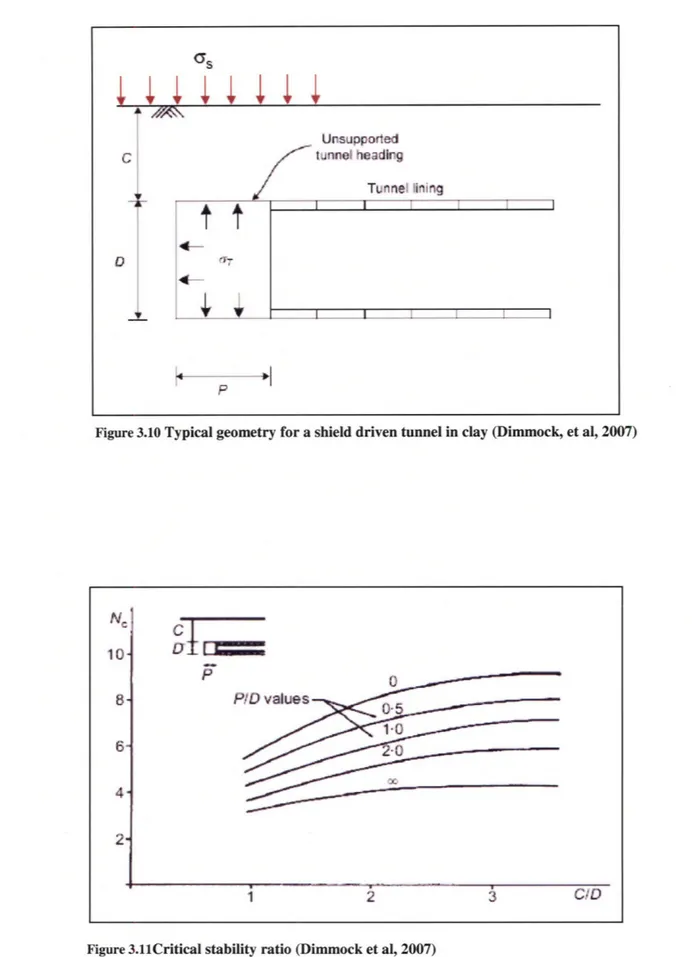
The critical stability ratio can be estimated froma series of curves relating N. to tunnel geometry, defined in term of the ratios P/D and C/D (Figure 3.10). P is defined as the length of unsupported tunnel, C is taken as the thickness of the clay above the tunnel crown, and D is the tunnel diameter. N, can be determined by using these ratios and Figure 3.11.
The relationship between volume loss and load factor has been reassessed by Macklin (1999) for overconsolidated clays based on new case history data. Figure 3.12 shows the 22 case histories which lie within a range enclosed within dashed lines on the plot. For tunnels where the depth (z) is greater than 4D, local shear failure was assumed, and hence an average value for shear strength within a diameter above and below the tunnel crown may be adopted. For shallow tunnels the value assumed by Macklin (1999) for su was the average between the tunnel axis and the surface.
Table 3.1 Summarized settlement trough data for different soils (after O'Reilly and New; 1982)
Ground conditions Tunneling methods Trough width Remarks
parameter constant, K
Stiff fissured clays Shield or hand 0.4 - 0.5 Considerable data
available; losses
normally 1 - 2%
Glacial deposits Shield in free air 0.5 - 0.6 Compressed air to
assist control of ground Shield with compressed air
movements
Recent silty clay Shield with compressed air 0.6 - 0.7
deposits
(su=10-40 kPa)
Granular material 0.2 - 0.3
Pltching Angle
...
I
I
I
Figure 3.1 Ground loss at the shield face (Suwansawat, 2002)
f'I
Over.Cutteror Copy Cutter
V
ace gap0O-100 mm
t,
Figure 3.2 Ground loss due to over-cutting (Suwansawat, 2002)
..
.I,
I
Sol
Figure 3.3 Ground loss due to pitching (Suwansawat, 2002)
I"1
Disturbed zone
J-Figure 3.4 Ground loss due to ground disturbance (Suwansawat, 2002)
Figure 3.5 Ground loss due to tail void closing (Suwansawat, 2002)
VI-
r=
U
..
Tall VoidSettlement Volume,
Figure 3.6 Normal probabilistic curve used to describe transverse settlement trough
12 Syrn. Data:.-'
F Peck (1969)
SAttewell & Yeates (1984)
1 - Oteo & Moya ( 1979)
"* " I fir ... .... . . . .. ... ... ... ... ... ....-.. . ... .. ".
i::
•- 2 0, 0.4 H o 1 2 3 4 5 6 7 8Inflexion Point Location, x /RI
Figure 3.7 Relation between settlement trough width parameter and tunnel depth for different
ground conditions tance, x A Vs=2.5i6max Volume Change in Ground, AVg ... ' ".-. " • V'Settlement. 6 Ground Loss at 1 m 114 TunnelVlTunme .. . . .. . . .
VL= AVLVo V AVs= AVL+ AVg
Inflexion
14 14JLI14 3d 444444~ 3d 4411444 4b~r Ii 444a 1.4 &~ &·b ii Ii. I I Ir 144 && p a 4' a 4,* 4r4 4 44C 41 46$ 4'C * N *: . a *
Figure 3.8 Soil deformation around tunnel (O'Reilly and New, 1982)
Figure 3.9 Relation between settlement trough width parameter and tunnel depth for
various ground conditions. (after Mair, et al, 1997)
Offset to Inflexion Point, x (m)I ' O " " * .4 4 P * I * p * :*
Figure 3.10 Typical geometry for a shield driven tunnel in clay (Dimmock, et al, 2007)
gTii
P
1 2 3 CiD
Figure 3.11Critical stability ratio (Dimmock et al, 2007) Unsupported tunnel heading Tunnel Oining
I1
4-P 10 8- 6- 4- 2-_ · i I I 1 i i i I __ I .~__~,~,,,,~,xl~~l-1~I
ý ý ýI I
* O'Reilly'
* Centrifuge test data (Mair et at)
- *- Crown Wharf
- Longford Street
-Regents Park
-- Attewell and Farmer's
Urnney and Heath (1996)
A Eden and Bozozuk (1969)
S Simic and Craig (1997) +
SHarris et al. (1994)
+ Atkinson and Potts C/D - 1-2
Garrison Dam tunnel
O Bowers et atl (1994) $
+ Garrison Dam
* Shirlaw et a. (1988)
A Sauer and Lama (1973) *
A m,, ! U 0-2 0-4 0-6 0-8 1`0 Load factor, L
Figure 3.12 Case history data of volume loss against load factor (Macklin, 1999) I UJU 10 -1) E 0 J'•_im
4.
Rio Piedras Section
The island of Puerto Rico, a commonwealth of the United States, is located approximately 900 miles southeast of Miami, Florida. It is the easternmost and smallest of the Greater Antilles (Figure 4.1), a chain of islands that comprises Cuba, Jamaica, Haiti, Dominican Republic and Puerto Rico. Puerto Rico is roughly 100 miles long by 35 miles long with a tropical climate due to the trade winds which blow steadily from the northeast. San Juan, the capital city of Puerto Rico, is located on the northeastern part of Puerto Rico (Figure 4.2). With a population of 3 million people, Tren Urbano helps cope with one of the most congested urban roadway networks in the world. One of San Juan's most important districts is Rio Piedras which is the location of the state University of Puerto Rico's largest campus, the University of Puerto Rico-Rio Piedras Campus.
4.1. Geological Background
The following are the geological units in the metropolitan area of San Juan based on three sources of information which include: Deere (1955), Kaye (1959) and Monroe (1976) (from Alba-Carbo, 1998). The stratigraphic sequence is as follows (from oldest to youngest):
(1) Bedrock
The bedrock is composed of Cretaceous rocks and Tertiary formations. The upper cretaceous age consists of pyroclastic, sedimentary, extrusive, and intrusive igneous rocks. The Tertiary formations are subdivided into Rio Guatemala group (middle and upper), the Aguada limestone (lower Miocene), and the Aymam6n limestone (lower Moicene).
(2) Quaternary Formations
These deposits from the Pleistocene and Recent epochs include from oldest to youngest:
* Old Alluvium (Hato Rey Formation); consists of thick deposits of clay, sand, clayey sand, sandy clay, and occasional beds of gravel.
* Santurce Sand; consists of red and tan clayey silty sand, pure quartz sand, partially cemented calcareous sand and quartz sand, and stiff red and gray mottled sandy clay.
* San Juan Formation; consists of calcareous sandstone.
* Floodplain Sediments; consist mostly of silty clay.
* Lagoonal Sediments.
* San Covered Lagoonal Sediments.
4.1.1. Bedrock
Section 7 of the alignment is composed, at the top, of decomposed and weathered calcareous limestone. At the southern limits of the section, alluvial soils may also underlain by the Eocene and Paleocene Rio Piedras siltstone. The boundary dividing the Cretaceous siltstone and the Tertiary calcareous limestone lies at depths below 40 meters within the town of Rio Piedras. Below the invert of the Rio Piedras Station lies the Aguada limestone (Figure 4.3). These formations consisting mainly of sands, gravel, shale, marl and interbedded limestone form pinnacles or buried karst features.
4.1.2. Quarternary Deposits
The entire Rio Piedras section alignment is constructed within deposits of Old Alluvium (i.e. Hato Rey Formation) deposits that comprise Pleistocene and Pilocene silty and sandy clays with interbedded sands. These deposits are typical in tropical regions and are characterized by their low contents of carbonates and organic matter, and its type of clay materials (Zhang et al., 2003). The layers that comprise the Old Alluvium will be discussed in the following sections.
4.2. Site Investigation
The site characterization is based on geotechnical exploration programs already carried out for Section 7 alignment, that were intended for final design and construction of the section as a design-build contract (from Alba-Carb6, 1998).
4.2.1. Stratigraphy
Data from borings performed in the Rio Piedras site investigation have confirmed the highly variable nature of the Old Alluvium. Figure 4.4 illustrates the vertical variability of the plasticity index (hence, soil classification) and SPT blowcount (Alba- Carb6, 1998). The Old Alluvium in the Rio Piedras section can be subdivided into three layers (Figure 1.4):
* Upper Clay (UC)
* Middle Zone (MZ)
* Lower Sand (LS)
Underlying the Old Alluvium deposits is the Aguada limestone.
The upper clay (UC) of the Old Alluvium is characterized as overconsolidated, medium stiff clays. With an average thickness of 9 meters, this layer consists mostly of red silty clays with patterns of white veins. Its measured cohesion and angle of internal friction are c'=25 kPa, and 9=2 5.50, respectively (Zhang et al., 2003).
The middle zone (MZ) is characterized as a very stiff to brittle esandy clay. This silty clay zone, which has an average thickness of 10 meters, has some pockets of sand present throughout the layer. Its measured cohesion and angle of internal friction are c'=23 kPa and q(=3 9.50
respectively. Although the UC and MZ have approximately the same cohesion, the friction angle varies greatly, due to the denser and greater coarse grained particles present in the MZ layer.
The lower sand (LS) is characterized as interbedded sand, silty and clayey sands. It contains coarse grained material (mostly sand) which reflect the higher hydraulic conductivity when compared to its overlying layers. It is composed of mainly clean, uncemented quartzitic sand (Zhang et al., 2003).
A detailed study of the microstructure of the Old Alluvium performed by Zhang (2002) revealed that material behavior can change significantly due to mechanical or chemical breakdown of the Fe-oxide aggregate coating. The intact material was very stiff and brittle (with significant apparent cohesion) however, compression of the soil produced a large decrease in the coefficient of consolidation, while large swelling and strains occurred during unloading. Air-drying caused complete mechanical disaggregation and a significant change in soil plasticity. These behaviors are explained in the following section.
4.2.2. Index Properties
The index properties exhibited by residual soils can vary with drying, remolding, and other physical disintegration processes. An extensive experimental program was conducted to investigate the variations in the index properties of the Old Alluvium.
Particle size analyses were performed on disturbed samples subjected to increasing degrees of remolding and different drying conditions (i.e. natural soil without drying, air-drying, and oven-drying). Figure 4.5 summarizes the effects of different drying conditions on particle size fractions. For both layers (UC and MZ), natural samples have the smallest clay fraction and air-dried the highest, showing that air-drying causes more disintegration than oven drying. Interestingly, the sand remains unchanged, while silt fraction decreases with drying, indicating that the increase in clay fraction is due to the breakdown of the silt-sized aggregates (Zhang et al., 2003). Finally, Figure 4.6 shows the particle size distribution for the Old Alluvium for both the natural soil and air-dried conditions where the increase in clay fraction due to air-drying is clearly visible.
Figure 4.7 shows the effects of remolding energy on the Atterberg limits in a Casagrande plasticity chart (data from Table 4.1). Both the liquid limit (w,) and plasticity index (I,) increase with remolding energy, while the plastic limit (w,) decreases. When comparing the different drying condition it is interesting to observe that compared to the natural soil, drying increase the plasticity index (Ip) and decreases the plastic limit (wp) for both layers (UC and MZ). For both cases, air-drying produced the highest I,.
4.2.3. Groundwater Table
The permanent groundwater table is located more than 20m below the ground surface, within the Middle Zone (MZ). Although dewatering was carried out prior to construction, perched water (i.e., pockets of water that collects on top of more impermeable lenses) within the MZ were encountered. Most of the tunnel construction was done almost exclusively in partially saturated soils.
4.2.4. Strength and Deformation Properties
Field tests performed on Section 7 include Menard Pressuremeter (PMT) and Standard Penetration Test (SPT). Standard Penetration Tests (SPT) was performed in conjunction with split spoon samples in accordance with ASTM standards. The standard penetration N-values were recorded as the number of blows required to advance 30 cm. The combination of split spoon and Shelby tube samples were used for testing in order to determine the strength properties of the soil. Tests included Pocket Penetrometer (PP), Unconfined Compression (UC) tests Unconsolidated-Undrained (UU) triaxial tests, consolidated undrained (CU) triaxial tests, and laboratory vane shear tests (more details can be found in Alba-Carb6, 1998).
Undrained Shear strength (s,) was estimated from SPT N values using two empirical correlations, i) su = 0.13N(ksf)(Terzaghi and Peck, 1948); and ii) s. = 4.4N(kPa) (Simpson, B.
et al., 1979). Based on these correlations, su = 100kPa above El. +10m, and su = 200kPa at El. +10m increasing to s, = 600kPa at El. -8m (Alba-Carb6, 1998). Local, practicing engineers use the correlation su = 5.5N(kPa), which would yield values of s, = 1lOkPa for soils above El.+10
and su = 220kPa at El. +10m increasing to s, = 660kPa at E1.-8m.
Coefficient of consolidation was reported by Alba-Carb6 (1998) and Zhang (2002) from laboratory oedometer tests using two methods: log-time and square-root time method. Figure 4.8 shows a typical consolidation tests performed on the Old Alluvium. It can be observed that during the first loading the soil is very stiff, but after unloading and reloading, the soil swells probably due to the breakdown of the microstructure. Figure 4.9 shows the very large reduction in coefficient of consolidation that occurs when the sample is recompressed. This behavior has led to a conceptual model of destructing proposed by Zhang et al (2004).
Table 4.1 Effects of drying on the index properties of the Old Alluvium (modified from Zhang, et al, 2002)
Particle Size Distribution (PSD) % Attbeberg limits
Drying Condition
Clay Silt Sand WL w, IP
Natural (UC) 44.0 42.6 13.4 72.9 32.2 32.2
Air Drying (UC) 62.5 24.0 13.0 69.9 40.8 40.8
Oven Drying (UC) 52.0 34.8 13.2 69.8 36.5 36.5
Natural (MZ) 13.1 41.7 45.1 44.7 22.5 22.2
Air Drying (MZ) 29.5 28.1 42.4 50.3 19.8 30.5
w
cz
wr
m,
Cooo c mO 40 C2 1 # o 4 CcO*4 M 0 g'g.4Al. 1 1 I i r i f 1 1 z i I I r r i I I r i i en
oS
o )9B
oo o o0 0 I·.·.i....l..;·i; ;. .. .- ~ i I 0 0 0o I-C N 0 C C C CE ? 1 i i r r t t i(rr"
vsi ~ AIrhIIC B~:rc Ij~t· A sand~"~ * SIqg
0 S S -ii S Sl·I
9r·, V * v *r 9 Va" 9. Vp 9 V * V 4P -di~~ Iad\ > : ~ 4IAx
Sl4RI NtbrbC
Figure 4.4 Plasticity index and SPT N-values for Old Alluvium (Whittle and Bernal, 2003)
y m Silt MSand
--
7-Wet
IOven-dried
Air-dried
UC
Wet
Oven-.dned Air-dned
MZ
Drying Condition
Figure 4.5 Effects of drying on the PSD of the Old Alluvium (from Zhang, et al, 2003)
70 60 50 40 30 20 10 0 pIk
0
C.2
U, (Ui __;_;_ 7_ ___; ___ __ _ _~__ I "- I*·P(l-L*I~l ·I*BIg··-)lgJ·MMO--4I
arl, sp* --r--- Ir --Figure 4.6 Particle size distribution (PSD) for different drying conditions
70
60
50
>% 40
20
10
0
0
10
20
30
40
50
60
Liquid limit [%]
70
80
90
100
Figure 4.7 Effects of remolding energy and drying on the Atterberg limits
..
. . ..
. . . .
Oedll
I
' ' ' ' ' , , , ' ' , i : : . i, , O ed11 I I I II I I Ib I I I I I I I I I | I l I I I I I I i I I I I aTI~ I I a I I a I I a a I I a I sI , I I i i i i • i i I I i . i I i I it1IUL .n. "CL? I- I I .L .. =CI I= .|~.J, .. , =i... I .1 I, | .C =u. 1
I
i I I ) I II I I i I I I II
I I I r I I ~ ' ~ IIII i y a t , i---~~- 1 'i -
1p
• ·--- I i I I i I IIIi i i iI I I I I III- I I I ,~I I I I I I I II
I I I i " i I IIi i iL I i i i i • i iI i i i i I
0.i 1 1 10 100
Consolidation Stress, cve [ksc]
Figure 4.8 Consolidation curve of Upper Clay (Zhang et al, 2003)
I 1 0.1
E
> 0.0 10.001
0.0001
0.00001
0.01 0.1 1 10 100 1000Consolidation
Stress,
do'v
[ksc]
Figure 4.9 Change in Coefficient of consolidation on load-unload cycles (Zhang 2002) 2
-o0.
2-4/ 4 810 -12 - -3rd unloading . .. . . . .... -m-1st loading (dry) , -- 1st unloading (dry) , -- 92nd loading --m2nd unloadingI A -- .---- 3rd loading . I I I 111 I I I III I i I III I III I- r I- I-I I I I III I I , III I I I III I I I 111 I I I III I I ) III I_~II I I I III5.
Ground Movement due to EPBM
As the first major tunneling project in Puerto Rico, there was difficulty in the EPBM construction program coordination. Figure 5.1 shows the alignment of the EPB section of the Rio Piedras Contract. Construction was very slow in the initial sections of the tunnels, but there was a progressive increase in the production in the latter part of each tunnel drive. Measurements of ground movement were closely monitored throughout the construction of the two EPBM tunnels. In general, monitoring was very frequent during tunnel excavation, when most of the movements were taking place. The Rio Piedras section had an extensive geotechnical instrumentation and monitoring program which will be addressed in sections that follow.
5.1. Construction Sequence
The twin tunnels have been named as Bayam6n Right tunnel (East ) and Bayam6n Left tunnel (West) as suggested by Perez (2002). Each tunnel comprises 361, 1.2m wide, precast concrete linings. As shown in Figure 5.2, construction of the EPB tunnels started in January 7, 1999 with the Bayam6n Right tunnel running from the UPR Station southbound towards the Rio Piedras Station. After 46 segments were installed (16 days) the tunneling was stopped to install a second trailing gear. Production speed increased thereafter with a final rate of advancement of 13.5 m/day (9 segments per day). The Bayam6n Right tunnel was completed on March 25, 1999 after 78 days. There was a turnaround period of 47 days before the EPBM was to start its advancement for the Bayam6n Left tunnel. Construction of the Bayam6n Left tunnel started on May 12, 1999 from the Rio Piedras Station northbound towards the UPR Station. Bayam6n Left tunnel over went a minor halt 10 days into construction for the installation of the second trailing gear. The production rate for the Bayam6n Left tunnel was in average 10.5 m/day (7 segments per day) and was completed in August 11, 1999. Total construction time for the twin tunnels was approximately 217 days.
5.2.
Instrumentation
Section 7 had a comprehensive monitoring program for construction. Instrumentation associated with the EPB tunneling includes:
* 58 bench mark array (BMA) * 9 subsurface settlement rods (SR)
* 10 surface settlement points (SS)
* One multiple point borehole extensometer (MPBX)
This instrumentation monitored ground and structure movements, in particular movement (i.e., settlement) of the existing structures above the tunnels, and deformation of the tunnels themselves (i.e., tunnel convergence). Figure 5.3 shows the location of the monitoring instruments as well as the two different transverse sections labeled B-B and C-C chosen for a detailed analysis.
Surface settlement along transverse section B-B was monitored by settlement rods SR40, SR41 and SR42. These settlement rods measured the vertical displacement at a depth of two meters from the surface. Section B-B is located parallel to the Gandara Ave. and bisects both tunnels forming an elliptical cross section in each tunnel face (Figure 5.4). Settlement rod SR41 is located approximately at the centerline of both tunnels while settlement rods SR40 and SR42 are to the west 14.79 meters and to the east 17.33 meters respectively.
Surface settlements along transverse section C-C was monitored by settlement rods SR37, SR38, and SR39, and run parallel to Saldafia St. and perpendicular to the EPB tunnel alignment, thus rendering a clean circular cross sectional view as shown in Figure 5.5. Settlement rod SR38 is located approximately at the centerline of both tunnels while settlement rods SR37 and SR39 are to the west 15.32 meters and to the east 13.32 meters respectively.
5.3. Measured Ground Deformations
The ground movements recorded by the settlement rods SR37 to SR42 are shown in Figures 5.6 to 5.11. Figure 5.6 shows the settlement data recorded by settlement rod SR37. It can be observed that the average settlement due to the construction of the Bayam6n Right tunnel (l1avg) was 9 ± 2 mm with a maximum settlement (8max) of 13mm. The average settlement due only to the construction of the Bayam6n Left tunnel (82avg) was 3.5 ± 1.5mm, with a maximum settlement of 5 mm. Table 5.1 shows the summary of the values recorded by the settlement rods SR37, 38, 39, 40, 41, and 42 (e.g., as shown in Figures 5.6 to 5.11). In Chapter 6, these values will help interpret the volume loss associated with the EPB tunneling.
Using the data recorded by the 58 BMA's located around the buildings and by 10 surface settlement points in the area, ground contours were developed for the two different stages of construction of the EPB tunnels (Perez, 2002). Figures 5.12 and 5.13 show the ground
displacement contours for the Bayam6n Right and Bayam6n Left tunnels respectively.
Contours of ground displacement after the construction of the Bayam6n Right tunnel (Figure 5.12) shows settlements in the range of -2 to -25 mm with the maximum movements recorded just over the Bayam6n Right tunnel. Also, contours of the ground displacement after the completion of the Bayamon Left tunnel (Figure 5.13) recorded net vertical movements between
-5 and -60 mm with the maximum movement recorded above the centerline of both tunnels. These contours reflect the movements associated with the construction of both tunnels.
Table 5.1 Summary of displacements measured in settlement rods SR37 to SR42 5mm 21mm 2mm 2mm 10mm None recorded 9 ± 2mm 19.5 ± 1.5mm 17 + 1mm 6 lmm 13 _ 1mm 10 ±1 mm 3.5 + 1.5mm 18 + 3mm 1.5 ± 0.5mm 1.5 ± 0.5mm 9 ± 1mm None recorded
C-C
B-B SR37 SR38 SR39 SR40 SR41 SR42 13mm 21mm 18mm 7mm 14mm 11mmh N
W
N Q, \Q) PI vI
E
re uic o 0 C\,I ., CCl o I D (-0 O 0o E 0 -C 0 o .-CE E 'C/ E 0 4-( 00 Q o I zt I-E · 0 0 0 0 0 0 0 0 0 0 0 0 0 0 0 0
VI) 0 LO, 0 LO 0 LO 0 LO 0 LIO 0 tIo 0 LO.
r"- I,- c (D LO to v Nr c m c'l C ,
7
0 WAL -D m 0 -rC C U) 0 x 0a aj U)e CI U) T- E 0 U) Ccn 0) C C/) C U) E, 0).0 C 0-ut U)- 0 cO U)SR-41
Figure 5.4 Cross section B-B (modified from Perez, 2002)
20-151 10--20 -15 I 10 -5 -20 -15 -10 -5 0 5 0I I I I 15I I 10 15 20
Horizontal distance from centertine between tunnels (m)
(-) West , (+) East
Figure 5.5 Cross section C-C (modified from PNrez, 2002)
BR BL 15-10 5--5 0 5 10 20 -15 -10
Horizontal distance from centerLine between tunnels (m) (-) East , (+) West SR-37 SR-38 SR-39