HAL Id: halshs-01348948
https://halshs.archives-ouvertes.fr/halshs-01348948
Submitted on 17 Apr 2018
HAL is a multi-disciplinary open access
archive for the deposit and dissemination of
sci-entific research documents, whether they are
pub-lished or not. The documents may come from
teaching and research institutions in France or
abroad, or from public or private research centers.
L’archive ouverte pluridisciplinaire HAL, est
destinée au dépôt et à la diffusion de documents
scientifiques de niveau recherche, publiés ou non,
émanant des établissements d’enseignement et de
recherche français ou étrangers, des laboratoires
publics ou privés.
Identifying the main uncertainty drivers of energy
security in a low- carbon world: The case of Europe
Céline Guivarch, Stéphanie Monjon
To cite this version:
Céline Guivarch, Stéphanie Monjon. Identifying the main uncertainty drivers of energy security in
a low- carbon world: The case of Europe. Energy Economics, Elsevier, 2016, 64, pp.530 - 541.
�10.1016/j.eneco.2016.04.007�. �halshs-01348948�
1
Identifying the main uncertainty drivers of energy security in a
low-carbon world: The case of Europe
Céline Guivarch1, Stéphanie Monjon23
Note: this text is a post-print from Guivarch, Céline, and Stéphanie Monjon. 2016. « Identifying the main uncertainty drivers of energy security in a low-carbon world: The case of Europe ». Energy Economics. doi:10.1016/j.eneco.2016.04.007.
Abstract
This analysis contributes to recent efforts to better understand the evolution of energy security in a low-carbon world. Our objective was to assess how energy security may change over the course of the century, and to what extent these changes depend on the uncertainty of the factors that drive the evolution of energy systems, including future technologies, improved energy efficiency, fossil fuel resources and markets, and economic growth. To this end, we focused on Europe and on a set of energy security indicators based on three perspectives: sovereignty, robustness and resilience. A database of scenarios allowed us to account for the large uncertainties surrounding the determinants of future energy systems. We then analyzed the way energy security indicators evolve over time, and how their trajectories vary across scenarios. We identified the indicators that vary the most between scenarios, i.e. the indicators whose future evolution is the most uncertain. For these indicators, we performed an analysis of variance to estimate the contribution of each driver to the uncertainty of the indicators. The paper shows that the European double target of significantly decreasing CO2 emissions and increasing the security of the
supply of energy may be difficult to reach. Nevertheless, some levers could facilitate the transition to a low-carbon society while improving energy security, or by limiting its degradation. The results emphasize the importance of policies in favor of low or zero carbon technologies in power generation, but also the differences in their contributions to the complete uncertainty of the indicators. Policies promoting energy efficiency also play a role but only in the resilience of TPES. These policies are thus important levers for mitigating the negative impacts of climate policies on energy security.
Keywords: Climate policy, energy security, Europe, scenarios database, sovereignty, robustness, resilience.
JEL Classification: Q43, Q47, Q54 Acknowledgement
1 CIRED, 45bis avenue de la belle Gabrielle, 94736 Nogent-sur-Marne, France. Email : guivarch@centre-cired.fr.
2 Université Paris Dauphine, PSL Research University, LEDa, 75016 Paris, France, CIRED and CEPII. Email :
stephanie.monjon@dauphine.fr 3 Corresponding author.
2
The development of the Imaclim-R model was supported by the Chair ‘Modeling for sustainable development’, led by MINES ParisTech, Ecole des Ponts ParisTech, AgroParisTech and financed by ADEME, EDF, GRTgaz and SCHNEIDER ELECTRIC. The views expressed in this article are the authors’ and do not necessarily reflect the views of the aforementioned institutions.
3
1. Introduction
In 2008, the Lisbon Treaty launched new climate and energy policies in the European Union with the aim of significantly decreasing CO2 emissions, while increasing the security of the supply of energy in the
Union, at reasonable costs in order to maintain competitiveness. Since then, climate policy and energy security policy have been closely linked in the EU, as detailed in the European Energy Roadmap 2050 (European Commission, 2011).
Today it is clear that the two issues are intertwined. They share a common root cause, the demand for energy, but the solutions for improving energy security and reducing greenhouse gases (GHG) are not necessarily the same, and may involve some contradictions. For instance, the deployment of renewable energies led to greater dependency on natural gas for peak load and back-up, especially on Russian gas. The recent geopolitical crises between Russia and Ukraine revealed the vulnerability of European energy on this respect.
Energy security does not only refer to geopolitical risks or dependency on primary fuels but is multi-faceted. Several recent contributions proposed an analytical framework to evaluate the concept by incorporating different dimensions or perspectives of energy security (APERC, 2007; Cherp et al., 2012; Winzer, 2012). In this paper, we use the framework developed by the Global Energy Assessment (Cherp et al., 2012). The starting point of this approach is to work with a definition of energy security that incorporates the likely radical transformations of energy systems in the long term. Energy security is defined as the low vulnerability of vital energy systems. Even if the security of oil supplies remains important, contemporary energy security policies must also address other energy systems. This point is crucial in the current context in which many stakeholders call for speeding up the energy transition. Vital energy systems thus refer to different energy carriers (electricity, hydrogen, liquid and synthetic fuels), or to the total energy supply.
Several papers recently used this framework to explore the consequences of climate policies for energy security from a long-term perspective (Cherp et al., 2013; Jewell et al., 2013, 2014; Guivarch et al., 2015). These analyses show that the implementation of ambitious climate policies affects vital energy systems differently. They also emphasize the importance of the time dimension. For instance, Guivarch et al. (2015) showed that the impact of climate policies is mixed in the short term and globally good in the medium term, whereas in the long term, there is a risk of degradation of energy security, especially related to the electricity system.
The objective of this paper is thus to highlight levers that could improve energy security, or limit its degradation, if ambitious climate policies are implemented. This is a companion paper to Guivarch et al. (2015). In the present paper, we take a close series of energy security indicators and analyze their dynamics over the course of the present century in a low-carbon world. We aim to identify the main drivers of these dynamics among key low and zero carbon technologies, the evolution of energy efficiency, fossil fuel resources and markets and economic growth. The positive or negative impacts of ambitious climate policies on energy security may depend on the evolution of some drivers of the
4
uncertainty of future energy systems.4 For instance, the availability and affordability of carbon capture and
storage (CCS) technologies would make the use of coal possible in a low-carbon world, while improving energy security for coal-producing countries. Without being sure of succeeding in developing low-carbon technologies, public policies will play a crucial role in their future availability and cost. This is also true of energy efficiency and for economic growth.
The paper describes an original methodology to investigate these issues. Using the energy-economy-environment model, Imaclim-R, we created a database of long-term scenarios in which different determinants of future energy systems, on both the supply and demand side, are considered. Each scenario describes a possible future in terms of economic growth, fossil fuel availability, energy efficiency and the cost and the availability of different low-carbon technologies. For each possible future, we imposed a global CO2 emission trajectory leading to the stabilization of the concentration of CO2 in the
atmosphere at 550 ppm CO2-eq. A set of indicators that capture the multi-faceted aspect of the energy
security concept were assessed in each scenario, enabling us to analyze the evolution of the indicators in all possible future worlds, and their dispersion over the course of the century. By focusing on the indicators with the widest dispersion, and by applying a multi-factor analysis of variance (ANOVA), we identified the main explanatory factors. The analysis was applied to Europe and identified the most important drivers of energy security indicators in a low-carbon world. The method identified some levers that could be used to improve energy security if ambitious climate policies are implemented.
Section 2 is a brief review of the literature exploring the impacts of climate policies on long term energy security. In Section 3, we explain our contribution and detail the method we used. We present the series of indicators used for the analysis and the energy-economy-environment model, Imaclim-R, used for the simulations. We explain how we built our database of scenarios and the tools we used to analyze the results of the simulations. In Section 4, we present the results: first, the dynamics of the indicators in all the scenarios for the whole century and the assessment of their dispersion; second, the contributions of the different drivers to this dispersion with an analysis of variance. In Section 5 we discuss our results and conclude.
2. Climate policy and energy security: recent advances
Although the issue of energy security is high on the policy agenda and pervasive in the discourse, it is seldom accompanied by a clear definition of the term. As explained in Winzer (2012), the concept of energy security is “blurred”, “elusive” or “slippery”. This is partly due to its multi-faceted nature. The assessment of energy security thus implies developing an analytical framework to identify the different dimensions of the concept. Several recent contributions proposed different frameworks (APERC, 2007; Cherp et al., 2012; Winzer, 2012).
In this paper, we use the framework developed by the Global Energy Assessment (GEA) in a series of recent papers that specifically examined the effect of climate policies on energy security worldwide and in
4 The term uncertainty is used here like Saltelli (2002) who defined it as “Sensitivity analysis is the study of how the uncertainty in
5
different regions (Cherp et al., 2013; Jewell et al., 2013, 2014; Guivarch et al., 2015). The aim of the analytical framework is to assess the “new” energy security dealing with tensions in the supply of natural gas in Europe, the increasing demand for energy in Asia, and the transition towards low-carbon societies that began in the 2000s. The analytical framework is based on a definition of energy security that is sufficiently flexible to include the likely future transformation of energy systems in the long term. Energy security refers to the low vulnerability of vital energy systems. These systems comprise not only primary fossil fuels but also different energy carriers (electricity, hydrogen, liquid and synthetic fuels), which will play an increasing role in a low-carbon world. The GEA approach aims to identify the vulnerabilities of these systems, from three perspectives: sovereignty, robustness and resilience. The sovereignty perspective refers to threats posed by external actors and the exposure of a region/country to such threats (Cherp and Jewell, 2011). It is related to past events such as energy embargoes or price manipulations and to foreign control of energy resources. From this perspective, energy security is generally evaluated through the reliance of a region on imported energy sources or, at a more global level, through international trade in energy. The robustness perspective deals with natural and technological to energy systems. Historically, it is related to major accidents, electricity blackouts and resource scarcity. The resilience perspective focuses on the ability of the energy systems to resist diverse disruptions caused by social and economic factors that are difficult to predict and control (political instability, price volatility, etc). From a resilience perspective, the future is unpredictable. This future uncertainty can be related to markets, technologies and societies. From this perspective, energy security can be apprehended in terms of the range of energy options. The risks apprehended by the framework we use refer not only to traditional ones, like geopolitical risks, but also to new challenges, for instance those posed by the development of electricity systems.
Cherp et al. (2013) envisaged different levels of ambition in reducing world GHG emissions and introduced uncertainties by considering different levels of GDP growth and of the availability of fossil resources. These different scenarios were simulated in two different integrated assessment models. These authors found that climate mitigation policies will increase the resilience of energy systems as reflected in their diversity, and will improve sovereignty around the middle of the century when low-carbon and fossil energy source co-exist. Climate policies will enable deep penetration of solar energy in the electric sector and of bio-fuels in the liquid fuel sectors, which will reduce diversity by the end of the century.
Jewell et al. (2013) examined the future evolution of energy security in major economies: China, India, the European Union and the United States of America. Their analysis is based on results of six integrated assessment models. In each model, two temperature limitation targets are considered: an increase of 3 °C, and an increase of 2 °C. Their results conclude that different regions share common trends. For instance, climate policies reduce energy imports and increase the diversity of energy options. But the major economies would also be exposed to specific changes. For instance, in the EU, climate policies would decrease dependence on imports, while increasing the diversity of energy options in the transport sector. With climate policies, China would not completely exhaust its oil and gas reserves, thereby allowing it to avoid becoming completely dependent on imports of these products.
Jewell et al. (2014) explored low-carbon scenarios to limit the global mean temperature increase to 2°C above the pre-industrial level by 2100. Three elements differ among the scenarios: the availability of some
6
low carbon energy sources (solar and wind, biomass, nuclear energy etc.), improvement of energy efficiency, and the availability of advanced transport technologies. The sovereignty perspective is evaluated by global trade in energy, some regional energy balances, and trade in individual fuels. The resilience perspective is evaluated by world energy intensity and the diversity of the primary energy supply at international and regional levels. These authors found that low-carbon scenarios are associated with lower trade in energy and increased diversity of energy options than in the baseline scenario, but that a few risks emerge in the second half of the century due to high trade in natural gas and hydrogen and limited range of sources of electricity. Indeed, in some low-carbon scenarios, the levels of gas trade are equivalent to the levels of oil trade today. However, gas would not dominate any particular sector as oil dominates the transport sector today. Other indicators suggest an improvement in energy security in the low-carbon scenarios.
Guivarch et al. (2015) investigated the effect of climate policies on energy security indicators at three specific time horizons, 2025, 2050 and 2075. This analysis focused on the relative variation in energy security indicators between a case with climate policies and a case without climate policies. The results showed that very few indicators of energy security, e.g. the ratio of oil production to resources and energy intensity, are unambiguously improved by climate policies. Others are degraded either at a certain time horizon, or in certain scenarios. For instance, indicators of the sovereignty perspective, which are all improved, on average, from the medium term on, may be degraded in some scenarios. Moreover, tensions concerning some aspects of energy security could emerge around 2025, which is a critical period for international climate negotiations. The paper also showed that there is a risk of degradation of energy security in the long term, due to the greater use of electricity carriers and greater concentration of primary sources for the generation of power. Lastly, the paper pointed out that the dispersion of the indicators tends to increase with the time horizon and briefly explored the issue in the medium term.
3. Contribution and method
The aim of the present paper is to contribute to recent efforts to improve our understanding of the impact of climate policies on energy security. Our objective is to assess how energy security indicators could evolve in a low-carbon world, and to what extent changes depend on the uncertainty surrounding the factors that drive the evolution of energy systems, such as future technologies, improved energy efficiency, fossil fuel resources and markets, and economic growth.5 To our knowledge, this issue has not
been explored to date.
To examine the evolution of energy security in a low-carbon world, we focused on Europe and on a small number of energy security indicators. We evaluated the evolution of these indicators up to 2075 in a database of long-term scenarios built with the energy-economy-environment model, Imaclim-R. To explore the relevant uncertainty factors, we constructed a large set of scenarios, following a method previously described in Rozenberg et al. (2014). We identified the main driving forces (or main uncertainty drivers) that affect the future outcomes of the systems, e.g. learning potentials and the costs of key
7
technologies. We translated these driving forces into model parameters, and combined them to build a large number of model runs. This process led us to build what we call a “scenario database”. In all the scenarios, we imposed a global CO2 emission trajectory leading to the stabilization of the CO2
concentration in the atmosphere at 550 ppm CO2-eq.6 It was then possible to analyze the way energy
security indicators evolve over time in each scenario, and how their trajectories differ among the scenarios. We identified the indicators that vary the most between scenarios, i.e. the indicators that have the most uncertain evolution. For those indicators, we analyzed the contribution of each driver to their uncertainty, with an analysis of variance. In this section, we present the indicators, the model Imaclim-R, and the uncertainty drivers on which the database of scenarios is based. We then explain the tools we used to analyze the dispersion of the indicators.
The indicators
As explained above, we used the GEA’s analytical framework based on three perspectives. Within this framework, several indicators are appropriate to inform on a perspective of a specific energy system. Although they used the same assessment framework, Cherp et al. (2013), Jewell et al. (2013) and Jewell et al. (2014) selected somewhat different indicators depending on the models or the objective targeted. In this paper, our selection of indicators results in a trade-off proposing (i) a limited number of indicators to ensure the results are readable, (ii) a variety of indicators covering the different perspectives of the energy security concept, (iii) indicators that can be calculated with the model IMACLIM-R. Moreover, all our indicators are representative of the indicators frequently discussed in the literature.7 Table 1 lists the
indicators selected.8
Table 1 – Vulnerabilities of vital energy systems and related indicators Vital energy systems Sovereignty
perspective
Robustness perspective
Resilience perspective Total primary energy
supply
Share of imports in TPES
/ Energy intensity of GDP Primary fuels: oil,
coal, gas Regional import dependence Production/Resource ratio9 Concentration of markets10
Electricity carrier Share of imports for Share of renewable Concentration of
6 The emission target chosen lies between two Representative Concentration Pathways (RCP): RCP 2.6 and RCP 4.5. RCP 2.6 is a very
low trajectory and can only be reached with rather specific assumptions. We explored the scenarios with an emission trajectory leading to high probability of remaining below 2°C (consistent with a RCP 2.6 trajectory) but more than a third of the scenarios do not run until the end of the time horizon due to the stringency of the constraint. This emission target would not have allowed us to fully explore the variance of results and its determining factors. Conversely, RCP4.5 is a relatively high trajectory, not a very ambitious mitigation path. The emission target we chose thus lies between RCP 2.6 and RCP 4.5, which is interesting from a policy perspective because mitigation costs differ substantially between forcing levels of 2.6W/m2 and 4.5W/m2 (Krey et al., 2014).
7 The indicators selected are very close to those used in Guivarch et al. (2015).
8 All the indicators were defined such that an increase (respectively a decrease) in their value indicates a worsening (respectively an
improvement) of the dimension of energy security they measure.
9 The model only evaluates this indicator for oil. 10 The model only evaluates this indicator for oil.
8
generating power11 energies in electricity
production (excluding biomass and hydro)
primary energy sources used for electricity production
The total primary energy supply (TPES) is the first vital energy system we analyzed. The sovereignty perspective is apprehended by the share of TPES imports that measures the dependence of the energy supply on imports. From a resilience perspective, the energy intensity of GDP is measured by the ratio of TPES to GDP. It informs about the amount of energy required to generate the GDP of the region. The more energy the economic activity of a country requires, the more it will be exposed to diverse disruptions due to social and economic factors.
Primary fuels (oil, gas and coal) are the second vital energy system we examined. The sovereignty perspective is evaluated by net imports of oil, gas and coal into the region. The robustness perspective is apprehended by the ratio of oil production to oil resources.12 The resilience perspective is measured by
the global concentration of suppliers of oil. We used the Herfindahl-Hirschmann index, calculated as the sum of squared market shares of oil producers. Note that this index increases when the market is dominated by a small number of producers. These two indicators are global, not specific to Europe.13
The last vital energy system we analyzed is the electricity carrier. From a sovereignty perspective, the vulnerability of European electricity production is evaluated through its reliance on imported fuels as primary sources for the generation of power. The robustness perspective is apprehended by the share of renewable energies in electricity production by excluding biomass and hydroelectric electricity.14 The
integration of large amounts of intermittent energies into the electrical grid is technically complex and could make the network more vulnerable (Quoc Hung et al., 2016).15 This indicator thus highlights an
important aspect of future energy security. The concentration of primary energy sources, measured by the Herfindahl-Hirschmann index of the shares of the different primary sources, informs on the resilience of the electricity generation capacity. This index increases when a smaller number of sources are responsible for a large share of the generation, i.e. when the diversity of the mix decreases.
All the indicators provide useful information on the energy security of a region but their importance may change depending on the time horizon. In the short term, primary fuels indicators are certainly those that should be examined as carefully as possible, while electricity indicators become crucial in the longer
11 When assessing the rate of energy independence, uranium is conventionally not included in imported fuels. We applied the same
rule.
12 It is more common to present the inverse ratio, i.e. the ratio of resources to production, expressed in years of reserves remaining
at the current rate of extraction. However, we use the ratio of production to resources, so that the value of the indicator increases with a decrease in availability.
13 In our modeling framework, oil trade is not modeled bilaterally but via an international pool.
14 The development of renewable energy capacities improves the energy security of a region, especially by reducing dependence on
imported fossil fuels. Nevertheless, renewable energies are not the only way to decrease the imports of fossil fuels and this aspect is taken into account with the previous indicators of the resilience perspective.
15 The expected major increase in the contribution of renewable energies to power generation is mainly due to the increase in
9
term. The TPES indicators give a more global view of the energy needs of a region and play an important role non-stop.
The model16
The Imaclim-R model (Waisman et al., 2012) is a multi-region and multi-sector model of the world economy that represents the intertwined evolution of technical systems, energy demand behavior and economic growth. It combines a computable general equilibrium (CGE) framework with bottom-up sectoral modules in a hybrid and recursive dynamic architecture. In addition, it describes growth patterns in second best worlds with market imperfections, partial uses of production factors, and imperfect expectations. The model represents endogenous GDP and structural change, energy markets and induced technical change. The scope of GHG gases represented is restricted to CO2 emissions from fossil fuel
combustion.
The model is disaggregated into twelve regions and twelve sectors, including five energy sectors: coal, oil, gas, refined products and electricity. Europe is one of the 12 regions. Details on the regional and sectoral disaggregation can be found in supplementary material. The model is calibrated on the 2001 base year by modifying the input-output tables provided by the GTAP-6 dataset (Dimaranan and McDougall, 2006) to make them fully compatible with 2001 IEA energy balances (in Mtoe) and data on passenger mobility (in passenger-km) from Schafer and Victor (2000). The model simulates future trajectories through the recursive succession of static equilibria and dynamic modules with yearly steps.
The main exogenous assumptions are increased demography and labor productivity, the maximum potentials of technologies (renewable, nuclear, CCS, electrical vehicles, etc.), with learning rates decreasing the cost of technologies, fossil fuel reserves, the parameters of the functions representing energy-efficiency in end uses.
The scenario database
In the long term, high uncertainty surrounds population growth, the growth and structure of the economy, energy markets, low-carbon technologies, and even energy efficiency. Following the methodology proposed by Rozenberg et al. (2014), we constructed a database of scenarios combining hypotheses on a large number of model parameters. This allowed us to consider many different types of uncertainty drivers simultaneously.17
Here we briefly present the six different drivers we analyzed and the alternatives we considered. A full description of the choice of parameters is given in the Appendix. For each parameter, the alternatives considered are contrasted, but no extreme assumption is included.
• Availability of different types of low carbon technologies:
16 A full description of the model is available at http://www.imaclim.centre-cired.fr/IMG/pdf/imaclim_v1.0.pdf. Details on the model
structure and results with respect to various aspects (energy technologies, energy efficiency, fossil fuels, macro economy) can be found in the publications listed in supplementary material.
17 This method is frequently used to investigate the uncertainty space in integrated assessment models. Of course, only a portion of
the full uncertainty space is investigated, and the results depend on the choices of the sets of parameters to vary and of the alternative values tested. Obviously, the impact of an uncertain driver on the results depends on the numerical assumptions behind each state of the driver. This limitation is inherent to our methodology, like in all sensitivity analyses, but cannot be avoided when accounting for uncertainty in a large number of model input parameters.
10
The availability and diffusion of some low carbon technologies will strongly impact the future of energy systems. We considered three different groups:
- Low carbon power generation technologies (nuclear energy and renewable resources);18
- Carbon capture and storage (CCS) technologies;
- Low carbon end use technologies in the transport and residential sectors (electric and hybrid vehicles, efficient buildings and household equipment).
For each group of low carbon technologies, we built two sets of assumptions for parameters describing their costs, the learning rates on investment costs and maximum market shares over the entire simulation period. One alternative corresponds to limited availability (high cost and low potential market share) of the technology concerned; the other corresponds to high availability (low cost and high potential market share).
• Induced energy efficiency (IEE):
Energy efficiency in end use sectors (agriculture, industry, construction and services) is endogenous and is driven by energy prices.19 We introduced two alternatives for the parameters to describe its
maximum annual improvement in the leading country and the catch-up speed of the other countries: one fast IEE and one slow IEE.
• Fossil fuel resources and markets:
This set describes assumptions concerning oil, gas and coal resources and markets. These parameters include: (1) the amount of ultimately recoverable resources; (2) the amount of investment by Middle Eastern countries required to sustain oil production at the scale of existing oil fields and to explore new fields; (3) inertia in the development of non-conventional production; (4) the indexation (or de-indexation) of gas prices to oil prices; and (5) changes in coal prices in response to fluctuations in demand. One assumption corresponds to relatively abundant fossil fuels, the other to relatively scarce fossil fuels.
• Economic growth:
In the Imaclim-R model, economic growth is endogenous but is driven by exogenous trends of population growth and labor productivity. We built three alternative combinations of population growth and labor productivity trends that correspond to the SSP (Shared socioeconomic pathways) 1, 2 and 3. SSPs are the new generation of socioeconomic scenarios for climate change research (O’Neill et al., 2014). SSP1 can be described as a scenario with low population and high productivity growth, while SSP3 is a scenario with high population and slow productivity growth and SSP2 lies between the two20.
Combining those assumptions gave 96 (3 × 25) baseline scenarios with different trajectories of CO 2
emissions during the course of the century. In each of these scenarios, we added an exogenous constraint on global CO2 emission trajectories leading to 96 climate policy scenarios. Figure 1 shows global
emissions over the 21st century in the 96 simulations in the absence of a climate policy (each black line
18 In the “low” assumption, it is assumed that the new generation of nuclear energy is not available at all.
19 See Bibas et al. (2014) for a detailed description of how energy efficiency is modelled and how it impacts the model. 20 The populations and GDP quantifications of SSPs are available on a IIASA database:
11
corresponds to one scenario) and the cap on global emissions when climate policies are implemented (red line).21
Figure 1: Global emissions over the century in the 96 simulations with no climate policy (each black line corresponds to one scenario) and the cap on global emissions when climate policies are
implemented (red line)
The trajectory of emissions was chosen to be consistent with the stabilization of CO2 concentrations in
the atmosphere at 550 ppm CO2-eq: global emissions peak in 2020, and are reduced by 30% and 75%
with respect to the 2010 level in 2050 and 2100, respectively. As a working hypothesis, we assume an international climate regime imposing a global carbon tax (or a corresponding global cap-and-trade system) designed to reach the target emission trajectory from 2011.22 The tax level is determined
endogenously and changed each year to respect the global emissions constraint. Although extreme, this assumption has the advantage of avoiding the need to define an inevitably arbitrary share of the reduction in emissions among countries. Like in Guivarch et al. (2015), we restrict our analysis to the period up to 2075, beyond which certain factors, notably technologies, are very uncertain.23
21 The model is calibrated in 2001, which is therefore the starting year of the modeling horizon. In the reference scenarios, CO2
emissions over 2001-2010 vary slightly between the scenarios. But the variation is small, less than 5%. For instance, this variation is smaller than the uncertainty in CO2 emissions measurement. See for instance Le Quéré et al. (2015) who report, for the last decade
available (2005-2014), CO2 emissions equal to 9±0.5 GtC/yr, where 0.5 GtC/yr represents one standard deviation of the measured
emissions.
22 This working hypothesis, a mitigation policy starting in 2011, is not realistic, just as an international climate regime leading to a
global carbon price is not to expect, at least on the short-term. However, since the Copenhagen Agreement, we are also not anymore in a “reference” scenario as some mitigation measures in some regions of the world are already implemented, including non-Annex I countries.
23 We limit the period to 2075 because a few scenarios (12 on 96) of the database do not run until 2100 (but run beyond 2075). If
we had chosen to keep only scenarios running until 2100, we would have lost the scenarios based on sets of “less favorable” assumptions in terms of CO2-emission reductions. We think that it is important to keep these scenarios for our analysis.
12
Analysis of the indicators
Our aim was to identify the determinants of energy systems that play a crucial role in the evolution of energy security in a low carbon world. Guivarch et al. (2015) showed that the effect of climate policies on energy security can differ significantly depending on the indicator or the time horizon considered. In the present paper, the first stage of the analysis was to evaluate the robustness or uncertainty of the simulated trajectories of the energy security indicators, with respect to the uncertainty of the driving forces. To this end, we calculated the relative standard deviation at each date, defined as the ratio of the standard deviation to the (arithmetic) mean value across all scenarios. This statistical tool reveals the extent of variability of a result in relation to its mean value.
The second stage of the analysis was to identify the factors that contribute most to this variability. The contributions of each uncertainty driver over time result from an analysis of variance, ANOVA, based on the partitioning of the sum of squares in a linear regression. The total sum of squares (i.e. the variance of the results, multiplied by the number of scenarios minus one) can be partitioned into the explained sum of squares linked to each uncertainty driver and the residual sum of squares (which corresponds to the non-linear interactions between drivers). This partitioning of the sum of squares is computed each year for the ensemble of scenarios. It gives the fraction of variance explained by each uncertainty driver at each time step.
4. Results
Here we present results for Europe, one of the regions represented in the Imaclim-R model. First, we describe the evolution of all the indicators over the course of the present century. In the first line of Figures 2, 3 and 4 each line represents one scenario, i.e. one combination of the different assumptions under consideration. The dispersion of each indicator was evaluated by the relative standard deviation (RSD). This analysis revealed significant differences in the values of some indicators depending on the future considered. An indicator even improves over time in some scenarios but deteriorate in other scenarios. Second, we focused on the most dispersed indicators for which more than one driver explains the variability. An analysis of variance was conducted to identify the uncertainty drivers that contribute the most to this dispersion. We then discuss the results obtained.
4.1. The evolution and dispersion of the indicators
Here we analyze the different sets of indicators that highlight a specific energy security perspective. Figure 2 presents the indicators of the sovereignty perspective. All the indicators were calculated such that an increase (respectively a decrease) in their value indicates a worsening (respectively an improvement) in the dimension of energy security they measure. The RSD allowed us to assess whether an indicator varied a lot, or a little in the different scenarios.24 In other words, it evaluated the degree of
uncertainty of the indicator across the scenarios considered. Variability can also change over time.
13
Figure 2: Evolution and dispersion of the indicators of the sovereignty perspective Sovereignty perspective
TPES:
Share of imports in TPES
Primary fuels: Regional import dependence
Electricity:
Share of imports for power generation
Evolution of the indicator Relative standard deviation (%)
14
The sovereignty perspective refers to threats posed by external actors and the exposure of a region/ country to these threats (Cherp and Jewell, 2011). This is apprehended by different indicators based on the share of imports used for the functioning of the three energy systems analyzed. Figure 2 shows that the indicators of the sovereignty follow similar trends. This result is not surprising because these three indicators are related since all have some links to imports of fossil fuels. However, the indicator for electricity exhibits higher variability than the two others.
For TPES and primary fuels, in all scenarios there is a first phase of worsening of the indicator, then a trend reversal between 2025 and 2035, followed by an improvement of the indicator in the long term. The date of the trend reversal and the speed of the subsequent improvement vary across scenarios. The short-term worsening is due to carbon pricing triggering substitutions away from (mainly domestic) coal towards (mainly imported) gas. The long-term improvement is due to higher market penetration of renewable energies, as well as by the penetration of CCS technologies that enable the use of domestic coal with low emissions. These results reveal that the implementation of ambitious climate policies in Europe initially worsens these indicators compared to 2000, irrespective of the combination of assumptions envisaged. After around 2040, the indicators improve, with less reliance on imports in some scenarios, whereas the indicators are still worse in other scenarios. Moreover, in a few scenarios, the dependence on imports remains higher than in 2000 until the end of the study period, 2075. As shown by the RSD, the spread across scenarios increases over time. At the end of the simulation period, the ratio of the standard deviation to the mean is around 20% for both the systems.
For the electricity system, two groups of scenarios can be distinguished. One group follows the same trend as that described for TPES and primary fuels. The other group is not subject to the first phase of worsening of the indicator, but follows a relatively flat, or slightly improved, trajectory until 2030. The intensity of the use of renewable energies in the medium term explains this difference: when the use of renewable energies is high, market penetration by gas powered plants limits associated imports of gas. The improvement of this indicator happens earlier than for the other systems studied. As early as 2030, in some scenarios, the reliance on imports to produce electricity in Europe is reduced, compared to the situation at the beginning of the century. Moreover, at the end of the simulation period, the indicator is improved in all the scenarios. Like the other systems, except for a short period around 2050, the variability of the indicator across scenarios increases over time. But the RSD of the simulated values is higher for this indicator than in the two other systems. Moreover, this energy carrier should play an increasing importance from the medium-term. This confirms the importance of understanding which drivers explain this variability.
15
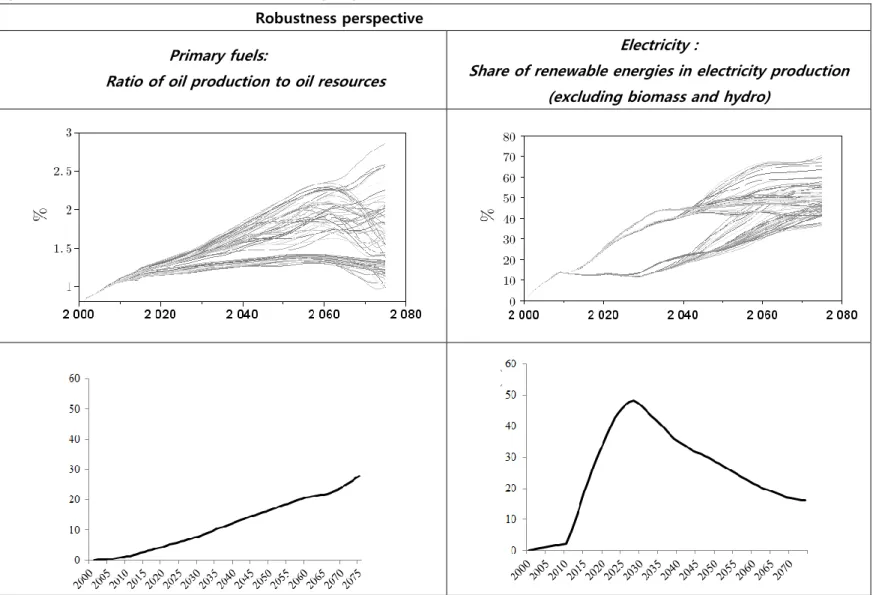
Figure 3: Evolution and dispersion of the indicators of the robustness perspective Robustness perspective
Primary fuels:
Ratio of oil production to oil resources
Electricity :
Share of renewable energies in electricity production (excluding biomass and hydro)
Evolution of the indicator
Relative standard deviation
16
The robustness perspective refers to threats related to technical factors, such as scarcity of resources, aging of infrastructure or technical failures. The indicators selected to apprehend this perspective deal with the availability of the oil resource compared to production, and a technology used to produce electricity but regularly questioned, in particular given the risk of major accidents.
Figure 3 shows that the ratio of oil production to oil resources worsens continuously over time until around 2060 in all the scenarios. However, the speed of degradation varies across the scenarios. The indicator remains relatively flat in some scenarios, but increases substantially in others. This reveals that, although ambitious, the climate policies will not prevent the worsening of the ratio of oil production to oil resources for several decades. This indicator is not specific to Europe; the result applies to the whole world. After 2060, there is an improvement in some scenarios but the situation remains worse than at the beginning of the century. The improvement happens because, in some scenarios, extraction of oil is sufficiently slowed down by climate policy to counter-balance the effect of depletion. As shown by the RSD, the spread across scenarios increases over time. At the end of the simulation period, the ratio of the standard deviation to the mean is around 30%.
For electricity, two groups of scenarios can be distinguished, even though the indicator is degraded in both (i.e. the share of intermittent renewable increases over time in both). These two groups correspond to the two alternatives on the availability of low-carbon power generation technologies. In the “low” alternative, the penetration of renewable energies is slow and takes-off only after 2030, whereas in the “high” alternative, the penetration of renewable energies is faster and they reach roughly 50% of electricity production in 2040.
17
Figure 4: Evolution and dispersion of the indicators of the resilience perspective Resilience perspective
TPES: Energy intensity of GDP
Primary fuels: Concentration of oil markets
Electricity:
Concentration of primary energy sources used in electricity production
Evolution of the indicator Relative standard deviation (%)
Note: The values for the two Herfindahl-Hirschmann indexes measuring the concentration of oil markets and the concentration of primary sources for electricity production cannot be directly compared, because the values of the index depends on the number of categories in the aggregation (12 regions for the index measuring the concentration of oil markets, 7 categories of primary sources for the index measuring the concentration of primary sources for electricity production).
18
From the resilience perspective, the future is considered to be unpredictable. This future uncertainty may be related to markets, technologies and societies. The indicators aim to characterize the exposure, adaptability, or diversity of energy systems with respect to different known and unknown threats (Cherp and Jewel, 2011). Figure 4 shows that the trends of the indicators of the resilience perspective vary between vulnerable systems and among the scenarios.
For TPES, the energy intensity of GDP is improved over time in all the scenarios. Carbon pricing accelerates the historical trend of a decrease in energy intensity over time. The speed of the improvement varies between scenarios, and ranges from a 1.6%/yr to a 2.7%/yr decrease in energy intensity between 2015 and 2075. The RSD increases over time to reach almost 25% at the end of the study period.
Concerning primary fuels, the concentration of oil markets follows approximately the same trajectory in most scenarios: first, the concentration increases until approximately 2030, then decreases for two to three decades before beginning another long term increase. The short-term increase is due to carbon pricing which excludes unconventional oil producers from the market, after which the markets are diversified, and partly because CCS allows some unconventional oil producers to enter the market, partly because depletion of conventional resources decreases the market shares of conventional producers. In the long-term, the oil markets again become concentrated because of the depletion of conventional resources. The trajectories are very similar in all the scenarios, and the RSD remains below 4% throughout the study period.
The evolution of the diversity of primary energy sources used in electricity production differs considerably among the scenarios. In some, the indicator improves from 2011 on, whereas in others it deteriorates. These differences remain high over time. The RSD reaches a peak of approximately 35% around 2040. From 2060 on, the trajectories are less chaotic but dispersion among the scenarios remains high.
To summarize, the evolution of energy security dimensions in a low-carbon world are varied and complex. The conclusion depends on the indicator examined but also on the time horizon considered. Moreover, the dispersion of some indicators is substantially higher than that of others. In the following, we analyze which uncertainty drivers explain this dispersion.
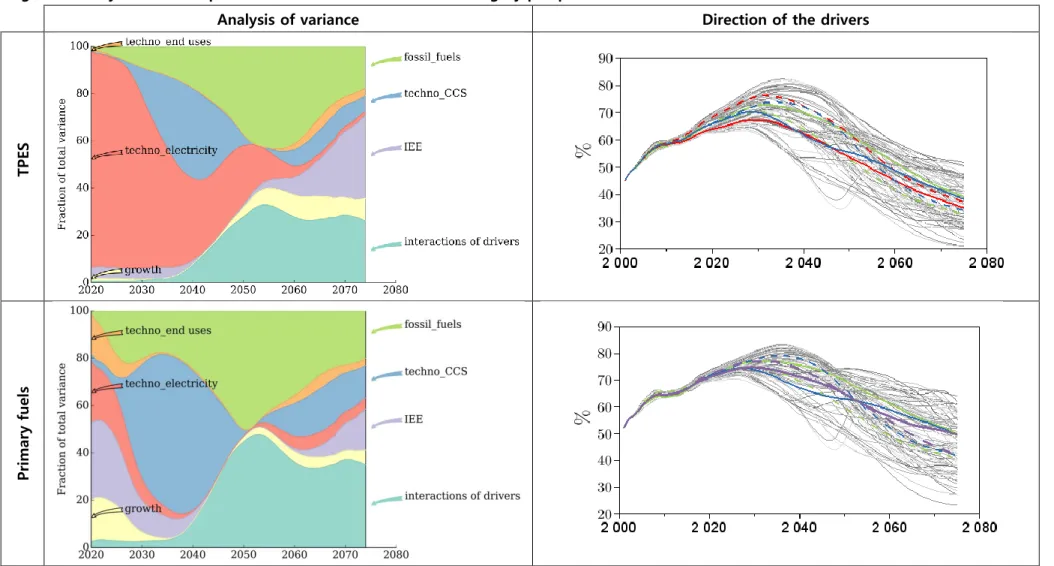
4.2. Contribution of the different determinants
Our objective was to identify the main factors behind the dispersion of the indicators. We focused on those characterized by the highest variability. Consequently we excluded the indicator of the resilience perspective for primary fuels whose RSD peaked at 4%.
A first group of indicators was characterized by some variation across the scenarios, but this variation is almost entirely explained by a single assumption. Figure 5 shows the result of the ANOVA for the ratio of oil production to oil resources and the share of renewable energies in electricity production (excluding biomass and hydro). Both the indicators are related to the robustness perspective.
19
Figure 5: Analysis of variance Indicators of
robustness perspective Contributions of the six different potential drivers
Ratio of oil production to oil resources
Share of renewable energies in electricity production (excluding biomass and hydro)
Notes: The graphs show the contributions of each driver to the total uncertainty of the energy security indicator over time. A different color is used for each type of driver: red for low carbon power generation technologies, blue for CCS technologies, orange for low carbon end-use technologies in the transport and residential sectors; purple for induced energy efficiency (IEE), green for fossil fuel resources and markets, and yellow for economic growth.
The dispersion of the ratio of oil production to resources is mainly explained by the assumption concerning the fossil fuel resources and markets. Logically, the indicators worsen over time in the scenarios with a ”low” assumption for fossil fuels, but remain stable in the scenarios with the alternative assumption. In the second case, the climate policies reduce the production required to satisfy world demand.
Concerning the share of renewable energies in the production of electricity, dispersion is mainly due to the assumption concerning power generation technologies. Logically, the scenarios based on the “high” assumption, characterized by low cost and a high potential market share for renewable energies, indicate greater capacities. Renewable energies improve the energy independence in Europe, but the inclusion of
20
large amounts of intermittent energy makes managing the electricity network more complex. From the robustness perspective, energy security is thus degraded.
Concerning the remaining indicators, we now analyze the factors that contribute to the variations among the scenarios in more detail. Indicators of the robustness perspective are no longer included. Figures 6 and 7 present the contributions of each driver to the total uncertainty surrounding the energy security indicator (second column) over time. The evolution of the indicator is shown again to show the “direction” of the effect of each determinant. Only the three drivers that contribute most to the variance of the indicator are included. The solid line represents the average of the indicator across the subset of scenarios based on the “high” assumption; the dashed line represents the average of the indicator across the subset of scenarios based on the “low” assumption. Table 2 is a reminder of the meaning of the “low” and “high” assumptions with their corresponding color in Figures 6 and 7.
Table 2: The “low” and “high” assumptions for the six drivers considered
Determinants Assumptions and corresponding color
Low Color code High Color code
Power generation technologies
Low availability
Slow learning Dashed red
High availability
Fast learning Solid red Carbon capture
and
sequestration
Low availability
Slow learning Dashed blue
High availability
Fast learning Solid blue End-use technologies Low availability Slow learning Dashed orange High availability
Fast learning Solid orange
IEE Slow Dashed purple Fast learning Solid purple
Fossil fuels resources and markets
Scarce/expensive Dashed green Abundant /cheap Solid green
Economic growth Slow leader productivity growth Slow productivity catch-up Dashed yellow Rapid leader productivity growth Rapid productivity catch-up Solid yellow
21
Figure 6: Analysis of the dispersion of the indicators of the sovereignty perspective
Analysis of variance Direction of the drivers
TPES Pr im ary fu el s
22 El ec tr ic ity
23
Figure 6 shows the results of the three indicators of the sovereignty perspective. They reveal that the three indicators share two main drivers. Indeed, the assumptions concerning CCS technologies and fossil fuels have a significant effect on all three indicators. The third determinant is the assumption concerning power generation technologies for the indicators on TPES and electricity, whereas the determinant is the assumption concerning IEE for the indicator on primary fuels. Nevertheless, the evolution of these drivers over the century differs among the indicators. For the share of imports in TPES and in power generation, the assumption concerning power generation technologies explains a large proportion of the variation among the scenarios. This driver is particularly important in the short and medium term, but its importance declines in the long term, especially for the share of imports in TPES. For both indicators, the “high” assumption leads to a significant improvement in energy security. The explanation for this result is that “high” availability of low-carbon power generation technologies leads to faster penetration of renewable energies, which limits the imports of gas and diversifies the power generation mix. From around 2050 on, this assumption explains the dispersion of the results for the share of imports in TPES to a lesser extent, whereas the assumptions concerning fossil fuels and IEE play a bigger role.
The assumption concerning CCS technologies is also an important driver of the uncertainty in the results of the two previous energy systems but also of primary fuels. Nevertheless, the “direction” of its impact varies over time: around 2050, the blue dashed and solid lines intersect. In the short and medium term, a “high” assumption of CCS enables a lower share of imports in all the energy systems studied, because it uses relatively more (mainly domestic) coal and limits the penetration of gas and associated imports. In the long term, the “high” assumption concerning CCS allows more fossil fuel-powered generation to remain in the electricity generation mix, which has a negative impact on the share of imports.
Not surprisingly, the assumption concerning fossil fuels explains a large proportion of the dispersion of the results of the sovereignty perspective indicators, especially in the long term. For the three systems, (TPES, primary fuels and electricity), the “high” availability of fossil fuels has a negative effect: in this case gas prices are lower, which leads to higher imports of gas and more gas in the power generation mix.
The last significant determinant of the primary fuels indicators is the assumption concerning IEE, which plays a role especially in the short term. After 2040, this assumption is no longer discriminating across the scenarios. After 2065, the assumption again plays a role, but less important than at the beginning of the century. The “high” assumption concerning IEE leads to scenarios with lower European reliance on imports because higher efficiency limits the overall energy demand, including for primary fuels.
In the long term, interactions between individual uncertainty drivers explain a large proportion (up to 30% or 40%), of the variance of the indicators of the sovereignty perspective.
24
Figure 7: Analysis of the dispersion of the indicators of the resilience perspective
Analysis of variance Direction of the drivers
TPES El ec tr ic ity
25
Figure 7 gives the results for two indicators from the resilience perspective. Unlike the sovereignty perspective, the two indicators share no driver to explain their dispersion. Indeed, the assumptions concerning IEE, end use technologies and economic growth are the main drivers of the uncertainty of the concentration of primary energies in power generation, whereas the assumptions concerning power generation technologies, CCS technologies and fossil fuels contribute the most to variability of energy intensity across the scenarios.
The assumption concerning IEE is the main uncertainty driver of the energy intensity of GDP. This discriminatory effect continues to the end of the century. The “high” assumption leads to rapid improvement of energy efficiency and thus significantly decreases energy consumption in the region. In the long term, this assumption also becomes important for the share of imports in TPES, an indicator of the sovereignty perspective, because higher efficiency limits overall energy demand, which can then be more easily satisfied with domestic resources.
The assumption concerning end use technologies is important for the energy intensity of GDP in the short term. Logically, the “high” assumption reduces energy intensity faster.25 The share of the variation
across the scenarios is significantly due to end use technologies, especially in the short term.
Although more modest, the assumption concerning economic growth also explains some of the variance in energy intensity. Although small, the discriminatory effect lasts throughoutthe period. Greater economic growth improves the energy intensity of GDP. This is because faster growth leads to faster capital turnover and hence more rapid improvement in energy intensity.
The dispersion of the resilience indicator for the electricity system is explained by completely different drivers. Concerning the concentration of the power generation mix, the assumptions that play a distinguishing role are the same as for the sovereignty indicators for TPES and electricity, but the direction of some assumptions may nevertheless differ.
The assumption concerning power generation technologies plays the most important role in explaining the dispersion among the scenarios over the course of the century. This differs from the result concerning the share of imports in TPES and in power generation, for which the assumption shifts the evolution of the indictors especially in the short and medium terms. Here again, the “high” availability of low-carbon power generation technologies leads to faster penetration of renewables, which limits the imports of gas and diversifies the power generation mix.
The assumption concerning CCS technologies is a significant driver of the variation across the scenarios but there is a major difference in the results compared to the sovereignty indicators. Indeed, for the concentration of the power generation mix, the “high” assumption on CCS has a negative impact in the short and medium term because it limits the penetration of renewable energies, thus limiting the diversification of the mix. In the long term, the “high” assumption concerning CCS becomes positive for
25 Note that, in the long term, “high” end-use technologies can have a negative effect on the share of imports for power generation,
an indicator of sovereignty, because they enable to higher penetration of electrified vehicles thereby increasing the demand for electricity, which is met by power generation technologies that require imports of fuel. This result could differ if “smart-grid” options were included in the modeling framework.
26
the diversity of the mix (i.e. it decreases the concentration of the power generation mix), because it allows more fossil fuel-powered generation to remain in the mix.
Lastly, the assumption concerning fossil fuels explains a rather modest proportion of the dispersion of the results for the concentration of the power generation mix. The assumption is most discriminating in the short term. The effect of “high” availability of fossil fuels is negative, because it reduces the cost of generation of fossil fuels (including with CCS) and thus limits the penetration of renewable energies that diversify the generation mix.
5. Discussion and conclusion
This analysis focused on Europe advances our understanding of the evolution of energy security in a low-carbon world. We identified the uncertainty drivers that explain the dispersion of the energy security indicators. As a result, we were able to identify levers that could limit the degradation of energy security if ambitious climate policies are implemented.
Our results show that the evolution of some indicators can be highly contrasted across the scenarios and over the course of the present century. The indicators for the electricity system exhibited the highest dispersion. Particular attention should be paid to this energy carrier so as not to damage European energy security too much when implementing significant reductions in CO2 emissions. Our results show
that several uncertainty drivers play a crucial role in the evolution of these indicators. Logically, the cost and availability of the low carbon power generation technologies have a major effect on the dynamics of the indicators. If the “low” assumption concerning these technologies turns out to be true, European reliance on imported fuels for power generation and the concentration of primary energy sources in power generation would deteriorate significantly and rapidly, whereas the robustness of the system would be improved. Although less important, the cost and availability of the CCS technologies also affect the evolution of the indicators of the electricity system, but this driver plays a different role depending on the indicator concerned. If the “high” assumption on these technologies turns out to be true, the sovereignty of the system would be significantly improved, whereas its resilience would be degraded during the first half of the century. Indeed, strong diffusion of the CCS technology would reduce the share of imports thanks to increased use of coal, but would limit the penetration of renewables. In the long term, the effect would be reversed. This last result reveals a possible contradiction between the deployment of CCS technologies and that of renewables.
Concerning the other energy systems, we also found significant, but less, dispersion of the indicators. The results for TPES are the most interesting. The uncertainty drivers that contribute strongly to the variance of the results for sovereignty are the same as those for the electricity system. On the other hand, the resilience of TPES depends on completely different drivers. The one that contributes the most is induced energy efficiency.
Finally, the paper shows that the European double target of significantly decreasing CO2 emissions and
increasing the security of the supply of energy may be difficult to reach. Nevertheless, some levers could facilitate the transition to a low-carbon society by improving energy security, or limiting its degradation. Indeed, our results emphasize the importance of policies in favor of low or zero carbon technologies in
27
power generation, but also the differences in their contributions to the complete uncertainty of the indicators. Policies promoting energy efficiency also play a role but only in the resilience of TPES. These policies are thus important levers for mitigating the negative impacts of climate policies on energy security. It would be interesting to complete this analysis by focusing on specific uncertainty drivers and distinguishing between the different technologies (e.g. renewables and nuclear energy) or fossils fuels.
6. References
APERC, Asia Pacific Energy Research Centre, 2007. A Quest for Energy Security in the 21st Century: Resources and Constraints. Institute of Energy Economics, Japan.
Bibas, Ruben, Aurélie Méjean and Meriem Hamdi-Cherif, 2014. Energy efficiency policies and the timing of action: an assessment of climate mitigation costs. Technological Forecasting and Social Change, 90, Part A, 137-152.
Cherp, Aleh, and Jessica Jewell, 2011. The three perspectives on energy security: intellectual history, disciplinary roots and the potential for integration. Current Opinion in Environmental Sustainability, 3 (4), 202-212.
Cherp, Aleh, Adenikinju Adeola, Goldthau Andreas, Hernandez Francisco, Hughes Larry, Jansen Jaap C., Jewell Jessica, Olshanskaya Marina, de Oliveira Ricardo Soares, Sovacool Benjamin K., and Vakulenko Sergey, 2012. Energy and security. In: Global Energy Assessment: Toward a More Sustainable Future. Cambridge University Press, Cambridge, UK and New York, NY, USA and the International Institute for Applied Systems Analysis, Cambridge University Press, Laxenburg, Austria, pp. 325–383 (Chapter 5).
Cherp, Aleh, and Jessica Jewell. 2013. Energy security assessment framework and three case studies. In: International Handbook of Energy Security. Chapter 8, Edward Elgar Publishing, 146-73.
Cherp, Aleh, Jessica Jewell, Vadim Vinichenko, Nico Bauer and Enrica De Cian, 2013. Global Energy Security under Different Climate Policies, GDP Growth Rates and Fossil Resource Availabilities. Climatic Change, 121 (1), doi: 10.1007/s10584-013-0950-x.
Dimaranan, B., and R.A. McDougall, 2006. Global Trade, Assistance and Production: The GTAP 6 Data Base. Center for Global Trade Analysis, Purdue University, West Lafayette.
DNV GL, Imperial College and NERA Economic Consulting, 2014. Integration of Renewable Energy in Europe, Report foe European Commission 9011-700, June.
European Commission, 2011. Energy Roadmap 2050. Communication from the Commission to the European Parliament, the Council, the European Economic and Social Committee and the Committee of the Regions, COM(2011) 885/2.
Guivarch, Céline, Stéphanie Monjon, Julie Rozenberg and Adrien Vogt-Schilb, 2015. Would climate policy improve the European energy security?, Climate Change Economics, 6(2), May, doi: 10.1142/S2010007815500086.
Jewell, Jessica, A. Cherp, V. Vinichenko, N. Bauer, Tom Kober, and D. L. McCollum, 2013. Energy security of China, India, the EU and the US under long-term scenarios: results from six IAMs. Climate Change Economics, Vol. 04, No. 04, 1340011.
28
Jewell, Jessica, Aleh Cherp and Keywan Riahi. 2014. Energy security under de-carbonization scenarios: An assessment framework and evaluation under different technology and policy choices. Energy Policy, 65, 743-760.
Krey, V., McCollum, D.L., Bottcher, H., Jewell, J., Johnson, N., Kolp, P. and Riahi, K., 2014. Chapter 6 - Assessing transformation pathways. In: Climate Change 2014: Mitigation of Climate Change. IPCC Working Group III Contribution to AR5. Cambridge University Press.
Le Quéré, Corinne, R. Moriarty, R. M. Andrew, J. G. Canadell, S. Sitch, J. I. Korsbakken, P. Friedlingstein, et al. 2015. Global Carbon Budget 2015, Earth System Science Data, 7: 349 96.
O’Neill, B. C., E. Kriegler, K. Riahi, K. Ebi, S. Hallegatte, T.R. Carter, R. Mathur and D.P. van Vuuren, 2014. A new scenario framework for climate change research: The concept of shared socioeconomic pathways. Climatic Change, 122(3), 387-400.
Quoc Hung Duong, Md Rakibuzzaman Shah, N. Mithulananthan, 2016. Technical Challenges, Security and Risk in Grid Integration of Renewable Energy, Smart Power Systems and Renewable Energy System Integration, Volume 57 of the series Studies in Systems, Decision and Control, 99-118.
Rozenberg, J., C. Guivarch, R. Lempert and S. Hallegatte, 2014. Building SSPs for climate policy analysis: a scenario elicitation methodology to map the space of possible future challenges to mitigation and adaptation. Climatic Change, 122 (3), 509-522.
Saltelli, A., 2002. Sensitivity analysis for importance assessment, Risk Analysis, 22(3), 579‑90.
Schafer, A., and D.G. Victor, 2000. The future mobility of the world population. Transportation Research, Part A, 34 (3), 171–205.
Waisman, H., C. Guivarch, F. Grazi and J.-C. Hourcade, 2012. The Imaclim-R model: infrastructures, technical inertia and the costs of low carbon futures under imperfect foresight. Climatic Change, 114 (1), 101–120.