S1
Supporting information
Cellular Delivery of Plasmid DNA into Wheat Microspores using Rosette Nanotubes
Authors
Jae-Young Chob, Pankaj Bhowmikc, Patricia L. Polowickc, Sabine G. Dodarda, Mounir
El-Bakkarib, Goska Nowakc, Hicham Fennirib,d,* and Usha D. Hemraza,b,*
aAquatic and Crop Resource Development, National Research Council of Canada, 6100
Royalmount Avenue, Montreal, QC, H4P 2R2
bNanotechnology Research Centre, National Research Council of Canada,
11421 Saskatchewan Drive, Edmonton, Alberta, Canada, T6G 2M9
cAquatic and Crop Resource Development, National Research Council of Canada, 110
Gymnasium Place, Saskatoon, SK, S7N 0W9
dDepartments of Chemical, Biomedical Engineering, Chemistry and Chemical Biology,
Table of Contents Microscopy procedures General methods S3-S4 Gel electrophoresis S4-S5 Microscopy S6-S8
Vector map of mCherry plasmid DNA S9
S3 Microscopy procedures
Sample preparation for microscopy. Scanning electron microscopy (SEM) and
transmission electron microscopy (TEM). Samples were prepared by depositing a drop of
the solution on carbon-coated 400-mesh copper grids for 10 s and the grid was blotted using filter paper. The staining of samples was performed by depositing one drop of uranyl acetate (2% in water) for 120 s each. The grid was then blotted and air-dried.
Atomic force microscopy (AFM). An aliquot of sample (5µL) was deposited on freshly
cleaved mica surface using a spin coater (2500 rpm). The sample was air-dried prior to imaging.
Bio-science AFM. An aliquot of sample (5µL) was deposited on glass cover slide and then
dried in air, prior to imaging.
Microspore imaging. Microspore samples were deposited on carbon tape and the backside
of 400 meshed TEM grids with poly-L-lysine (PLL) treatment and analyzed using environmental scanning electron microscope (ESEM) and in-solution AFM.
Microscopy characterization. SEM and STEM. All SEM (scanning electron microscopy) images were obtained with/without negative staining (unless indicated otherwise), at accelerating voltage of 30 kV, operating current of 20 µA and a working distance of 5-8 mm on a high resolution Hitachi S-4800 cold field emission SEM.
SEM imaging of wet microspore. A wet microspore sample was analyzed by an
environmental scanning electron microscope (ESEM) Hitachi S-3000N. SEM images were obtained at 1-10 kV accelerating voltage, 10 A and low vacuum (110 Pa).
TEM. TEM imaging was performed on a JEOL 2200 FS - 200kV Schottky field emission
instrument, equipped with an in-column omega filter. Bright field TEM images were acquired using energy filtered zero loss beams (slit width 10 eV).
AFM imaging. AFM of the sample surface was performed using a Digital
Instruments/Veeco Instruments MultiMode Nanoscope IV AFM equipped with an E or J scanner. Silicon cantilevers (MikroMasch USA, Inc.) with low spring constants of 2-4.5 N/m were used in tapping mode (TM-AFM), along with in-solution AFM attachment. To obtain a clear image from the surface, a low scan rate (0.5-1 Hz) and an amplitude setpoint
(1 V) were chosen during measurement. For Bio-Science AFM, a combination of an inverted microscope (Nikon) and AFM (JPK NanoWizard II) were used with 2 N/m, 70 kHz, tetrahedral tip. This equipment allows imaging similar to a conventional AFM instrument as well as visualization of the fluorescent images simultaneously.
Gel electrophoresis
Materials and methods for agarose gel electrophoresis
The 1% agarose gels were prepared using ultrapure agarose and stained using SYBR safe, both of which were purchased from Life Technologies. The loading dye GelPilot 239901 and GeneRuler SM0333 were purchased from Quiagen and Thermofisher Scientific, respectively. The 1 x TAE buffer was prepared upon dilution from concentrated 50x TAE from Biorad and was run for one hour at 100 V for each gel in the electrophoresis system Mini Sub cell GT (BioRad). DNase and RNase-free water was used throughout the experiment.
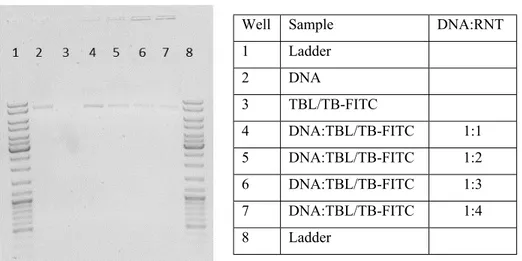
Determination of complexing ratios of DNA to RNTs
Figure S1: Gel retardation assay showing binding capacity of TBL/TB-FITC RNTs and circular mCherry DNA.
Well Sample DNA:RNT
1 Ladder 2 DNA 3 TBL/TB-FITC 4 DNA:TBL/TB-FITC 1:1 5 DNA:TBL/TB-FITC 1:2 6 DNA:TBL/TB-FITC 1:3 7 DNA:TBL/TB-FITC 1:4 8 Ladder
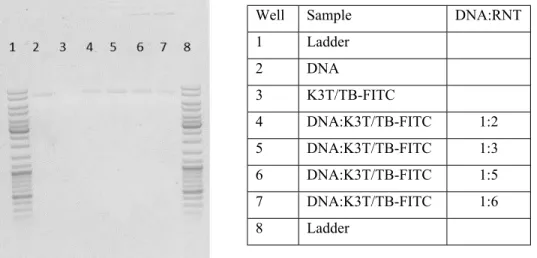
S5 Figure S2: Gel retardation assay showing binding capacity of K3T/TB-FITC RNTs and circular mCherry DNA.
Release of DNA from RNT-DNA complex using dextran sulphate
Figure S3: Agarose gel electrophoresis upon complexation of plasmid DNA with RNTs and after decomplexation using dextran sulphate (DS): complexation time 15 min and decomplexation time 0.5 h (left); complexation time 15 min and decomplexation for 4.5 h (right)
Well Sample DNA:RNT
1 Ladder 2 DNA 3 K3T/TB-FITC 4 DNA:K3T/TB-FITC 1:2 5 DNA:K3T/TB-FITC 1:3 6 DNA:K3T/TB-FITC 1:5 7 DNA:K3T/TB-FITC 1:6 8 Ladder Well Sample 1 Ladder 2 DNA 3 DNA:TBL/TB-FITC 4 DNA:K3T/TB-FITC 5 DNA: DS 6 DNA:TBL/TB-FITC:DS 7 DNA:K3T/TB-FITC:DS 8 Ladder
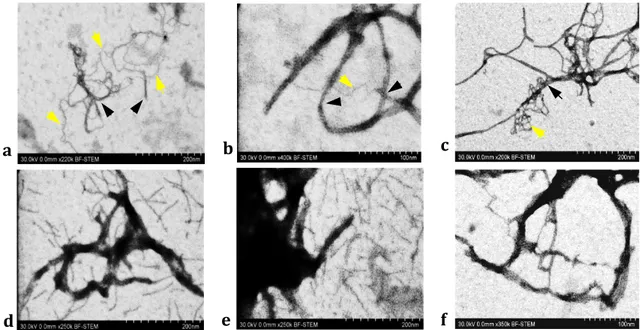
Microscopy STEM
Figure S4: High resolution bright field STEM images by Hitachi S-5500 cold field emission SEM: complexation by TBL/TB-FITC with (a) Extra-washed circular mCherry plasmid DNA, (b) mCherry DNA cassette and (c) Linear mCherry plasmid DNA. Complexation by K3T/TBL-TB-FITC with (d) Extra-washed circular mCherry DNA, (e) mCherry DNA cassette and (f) Linear mCherry DNA (black arrows show nanocarriers and yellow arrows show plasmid DNAs).
a b
d e
c
S7 Figure S5: (a) AFM of RNT-DNA complex, (b) height profile of RNT-DNA complex (3.5 ± 0.6 nm) (c) height profile of DNA only (1.0 ± 0.2 nm), (d) AFM of RNTs only and (e) height profile of RNTs only (2.6 ± 0.2 nm).
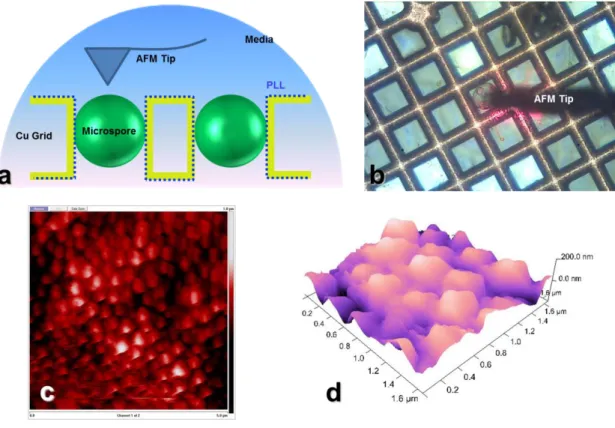
In-solution AFM of wheat microspores.
Figure S6: (a) Schematic diagram of immobilized sample in media for in-solution AFM, (b) optical image of microspore in media with AFM tip, (c) the details of microspore surface in media and (d) 3D surface image of microspore by in-solution AFM technique.
S9 Vector map of the mCherry plasmid DNA
Figure S7: Vector map of the mCherry plasmid DNA
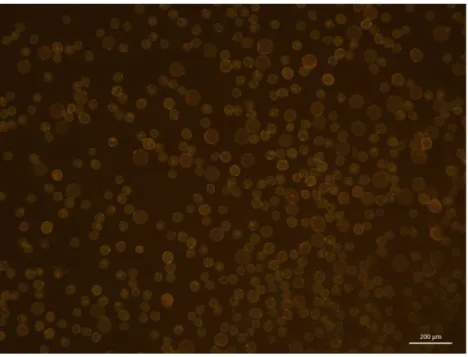
Figure S8: Non-transformed controlled wheat microspores, as observed and adjusted for background fluorescence using a Zeiss Axio Xoom V16 fluorescence microscope.