Version preprint
Short-, medium- and long-term metabolic responses of adult ewes submitted to 1
nutritional and β-adrenergic challenges 2
Eliel González-García1,a, Moutaz Alhamada1, Nathalie Debus1, Jean-Baptiste Menassol1,2, 3
Anne Tesnière1, Jéssica Gonçalves Vero3 , Bruna Barboza3 and François Bocquier1,2 4
1INRA UMR868, Systèmes d'Elevage Méditerranées et Tropicaux (SELMET), F-34000 5
Montpellier Cedex 1, France 6
2Montpellier SupAgro, Sciences Animales, Dept. MPRS, F-34000 Montpellier Cedex 1, 7
France 8
3Universidade Estadual de Londrina (UEL), Centro de Ciências Agrárias, Londrina, CEP 9
86057-970, Paraná, Brazil 10
aCorresponding author: eliel.gonzalez-garcia@inra.fr
1INRA UMR868, Systèmes d'Elevage Méditerranées et Tropicaux (SELMET), F-34000 Montpellier Cedex 1, 1 2 3 4 5 6 7 8 9 10 11 12 13 14 15 16 17 18 19 20 21 22 23 24 25 26 27 28 29 30 31 32 33 34 35 36 37 38 39 40 41 42 43 44 45 46 47 48 49 50 51 52 53 54 55 56 57 58 59
Version preprint
Abstract 11
Background: In order to maintain homeostasis, ruminants submitted to alternating shortage 12
and refeeding situations manifest switches in metabolic pathways induced by undernutrition 13
and body reserves (BR) replenishment cycles. The objective of this experiment was to study 14
adaptive regulatory mechanisms present during subsequent feeding transition periods and the 15
inherent lipolytic activity of the adipose tissue in individuals with contrasted BR. Three diets 16
containing different levels of energy were offered to 36 mature, dry, non-pregnant Mérinos 17
d’Arles ewes in an experiment lasting 122 days. Ewes were selected with similar body weight 18
(BW), body condition score (BCS) and were allocated into three equivalent treatments 19
according to the plane of nutrition: normally fed (Control); underfed (Under) or overfed 20
(Over). The BW, BCS and individual energy metabolism were monitored. At the end of the 21
experiment, lipolytic activity of adipose tissue was studied through a ß-adrenergic challenge 22
to the same ewes, with body conditions according to the offered diet (Normal, Leans and 23
Fat, respectively). 24
Results: Anabolic or catabolic responses to energy dietary manipulation were accompanied 25
by synchronised metabolic regulation, leading to contrasting metabolic and BR profiles. 26
Average BW and BCS were higher and lower in Over and Under ewes, respectively. The 27
higher and lower BR variations were observed for Under and Over ewes. Higher plasma non-28
esterified fatty acids (NEFA) concentrations were accompanied by lower insulin, leptin and 29
glucose. Differences in leptin were consistent with the dietary energy load (Over > Control > 30
Under). After refeeding, a rebound in BW and BCS was observed for the three groups 31
whereas NEFA was drastically reduced in Under ewes. No differences among treatments were 32
detected in NEFA profiles at the end of the study but lipolytic activity responses to the ß-33
adrenergic challenge were different and coherent with the adipose tissue mass (Fat > Normal 34 1 2 3 4 5 6 7 8 9 10 11 12 13 14 15 16 17 18 19 20 21 22 23 24 25 26 27 28 29 30 31 32 33 34 35 36 37 38 39 40 41 42 43 44 45 46 47 48 49 50 51 52 53 54 55 56 57 58 59
Version preprint
> Lean) and, importantly, was also different between ewes from the same group or BR status, 35
thus evidencing diversity among individual adaptive capacities. 36
Conclusions: The ability of ewes to quickly overcome undernutrition situations by efficiently 37
using their BR was confirmed. There is potential for a simplified ß-adrenergic challenge 38
protocol helping to identify differences in adaptive capacity among individuals. 39
Keywords: Sheep; Undernutrition; Metabolic profile; Energy balance; Body reserves; 40
Adipose tissue; Lipolytic activity; Adaptive capacity. 41
42
Background 43
Maintaining the consistency of the internal environment (homeostasis) and/or sustaining 44
productive functions (homeorhesis) are essential mechanisms of control in ruminants, 45
allowing them to adapt to physiological and environmental fluctuations [1]. 46
How the animal partitions its nutrients when resources are limited, or imbalanced, is a 47
major way in which it is able to cope with such variations, and thus, determines its robustness. 48
In highly productive selected ruminants there is evidence that their reliance on body reserves 49
(BR) is increased and robustness is reduced [2]. The efficiency of BR mobilisation-accretion 50
processes, in order to overcome undernutrition events, is therefore recognised as an essential 51
trait in ruminants. These processes contribute to maintaining the resilience of the flock under 52
fluctuating circumstances, such as in tropical or Mediterranean regions, where seasonal forage 53
availability is highly contrasted. 54
In previous works characterizing the energy metabolism in a typical round productive 55
year of Romane [3] and Lacaune [4] meat and dairy ewes, respectively, the potential of 56
plasma non-esterified fatty acids (NEFA) for being used as predictor of the ruminant 57
nutritional status was confirmed. Furthermore, we know that adipose tissue (AT) lipolytic 58
potential can be estimated in vitro (by glycerol and NEFA responses from tissue explants into 59 1 2 3 4 5 6 7 8 9 10 11 12 13 14 15 16 17 18 19 20 21 22 23 24 25 26 27 28 29 30 31 32 33 34 35 36 37 38 39 40 41 42 43 44 45 46 47 48 49 50 51 52 53 54 55 56 57 58 59
Version preprint
the incubation medium) or in vivo by plasma glycerol or NEFA response to injection or 60
infusion of catecholamines or synthetic drugs (β-adrenergic agonists) [5]. Such lipolytic 61
potential could be seen as a sight of the ultimate necessity of the animal to compensate their 62
basic requirements by using their BR. When facing an undernutrition event, a quick BR 63
mobilization (illustrated by plasma NEFA) could be a symptom of the incapacity of the 64
animal to re-adjust its maintenance energy requirements (MER) which would lead to regulate 65
(reduce) its feed intake. Under the same conditions (i.e. species, breed, physiological state, 66
age, production system, feeding regimen…) less NEFA in the immediate response would 67
means that the animal is less depending from its BR in the very short term. 68
For this study we hypothesised that offering restricted diets to adult Mérinos d’Arles 69
ewes would significantly increase their BR mobilization to meeting their MER. After 70
refeeding, the metabolic plasticity of the breed [6,7,8] would lead to recovery within a similar 71
period of time to that of feed restriction. We also hypothesised that those ewes with contrasted 72
body condition scores (BCS), resulting from receiving different dietary regimes, would 73
respond differently to an in vivo β-adrenergic challenge. That response will correspond to the 74
individual reactivity or adaptive capacity. 75
Thus, the objective of this study was to evaluate the impact of offering diets of differing 76
nutritional planes on the adaptive capacity of mature ewes at the short-, medium- and long-77
term. Such adaptation will be characterized by studying trends in the individual BR 78
mobilisation-accretion and the associated metabolic profiles after dietary challenge. A second 79
objective was to evaluate the impact of different BCS on the individual lipolytic potential of 80
the adipose tissue of the ewes facing a β-adrenergic challenge. This would allow us to study 81
the potential of a simplified method for analysing the intraflock variability in individual 82
metabolic plasticity responses when facing nutritional alias. 83 84 1 2 3 4 5 6 7 8 9 10 11 12 13 14 15 16 17 18 19 20 21 22 23 24 25 26 27 28 29 30 31 32 33 34 35 36 37 38 39 40 41 42 43 44 45 46 47 48 49 50 51 52 53 54 55 56 57 58 59
Version preprint
Methods 85
Location 86
The experiment was conducted at the Montpellier SupAgro Domaine du Merle 87
experimental farm, located in Salon-de-Provence in the south-east of France (43°38’N, 88
5°00’E). All animals were cared for in accordance with the guidelines of the Institut National 89
de la Recherche Agronomique (INRA) animal ethics committee. 90
Ewes, management, feeding and experimental design 91
After weaning their litters in mid-January, 36 adult Mérinos d’Arles ewes between 6 and 92
10 years old and being lambed in October (average lambing on 10 October) were selected for 93
this study from the main research flock. The body weight (BW) and BCS was used to select 94
animals with similar body conditions. The initial BW and BCS were 44.4 ± 0.83 kg and 2.0 ± 95
0.05, respectively. 96
A schematic representation of the experimental design is presented in Figure 1. The 97
experiment lasted 122 days, and was comprised of two consecutive periods. Firstly, the ewes 98
were allowed to acclimatise to the feeding regimen and the general environment of the 99
sheepfold for 22 days (under confinement). All ewes were managed as a single flock and fed 100
the same Control diet (composition included below) throughout this period. Following 101
acclimatisation was a measurement period of 100 days, beginning from the point at which the 102
experimental feeding regime began (day “zero”). Ewes were randomly assigned to one of 103
three covered pens, each with an area of approximately 30 m² and containing both concrete 104
and straw flooring in the same sheepfold. The 100 day measurement period was stratified into 105
two sub-periods of similar lengths (50 days each), including a dietary challenge period (from 106
day 0 to 49) followed by a refeeding period (from day 50 to 100; Figure 1). At the end of the 107
experiment (last day) a ß-adrenergic challenge protocol was carried out (details included 108 below). 109 1 2 3 4 5 6 7 8 9 10 11 12 13 14 15 16 17 18 19 20 21 22 23 24 25 26 27 28 29 30 31 32 33 34 35 36 37 38 39 40 41 42 43 44 45 46 47 48 49 50 51 52 53 54 55 56 57 58 59
Version preprint
Ewes were pen-fed and feed was allocated according to treatment to the three groups in 110
each of the covered pens (n = 12 ewes/ pen). The treatments included three contrasted diets of 111
different nutrition planes depending on energy supply: i) underfed ewes offered 70% of 112
theoretical MER (i.e. Under group), ii) ewes offered 100% of MER (i.e. Control group) and 113
iii) ewes offered 160% of MER (i.e. overfed ewes, Over group). 114
At the start of the experiment, ewes were in a maintenance state. Considering the average 115
BW (~45 kg BW; 17.4 kg BW.75) the individual daily intake capacity was 1.3 fill units. 116
According to the INRA tables [9], in order to meet their MER 0.033 fill unit/kg BW.75 for 117
maintenance and meat production (UFV) and 2.3 g/ kg BW.75 of protein digestible in the 118
small intestine (PDI) was required. Therefore, feeding regimes for each treatment were 119
theoretically planned to achieve three different BCS of 1.75, 2.5 and 3.25 for Under, Control 120
and Over ewes, respectively. 121
The nutritive values of the ingredients included in the experimental diets are presented in 122
Table 1. As the basal roughage, a wheat straw containing 3.5% of crude protein (CP), 1.34 123
Mcal/kg dry matter (DM) of metabolisable energy (ME) and 2.4 UFV (INRA, 2010; [9]) was 124
used. Dried and pelleted alfalfa (16% CP) was offered as the main protein source, whereas a 125
dried and pelleted sugar beet pulp was supplied as the main energy source (2.7 Mcal/kg DM 126
of ME and 1.0 fill unit for sheep).A mineral-vitamin premix, containing 90 and 126 g/kg DM 127
of P and Ca, respectively, was supplied at the same dose (~10 g/ewe/day) for all treatments 128
(Table 2), thus, ensuring the same amount of P and Ca (1 g/ewe/day). 129
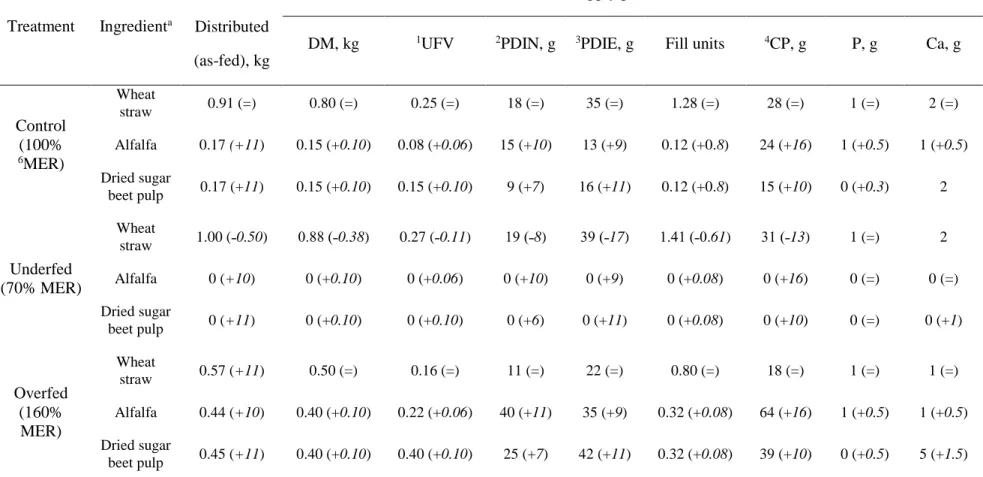
Table 2 presents the dietary composition for each experimental treatment, including the 130
amounts of each ingredient and the overall daily nutrient supply (per ewe), according to each 131
nutritional plane used in the study. The Control diet was composed of 910 g of wheat straw, 132
165 g of alfalfa and 170 g dried sugar beet pulp. For the Over group, the quantities of alfalfa 133
and sugar beet pulp were increased (almost tripled) compared to Control, whereas the quantity 134 1 2 3 4 5 6 7 8 9 10 11 12 13 14 15 16 17 18 19 20 21 22 23 24 25 26 27 28 29 30 31 32 33 34 35 36 37 38 39 40 41 42 43 44 45 46 47 48 49 50 51 52 53 54 55 56 57 58 59
Version preprint
of wheat straw was reduced by almost half. In contrast, the Under (feed-restricted) ewes were 135
offered only 1 kg of wheat straw daily. These experimental diets corresponded to the dietary 136
challenge period from day 0–49 following acclimatisation (Figure 1). During the second half 137
of the measurement period (refeeding), from day 50 to the end of the experiment (day 100), 138
an equivalent additional daily quantity (DM basis) of 100 g of alfalfa and 100 g of dried sugar 139
beet pulp per ewe were supplied to each of the three experimental groups. In this refeeding 140
period, the quantity of wheat straw supplied to the Under group was reduced to half of that 141
supplied during the 0 to 49 day measurement period (Table 2). 142
Ewes were group fed once daily at 0800 h, and diets were provided ad libitum, which was 143
weekly adjusted at 120% compared to the average intake for previous week. Feed refusals 144
were daily weighted and samples were weekly pooled for further analyses. Ewes in each 145
treatment group had free access to fresh drinking water. 146
The ß-adrenergic (isoprotenol) challenge 147
The contrasting BCS attained among groups at the end of the experimental period allowed 148
to induce a ß-adrenergic challenge to the thirty-six mature, dry, non-pregnant Mérinos d’Arles 149
meat ewes. The objective was to evaluate the lipidyc potential of the AT of the 3 contrasted 150
BCS groups i.e. normal ewes issued from the Control diet (Normal, n= 12), underfed or lean 151
ewes (Lean, n= 12) and overfed, fatty ewes (Fat, n= 12). The previous day of the β-152
adrenergic challenge the ewes were individually weighed and the BCS estimated. 153
All ewes (n = 36) were challenged early in the morning (~0800 h) of the same day (day 154
100). The challenge consisted on an intravenous injection (4 nmol/ kg BW) of isoproterenol 155
(ISO, IsuprelTM; Hospira France, 92360 Meudon-La-Fôret, France). IsuprelTM (0.2 mg 156
isoproterenol hydrochloride/mL sterile injection) is a potent nonselective β-adrenergic agonist 157
with very low affinity for α-adrenergic receptors. For individual monitoring of reactions, 158 1 2 3 4 5 6 7 8 9 10 11 12 13 14 15 16 17 18 19 20 21 22 23 24 25 26 27 28 29 30 31 32 33 34 35 36 37 38 39 40 41 42 43 44 45 46 47 48 49 50 51 52 53 54 55 56 57 58 59
Version preprint
blood samples (n= 10) were individually drawn from each ewe by jugular venipuncture at ˗15, 159
˗5, 0, 5, 10, 15, 20, 30, 45 and 60 min. relative to the β-adrenergic challenge time. 160
Measurements, blood sampling, hormones and metabolite assays 161
Measurements lasted a total of 122 days, starting with the acclimatisation period (22 days) 162
and continuing throughout the 100 day measurement period (Figure 1). Ewes were 163
individually and manually monitored for BW (n= 11) and BCS [10] at 28 and 11 days prior 164
to the experimental period (˗28 and ˗11, respectively), and at day 0, 6, 14, 21, 35, 49, 62, 77 165
and 97 after the beginning of the dietary challenge. Similarly, plasma samples for the 166
determination of metabolites and metabolic hormones associated with energy metabolism (n = 167
18) were taken at 22, 15, 11 and 1 day prior to the experimental period (˗22, ˗15, ˗11 and ˗1, 168
respectively), and at day 0, 1, 3, 6, 8, 10, 14, 17, 21, 35, 49, 62, 77 and 97 following the 169
beginning of the dietary challenge. 170
The close monitoring of ewes (every two or three days) started the day before the dietary 171
changes and lasted until 3 weeks after the beginning of the 100-day measurement period. 172
Following this, approximately two sampling points per month were performed until the end of 173
the experiment (see Figure 1 for details on the experimental design schedule). 174
For monitoring the energy metabolism progression of each experimental group, individual 175
concentrations of plasma metabolites, including non-esterified fatty acids (NEFA), beta-176
hydroxybutyrate (β-OHB) and glucose (GLU), and the metabolic hormones insulin (INS) and 177
leptin (LEPT) were determined according to the protocols described by González-García et 178
al. [3,4]. Blood samples were taken by jugular venipuncture before the first meal
179
(approximately at 0800 h) on each sampling day. Two 9 mL samples were drawn from each 180
ewe (1 tube with 18 IU of lithium heparin per 1 ml blood and 1 tube with 1.2–2 mg of 181
potassium EDTA per 1 ml blood; Vacuette® Specimen Collection System, Greiner Bio-One 182
GmbH, Austria). Samples were immediately placed on ice before centrifugation at 3600 × g 183 1 2 3 4 5 6 7 8 9 10 11 12 13 14 15 16 17 18 19 20 21 22 23 24 25 26 27 28 29 30 31 32 33 34 35 36 37 38 39 40 41 42 43 44 45 46 47 48 49 50 51 52 53 54 55 56 57 58 59
Version preprint
for 20 minutes at 4°C. The plasma was collected and stored at ˗20°C in individual identified 184
aliquots (3 µL) for the metabolite and hormone analyses. Plasma NEFA was measured in 185
duplicate using the commercially available Wako NEFA-HR(2) R1 and R2 kit (manufactured 186
by Wako Chemicals GmbH, Neuss, Germany, and distributed by Laboratoires Sobioda SAS, 187
Montbonnot, Saint Martin, France); intra- and inter-assay variations averaged 4.9% and 3.5%, 188
respectively. Plasma GLU concentrations were measured in triplicate using a commercially 189
available glucose GOD-PAP kit (reference LP87809; manufactured and distributed by 190
Biolabo SAS, Maizy, France); intra- and inter-assay variations averaged 2.5% and 2.1%, 191
respectively. Plasma β-OHB were measured in duplicate using the enzymatic method 192
proposed by Williamson and Mellanby [11]; intra- and inter-assay variations averaged 8.8% 193
and 3.3%, respectively. Plasma INS was measured in duplicate using a commercially 194
available RIA kit (Insulin-CT; manufactured by MP Biomedicals–Solon, Ohio, USA and 195
distributed by Cisbio Bioassays, Codolet, France); intra- and inter-assay variations averaged 196
10.3% and 4%, respectively. Plasma LEPT was quantified using the double-antibody leptin 197
RIA procedures with some modifications as described by González-García et al. [3,4]; 198
average intra- and inter-assay coefficients of variation were 5.4% and 4.8%, respectively. 199
For the ß-adrenergic challenge, the 9 mL blood samples (1 tube with 1.2-2 mg of 200
potassium EDTA per 1 ml blood) drawn from each ewe at each sampling point of the kinetic 201
(n = 10) were placed immediately on ice before centrifugation at 3,600 × g for 20 min at 4°C. 202
Plasma was harvested and stored at ˗20°C until analyses in individual identified aliquots (3 203
µL). Concentrations of plasma NEFA were analysed in duplicate, similarly to the procedure 204
above described. Intra- and inter-assay variation for these samples averaged 4.74% and 205
6.98%, respectively. 206
Calculation and statistical analyses 207 1 2 3 4 5 6 7 8 9 10 11 12 13 14 15 16 17 18 19 20 21 22 23 24 25 26 27 28 29 30 31 32 33 34 35 36 37 38 39 40 41 42 43 44 45 46 47 48 49 50 51 52 53 54 55 56 57 58 59
Version preprint
Statistical analyses were performed using Statistical Analysis System package (SAS; v. 208
9.1.3., 2002-2003 by SAS Institute Inc., Cary, NC, USA) [12]. Data were analysed using the 209
PROC MIXED function with repeated measures. The least square means separation procedure 210
using the PDIFF option in SAS was used and the statistical model was as follows: 211
Yijk = µ + Planei + Eweij + Timek + (Plane×Time)ij + εijk 212
where Yijk is the response at time k, for ewe j that consumed a diet at the nutritional plane i, 213
µ is the overall mean, Planei is the fixed effect of the specific nutritional plane i (i = 1–3), 214
Eweij is the random effect of ewe j offered the nutritional plane i, Timek is the fixed effect of 215
time k, (Plane × Time)ik is the fixed interaction effect of the nutritional plane i for time k and 216
εijk is the random error at time k on ewe j offered the nutritional plane i. 217
For the ß-adrenergic challenge database, the NEFA response at each time after challenge 218
was calculated as the change in concentration from basal (-15 min) value as described by 219
Chilliard et al. [13]. The area under the concentration curve (AUC) was calculated by doing a 220
definite integral between the two points or limits at time X, using the following formula: 221
AUC1-2 = (B1+B2) / 2 × (A2-A1) 222
where B is the y axis value (NEFA concentration) and A is the X axis value (time relative to 223
challenge). The AUC was thus calculated for each ewe for the time intervals 0 to 5 min 224
(AUC05), 5 to 10 min (AUC510), 10 to 15 min (AUC1015), 15 to 30 min (AUC1530), 30 to 225
60 min (AUC3060) and, finally, from 0 to 60 min (AUC060). 226
By using the data from the concentration-time plot, we calculated the NEFA elimination 227
rate (turnover) constant of each ewe after the ISO challenge (i.e. rate at which NEFA was 228
cleared from the body), assuming first order elimination. For this purpose we calculated K 229
which is the slope of the regression line between time (hours). The measured concentration 230
values of NEFA above the initial point (t = 0; time of injection of ISO) was firstly 231
transformed to their natural logarithm. Extrapolation at zero time gives the theoretical 232 1 2 3 4 5 6 7 8 9 10 11 12 13 14 15 16 17 18 19 20 21 22 23 24 25 26 27 28 29 30 31 32 33 34 35 36 37 38 39 40 41 42 43 44 45 46 47 48 49 50 51 52 53 54 55 56 57 58 59
Version preprint
maximal amplitude above initial point (NEFAamp). Since we did not have access to the 233
volume diffusion or volume of distribution (V) of NEFA, we used the individual BW of each 234
ewe to determine the clearance rate which was calculated as follows: 235
CL = K × BW 236
where CL is the NEFA clearance rate value from the body of each ewe, K is the slope of 237
the regression line and BW is the individual BW at the adrenergic challenge moment. 238
Data of NEFA kinetics in the β-adrenergic challenge were analysed as repeated measures 239
ANOVA using the PROC MIXED function with least squares means separation procedure 240
using the PDIFF option of SAS. The statistical model was as follows: 241
Yijk = µ + BCSi + Eweij + Timek + (BCS×Time)ij + εijk 242
where Yijk is the response at time k on ewe j with a BCSi, µ is the overall mean, BCSi is a 243
fixed effect of the BCS of the ewe at the moment of the challenge i (i = 1–3), Eweij is a 244
random effect of ewe j with a BCSi, Timek is a fixed effect of time relative to challenge k, 245
(BCS×Time)ik is a fixed interaction effect of the BCS of the ewe i with time relative to 246
challenge k, and εijk is random error at time k on ewe j with a BCS i. 247
The BW, BCS, NEFA responses after challenge with regard to basal NEFA and AUC at 248
different periods were analysed by ANOVA of SAS considering the fixed effect of the BCS 249
group of the observation value. Results were considered significant if P < 0.05. Correlation 250
coefficients between basal plasma NEFA and plasma NEFA responses to the ISO challenge 251
and AUC at different ranges of time and from time 0 to 60 min. were determined by using the 252
PROC CORR of SAS. 253
Results 254
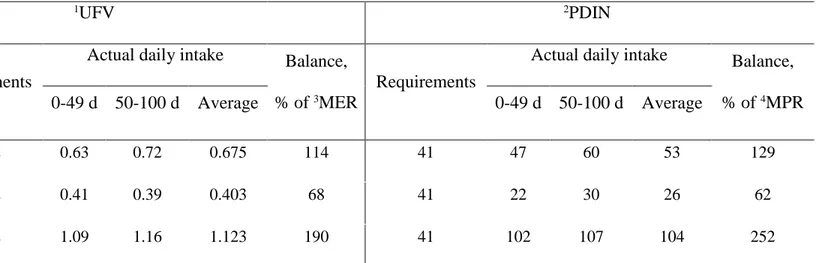
The final average individual daily feed balance is shown in Table 3. After calculating the 255
average feed refusal per treatment for each stage of the measurement period (dietary challenge 256
period from 0–49 days and refeeding period from 50–100 days), it was determined that the 257 1 2 3 4 5 6 7 8 9 10 11 12 13 14 15 16 17 18 19 20 21 22 23 24 25 26 27 28 29 30 31 32 33 34 35 36 37 38 39 40 41 42 43 44 45 46 47 48 49 50 51 52 53 54 55 56 57 58 59
Version preprint
ewes were 114, 68 and 190% of their MER for the Control, Under and Over groups, 258
respectively. This was different to the 100, 70 and 160% MER theoretically planned, 259
respectively (Table 2). However, the final objective of MER for each of the diets was 260
attained. 261
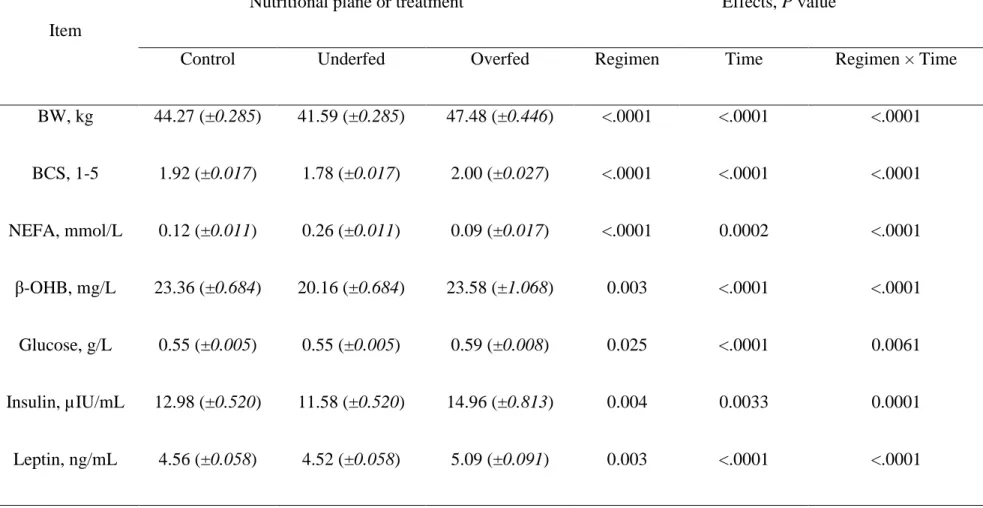
Overall changes in BW, BCS and plasma profiles are presented in Table 4. When all 262
parameters were considered, significant effects were observed for the main sources of 263
variation evaluated i.e. the feeding regimen, time after diet challenge and their first order 264
interactions. A high level of significance was observed for the interaction of nutritional plane 265
with time for all variables measured in this study. As expected, after beginning the feeding 266
regimen (day “zero”) the average BW and BCS were higher and lower, respectively, in the 267
ewes in the Over and Under groups (Table 4 and Figure 2). At the beginning of the refeeding 268
period (day 50) a significant recovery for BW and BCS was observed. 269
The differences and trends observed for BW and BCS were consistent with those obtained 270
for NEFA profiles (Figure 2). The higher and lower average BR mobilisation, as illustrated by 271
plasma NEFA concentration, were observed in the Under and Over group of ewes (0.26 ± 272
0.011 vs. 0.09 ± 0.017 mmol/L, respectively). However, the differences between the Over and 273
Control groups were only evident until 1 week following the change of the feeding regimen 274
(Figure 2). Once started the refeeding period, plasma NEFA was drastically reduced in the 275
Under ewes. At the end of the study, no significant differences were detected between the 276
groups of ewes, regardless of the feeding regimen (Figure 2). 277
Differences in GLU were only observed when the Over ewes were compared to the other 278
two experimental treatments. However, there were no differences observed when the Under 279
and Control ewes were compared (Table 4 and Figure 3). Conversely, plasma INS 280
concentrations were more consistent with the differences in BR mobilisation rates (i.e. NEFA 281
profiles) shown above. At higher plasma NEFA concentrations a lower INS concentration was 282 1 2 3 4 5 6 7 8 9 10 11 12 13 14 15 16 17 18 19 20 21 22 23 24 25 26 27 28 29 30 31 32 33 34 35 36 37 38 39 40 41 42 43 44 45 46 47 48 49 50 51 52 53 54 55 56 57 58 59
Version preprint
obtained. Therefore, plasma INS was higher in the Over ewes, followed by the Control ewes, 283
and was the lowest for ewes in the Under group (Table 4 and Figures 2 and 3). A 284
concomitant, parallel effect on INS and GLU was observed following refeeding. The peak in 285
GLU concentration observed in the Over ewes was followed by the observation of a similar 286
peak for the plasma INS profile at the same time point and in the same group of ewes. In 287
general, either the plasma GLU or INS profiles were higher in the Over ewes throughout the 288
experiment, but no differences were observed when the ewes offered the Control or Under 289
diets were compared (Figure 3). 290
No differences in ß-OHB concentrations were found when the Control and Over ewes were 291
compared (Table 4). A lower (P < 0.003) ß-OHB profile was observed in the Under ewes 292
compared to the average of Control and Over ewes combined (20.16 ± 0.684 vs. 23.47 ± 293
0.876 mg/L, respectively). The lower ß-OHB profile observed in the Under ewes was 294
consistent throughout the experiment (Figure 4). 295
Differences in plasma LEPT were also consistent with the feeding regimen (Over > 296
Control > Under; Table 4). As expected, a higher LEPT profile was observed in the Over 297
group throughout the experimental period, and these differences were significantly increased 298
following refeeding (Table 4 and Figure 4). 299
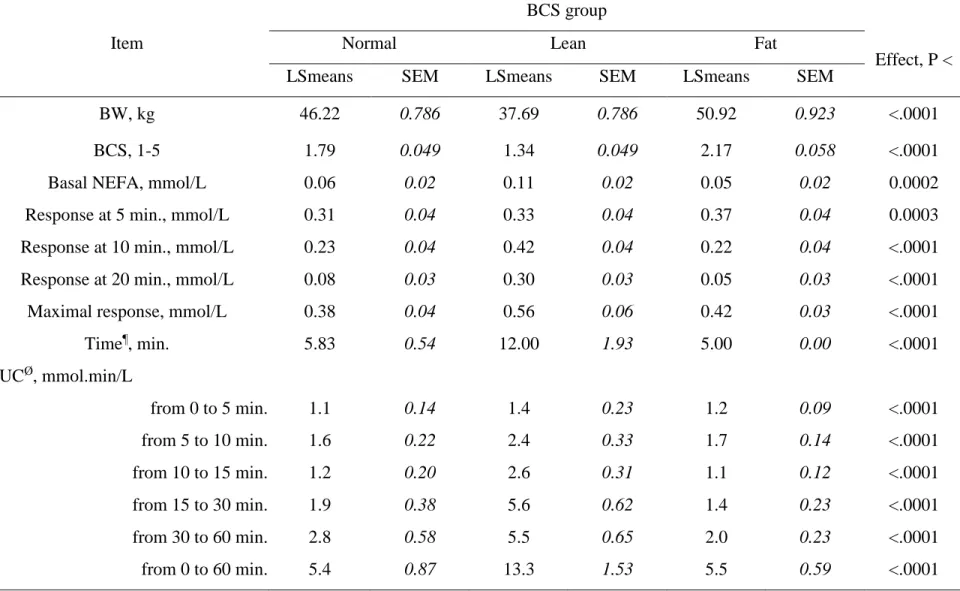
At the day of the ß-adrenergic challenge (end of the experiment), significant differences (P 300
< 0.0001) were verified when comparing average BW and BCS of the 3 experimental groups 301
(Table 5; Figure 5). As a result of the previous 100 days feeding manipulation period, ewes 302
belonging to the underfed (Lean) group (BW = 37.7 kg; BCS = 1.34) were more than 10 kg 303
lighter than Normal (BCS = 1.79) and overfed (Fat) (BCS = 2.17) ewes (46.2 and 50.9 kg 304
BW, respectively). 305
Basal plasma NEFA (–15 min.) before the β-adrenergic challenge was higher (P < 0.0002) 306
in Lean ewes compared to Normal and Fat groups (Table 5). In contrast, plasma NEFA 307 1 2 3 4 5 6 7 8 9 10 11 12 13 14 15 16 17 18 19 20 21 22 23 24 25 26 27 28 29 30 31 32 33 34 35 36 37 38 39 40 41 42 43 44 45 46 47 48 49 50 51 52 53 54 55 56 57 58 59
Version preprint
response at 5 min. after ISO challenge was higher (P < 0.0003) in Fat ewes. After 10 min. 308
plasma NEFA response was consistently higher in Lean ewes. Plasma NEFA maximal 309
response (0.56 mmol/L) was higher (P < 0.0001) in Lean ewes and this occurred at 12 min. 310
after the challenge (Table 5; Figure 5). 311
The AUC were all higher (P < 0.0001) in Lean ewes. Thus, overall results showed that 312
underfeeding increased basal plasma NEFA, plasma NEFA response at 10 and 20 min., 313
plasma NEFA maximal response after ISO challenge and all NEFA response areas (P < 314
0.0001). The NEFA maximal response occurred later in underfed or Lean ewes when 315
compared to Control and Over ewes. 316
The plasma NEFA kinetics for the three experimental groups appears in Figure 5. The 317
NEFA concentrations increased for 10 min. in all groups and were always higher (P < 0.0001) 318
in Lean ewes during the 60 min. post-challenge with a peak of plasma NEFA concentration 319
attaining 0.53 mmol/L. However, for all groups NEFA concentration decreased in a similar 320
way and, after 60 min., it returned to values close to baseline. 321
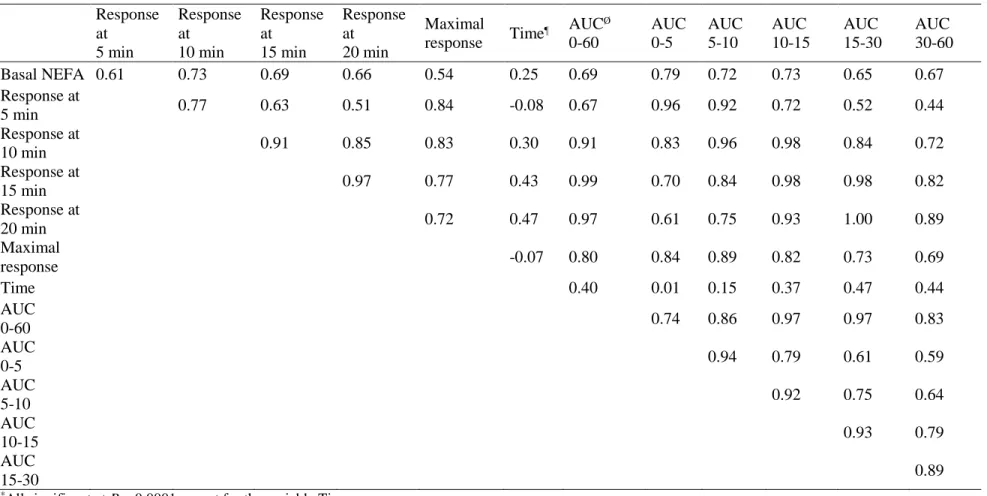
All correlations (r = 0.54 to 0.79) between basal NEFA and different parameters of NEFA 322
response to ISO challenge were significant (P < 0.0001; Table 6) with the exception of the 323
variable time between ISO challenge and maximal response (r = 0.25). The highest 324
correlations between basal plasma NEFA and responses at different points after challenge 325
were at 10, or 15 min (r = 0.73 and 0.69, respectively). The highest correlation between 326
plasma NEFA and AUC were at the area from 0 to 15 min (r = 0.79; 0.72 and 0.73 for 0 to 5, 327
5 to 10 and 10 to 15 min, respectively). 328
From 20 min. after challenge, correlations were progressively lower in the sense of the 329
declining tendency of the curve. Correlations with AUC from time 0 to 60 min. were very 330
high for response at 10, 15, 20 min. (r = 0.91 to 0.99) and maximal response (r = 0.80). 331
Correlations between AUC from time 0 to 60 min. and AUC from time 10 to 15 min., or AUC 332 1 2 3 4 5 6 7 8 9 10 11 12 13 14 15 16 17 18 19 20 21 22 23 24 25 26 27 28 29 30 31 32 33 34 35 36 37 38 39 40 41 42 43 44 45 46 47 48 49 50 51 52 53 54 55 56 57 58 59
Version preprint
from time 15 to 30 min. were very high (r = 0.97); correlations between AUC from time 0 to 333
60 min. and AUC from time 30 to 60 min. (declining part of the curve) were also high (r = 334
0.83; Table 6). Correlations between the maximal response and the response at 5, or 10 min., 335
and with the AUC from time 5 to 10 min. were high (ranging from 0.83 to 0.89; Table 6). 336
Within BCS groups’ correlations between AUC from time 0 to 60 min. and responses at 337
10, 15 and 20 min were higher than those with basal plasma NEFA, or NEFA response at 5, 338
30, 45 and 60 min. (Figure 6). Differences in the releasing NEFA turnover were observed 339
between BCS groups and among individuals in the same group and with similar BW and BCS 340
status (Figure 7). 341
Discussion 342
In the next future, sustainability of farming systems will rely on their ability to cope with 343
a reduction of inputs usage (i.e. concentrate, irrigation, fertilizers…). In this context, a better 344
understanding of the relationship between nutrients supply, nutritional status, their 345
interactions with BR dynamics and the progression of the metabolic profile is essential for the 346
development of a more comprehensive management approach of nutrition based on adaptive 347
capacity of ruminants [14,15,16]. The objectives of this study were to evaluate and describe 348
how dietary energy restriction and/or repletion influence changes in BW, BCS and metabolic 349
status responses in Mérinos d’Arles ewes, considered to be a robust (rustic) and hardy sheep 350
breed. 351
We validated the previous estimation of energy requirements (INRA, 2007 [9]) of the dry 352
ewe by a stabilized BCS and BW over the whole experimental period with the Control diet. 353
Hence adaptive capacity of ewes fed Under and Over diets will be discussed by direct 354
comparison with the ewes Control responses. We confirmed that offering restricted diets to 355
ewes would induce significant increases in BR mobilisation in order to meet their energy 356
requirements. We also verified that, after partial refeeding, the metabolic plasticity of ewes of 357 1 2 3 4 5 6 7 8 9 10 11 12 13 14 15 16 17 18 19 20 21 22 23 24 25 26 27 28 29 30 31 32 33 34 35 36 37 38 39 40 41 42 43 44 45 46 47 48 49 50 51 52 53 54 55 56 57 58 59
Version preprint
this breed allowed the BW and BCS to start recover within a period of similar duration to that 358
of the feed restriction, whereas a high restriction of nutrient allowance would temporarily and 359
negatively affect the voluntary feed intake. The highest feed refusal rate was consistently 360
observed in the Under group, mainly after the first 3–4 weeks of feeding of the restricted diet 361
(data not shown). This is likely to be a consequence of a depressed ruminal environment 362
together with low roughage quality, which is known to negatively affect digestion, 363
metabolism and appetite in undernourished ruminants. 364
Differences in BW and BCS progression throughout the experiment were expected, 365
considering the dietary energy manipulation. The Under, Control and Over ewes reduced, 366
maintained and improved their BW and BCS, respectively. Ewes in the Under and Control 367
groups responded to the dietary manipulation by attempting to maintain their BW and BCS, as 368
observed with the reduced concentrations of GLU, INS and LEPT, compared to ewes that 369
consumed the Over diets (Table 4 and Figures 2, 3 and 4). 370
Throughout the experiment, the Under ewes (who consumed almost half of their MER) 371
presented lower BW and BCS, increased plasma NEFA concentration and lower INS and 372
LEPT concentrations when compared to adequately fed animals. The BR mobilisation status 373
was well illustrated by the consistently higher plasma NEFA concentrations observed in 374
Under ewes. This was expected as this group was exposed to a strong dietary energy 375
restriction, based on ad libitum wheat straw (containing 3.5 % CP and 1.3 Mcal/kg DM of 376
ME) during the first 50 days of the measurement period. After beginning the partial refeeding 377
period at day 50, the same Under ewes responded to the energy repletion with an immediate 378
short-term decrease in their NEFA concentrations, with more delayed recovery of BW and 379
BCS observed in this group (Figure 2), which is logical since it was only a partial refeeding. 380
The endocrine system, characterised by plasma INS and LEPT profiles in this study, 381
regulates metabolism by finely tuned peripheral information, which are ultimately aimed to 382 1 2 3 4 5 6 7 8 9 10 11 12 13 14 15 16 17 18 19 20 21 22 23 24 25 26 27 28 29 30 31 32 33 34 35 36 37 38 39 40 41 42 43 44 45 46 47 48 49 50 51 52 53 54 55 56 57 58 59
Version preprint
maintain homeostasis. These adaptive processes involve the interplay between several 383
hormones, which also include growth hormone (GH) and insulin-like growth factors (IGFs) 384
[17, 18, 19, 20], which were not analysed in this study.
385
The typical characteristics of undernourished ruminants were observed in the Under 386
ewes. The lack of glucose arriving to the rumen, in addition to a reduction in volatile fatty 387
acids (VFA) production, induces gluconeogenesis accompanied by intense lipolysis, 388
proteolysis and ketogenesis [1,17]. The reduction of gut metabolic activity is known to 389
account for the decrease of energy requirement in underfed ruminants. Thus, the reduced 390
oxidative or basal metabolism is characterised by a decrease in plasma GLU, INS, LEPT and 391
prolactin concentrations, and an increase in other hormones such as GH, adrenalin, cortisol 392
and glucagon (not measured in this study). This generally leads to shifts in metabolic 393
pathways which aim to spare GLU (with the accompanied increase in NEFA) and proteins 394
(with increased proteolysis and ketogenesis). 395
Interestingly, the plasma level of β-OHB was lowest in the Under group. This may be due 396
to limits in the supply of β-OHB precursors by this diet. Thus, even if higher BR mobilisation 397
was present in Under ewes, the unexpected lower β-OHB plasma concentration is probably 398
the consequence of the ingredients used in the experimental diets. The Under diet, which only 399
offered wheat straw, did not contain the required precursors. However, with similar 400
underfeeding situation [21] fat-tailed Barbarine ewes were able to produce and survive thanks 401
to their significant ability to mobilise their BR. Plasma NEFA and β-OHB concentrations 402
were initially almost doubled. The medium-term response of these ewes was very similar to 403
what we observed: a steady decline of these metabolites, which was attributed to their ability 404
to adjust their lipid metabolism in order to reduce the toxic effects of high concentrations of 405
NEFA and β-OHB, and therefore, prolong survival. After partial refeeding Barbarine ewes 406
were able to fully recover their initial BW, lipid and protein masses [21]. 407 1 2 3 4 5 6 7 8 9 10 11 12 13 14 15 16 17 18 19 20 21 22 23 24 25 26 27 28 29 30 31 32 33 34 35 36 37 38 39 40 41 42 43 44 45 46 47 48 49 50 51 52 53 54 55 56 57 58 59
Version preprint
Submitted to an opposite nutritional situation, the enhancement of the anabolic pathway 408
response was clear in the Over ewes, with increased GLU, INS and LEPT concentrations and 409
decreased plasma NEFA (Figures 2, 3 and 4). However, differences toward dominant anabolic 410
responses were not always evident when comparing the Control and Over ewes, despite the 411
clear differences in energy supply, which should have been sufficient to create greater 412
differences than those observed. However, the BW and BCS progression were clearly 413
different between the groups from 20 days after the introduction of the diet changes (Figure 414
2). Thus, the differences in responses between these two groups were not well described in 415
this study from the analysis of the chosen metabolites and metabolic hormones. This led us to 416
hypothesise that measuring other parameters, including GH, IGF-1 and polyunsaturated 417
nitrogen (PUN), may provide an improved characterisation of the anabolic and catabolic 418
responses. It is highly probable as reported by Delavaud et al. [22], that increasing amounts of 419
stored body fat in the Over group, increased their MER thus reducing the energy balance gaps 420
between Normal and Over ewes. Hence metabolic and endocrine profiles are blunted by this 421
phenomenon. Such effects of body fatness on energy requirement were reported by Caldeira 422
and Portugal [20] in underfed fat ewes. Ewes with low BCS had lower plasma GLU, 423
triiodothyronine and thyroxine concentrations and serum INS, albumin, globulins and IGF-I, 424
in addition to higher serum NEFA, urea and creatinine. 425
When energy intake is high, INS concentrations are also high, which promotes growth 426
and/or BR recovery [1, 19, 22]. Such a positive correlation between energy intake and INS 427
concentrations has been reported and this response was confirmed when lowering energy 428
supply: concentrations of INS decreased during energy restriction [18]. 429
Adrenergic challenge 430
Our results regarding the individual responses to the ß-adrenergic challenge are in 431
agreement with Chilliard et al. [13]. These authors found that basal NEFA and NEFA 432 1 2 3 4 5 6 7 8 9 10 11 12 13 14 15 16 17 18 19 20 21 22 23 24 25 26 27 28 29 30 31 32 33 34 35 36 37 38 39 40 41 42 43 44 45 46 47 48 49 50 51 52 53 54 55 56 57 58 59
Version preprint
response to an isoprotenol (ISO) challenge with a similar dose to that used in our experiment 433
(4 nmol/kg BW) were higher in underfed than overfed cows. Consistent with our findings, 434
high correlations between the response area or maximal NEFA response and NEFA response 435
at 15 min. (r = 0.95 and 0.98, respectively) were observed. A significant effect of BCS on the 436
basal plasma level was also reported, thus concluding that NEFA response to ISO at 15 min. 437
could provide an efficient method for in vivo studying the AT lipolytic potential. Our results, 438
including trends of the response curves with regard to BCS groups, are very similar to those 439
findings, except maximum value was obtained at 10 min. in our study. We also agree with the 440
fact that maximal response occurred later when this response was higher which illustrates that 441
lipolytic response to ISO take longer in underfed animals. 442
The significant correlation (r = 0.69) between plasma NEFA and NEFA maximal 443
response to ISO confirms results obtained in lactating ewes by Bocquier et al. [23] and 444
suggests that the adrenergic component of the lipolytic cascade plays a significant role in the 445
regulation of basal plasma NEFA. The NEFA response to ISO challenge in that well-fed 446
lactating ewes depended on body lipid mass but not on energy balance. By the contrary, in 447
underfed ewes the NEFA response depended on energy balance and not on the body lipid 448
mass. Adrenergic challenge was also useful in explaining the differences in interindividual 449
adaptive strategies to underfeeding in the ewe. In underfed ewes Bocquier et al. [23] observed 450
that the relative variation in milk yield was negatively correlated to NEFA+10 (r = -0.51), 451
which show that ability to support lactation was related to the ability to mobilise body lipids. 452
Potential contribution for a simplified method helping to identify individual adaptive 453
capacities or robustness (intraflock variability) 454
There is evidence of the great potential of plasma NEFA as a powerful predictor of the 455
nutritional status of the ruminant under determined circumstances. This parameter provides 456
reliable information on the stage of the BR mobilization of the animal under exigent 457 1 2 3 4 5 6 7 8 9 10 11 12 13 14 15 16 17 18 19 20 21 22 23 24 25 26 27 28 29 30 31 32 33 34 35 36 37 38 39 40 41 42 43 44 45 46 47 48 49 50 51 52 53 54 55 56 57 58 59
Version preprint
physiological status and/or when facing the consequences of being reared in fluctuating 458
environments [3, 4]. The NEFA is thus recommended as a good diagnostic tool for health or 459
reproductive interpretations, and we think that it could also be considered as a pertinent 460
variable to be included in models aiming to analyze metabolic plasticity of ruminants when 461
facing variability in feed availability and quality in a given timespan (i.e. individual 462
robustness). 463
In previous works carried out by our team and aiming to characterize the energy 464
metabolism of ewes in a typical round productive year, such a NEFA potential for illustrating 465
the dynamic of individual BR status was confirmed in Romane [3] and Lacaune [4] meat and 466
dairy ewes, respectively. 467
In the present study we evaluated the in vivo method with a β-adrenergic challenge. We 468
confirmed our hypothesis that ewes with different, contrasted BCS would respond differently 469
to a β-adrenergic challenge and that this response could be predicted at a given point (10 470
min.) of the plasma NEFA kinetic after the challenge, in function of the relationships between 471
the different parameters responses at different times. 472
Chilliard et al. [13] using the same method, looked for a simplified procedure for 473
predicting the lipolytic response curve with a smaller number of samples after ISO challenge. 474
Consistent with our results (Figure 5, 6), they obtained a very good prediction of AUC from 475
time 0 to 60 min either by the partial AUC from time 0 to 20 min (r = 0.95) or by the sole 476
response at 15 (r = 0.95) or 20 min (r = 0.97). Measuring plasma NEFA in blood samples 477
taken just before and at 15 (or 20) min after an ISO injection was thus considered as an 478
efficient and simple way of predicting the maximal NEFA response of an individual and an 479
AUC equivalent to one hour of sampling. Extra blood samplings at 5, 10, and 20 (or 15) min 480
after ISO challenge only slightly increased the prediction of these parameters. 481 1 2 3 4 5 6 7 8 9 10 11 12 13 14 15 16 17 18 19 20 21 22 23 24 25 26 27 28 29 30 31 32 33 34 35 36 37 38 39 40 41 42 43 44 45 46 47 48 49 50 51 52 53 54 55 56 57 58 59
Version preprint
The adaptive capacity of a ruminant to an adrenergic challenge alias (i.e. pronounced 482
energy shortage) is expressed by subsequent individual physiological responses at the short-, 483
medium- and long-term timespans. Differences in the amplitude (gap between maximum 484
NEFA response and basal NEFA), turnover (exponential slope when reducing plasma NEFA 485
after maximal response) and length of those specific and combined processes are expected to 486
be consistent with adaptive capacities’ differences between individuals reared under similar 487
conditions. 488
A stronger lipolytic potential could be seen as a sight of the ultimate necessity of the 489
animal to compensate their basic requirements by mainly using their BR. Indeed, when facing 490
an undernutrition event (i.e. challenge), a higher and quicker BR mobilization peak 491
(illustrated by plasma NEFA) could be a symptom of the incapacity of the animal to readjust 492
its MER at the short-term. This would be in close relationship with their more or less efficient 493
capacity of regulating (reducing) its feed intake and thus the individual MER, which would 494
mean a higher dependency of their BR per se to cover energy requirements. Thus, under 495
uniform conditions (i.e. same species, breed, physiological state, age, production system, 496
feeding regimen…) less NEFA at a given point after the challenge would means that the 497
animal is less depending from its BR. That individual, with more pronounced NEFA 498
amplitude and quicker NEFA turnover would be, a priori, a better adapted animal when 499
compared to its cohort. Such differences at the intragroup level were observed in our 500
experiment (Figure 7). This could enable us to the potential effective use of this relative easy 501
and quick method, for contributing to give useful information for identifying existing 502
intraflock variability in individual robustness in practice at a given field situation. 503
Conclusions 504
The findings confirmed the ability of these mature, dry, non-pregnant Mérinos d’Arles 505
ewes to quickly overcome undernutrition situations by efficiently using their body reserves. 506 1 2 3 4 5 6 7 8 9 10 11 12 13 14 15 16 17 18 19 20 21 22 23 24 25 26 27 28 29 30 31 32 33 34 35 36 37 38 39 40 41 42 43 44 45 46 47 48 49 50 51 52 53 54 55 56 57 58 59
Version preprint
The anabolic or catabolic responses to energy dietary manipulations were accompanied by 507
synchronised metabolic regulation, resulting in differences in their metabolic and BCS 508
profiles. 509
Because of the fact that lipolytic activity of adipose tissue differed among ewes with 510
similar body condition status in the same group, our results also indicate the potential of using 511
a simplified ß-adrenergic challenge protocol for identifying, at the intraflock level, individual 512
differences in adaptive capacity to undernutrition. 513
Acknowledgements 514
Authors are grateful to the technical staff of Domaine du Merle experimental farm, 515
especially to Céline Maton, Jean-Dominique Guyonneau and Denis Montier for assisting with 516
animal care and data collection. 517
References 518
[1] Chilliard Y, Bocquier F, Doreau M. Digestive and metabolic adaptations of ruminants to 519
undernutrition, and consequences on reproduction. Reprod Nutr Dev. 1998;38:131–52. 520
[2] Friggens NC, Brun-Lafleur L, Faverdin P, Sauvant D, Martin O. Advances in predicting nutrient 521
partitioning in the dairy cow: recognizing the central role of genotype and its expression 522
through time. Animal 2013; 7:89–101. 523
[3] González-García E, Gozzo de Figuereido V, Foulquie D, Jousserand E, Autran P, Camous S, et al. 524
Circannual body reserve dynamics and metabolic profile changes in Romane ewes grazing on 525
rangelands. Domest Anim Endocrinol 2014;46:37–48. 526
[4] González-García E, Tesniere A., Camous S, Bocquier F, Barillet F, Hassoun P. The effects of 527
parity, litter size, physiological state, and milking frequency on the metabolic profile of 528
Lacaune dairy ewes. Domest Anim Endocrinol 2015;50:32–44. 529
[5] Ferlay A, Chilliard Y. Effects of the infusion of non-selective β-, and selective β1- or β2-530
adrenergic agonists, on body fat mobilisation in underfed or overfed non-pregnant heifers. 531
Reprod Nutr Dev. 1999;39:409–21. 532 1 2 3 4 5 6 7 8 9 10 11 12 13 14 15 16 17 18 19 20 21 22 23 24 25 26 27 28 29 30 31 32 33 34 35 36 37 38 39 40 41 42 43 44 45 46 47 48 49 50 51 52 53 54 55 56 57 58 59
Version preprint
[6] Teyssier J, Migaud M, Debus N, Maton C, Tillard E, Malpaux B, et al. Expression of seasonality 533
in Merinos d’Arles ewes of different genotypes at the MT1 melatonin receptor gene. Animal 534
2011;5:329–36. 535
[7] Hanocq E, Bodin L, Thimonier J, Teyssier J, Malpaux B, Chemineau P. Genetic parameters of 536
spontaneous spring ovulatory activity in Mérinos d’Arles sheep. Genet Sel Evol 1999;31:77– 537
99. 538
[8] Debus N, Chavatte-Palmer P, Viudes G, Camous S, Roséfort A, Hassoun P. Maternal 539
periconceptional undernutrition in Merinos d’Arles sheep: 1. Effects on pregnancy and 540
reproduction results of dams and offspring growth performances. Theriogenology 541
2012;77:1453–65. 542
[9] INRA. Alimentation des bovins, ovins et caprins Besoins des animaux - Valeurs des aliments. 543
Tables Inr. Paris, France: 2010. 544
[10] Russel AJF, Doney JM, Gunn RG. Subjective assessment of body fat in live sheep. J Agric Sci. 545
1969;72:451–4. 546
[11] Williamson DH, Mellanby JD. Hydroxybutyrate. In: Bergmeyer HB, editor. Methods of 547
enzymatic analysis. New York Academic Press; 1974. p. 1836–9. 548
[12] Statistical Analysis Systems Institute (SAS). SAS language guide for personal computers. Cary, 549
NC, USA: SAS Institute Inc; 2003. Version 9.3. 550
[13] Chilliard Y, Ferlay A, Desprès L, Bocquier F. Plasma non-esterified fatty acid response to a β-551
adrenergic challenge before or after feeding in energy underfed or overfed, dry or lactating 552
cows. Anim Sci. 1998;67:213–23. 553
[14] Bocquier F, González-García E. Sustainability of ruminant agriculture in the new context: feeding 554
strategies and features of animal adaptability into the necessary holistic approach. Animal 555
2011;4:7:1258–1273. 556
[15] Friggens NC, Ingvartsen KL, Emmans GC. Prediction of body lipid change in pregnancy and 557
lactation. J Dairy Sci 2004;87:988–1000. 558
[16] Blanc F, Bocquier F, Agabriel J, D’hour P, Chilliard Y. Adaptive abilities of the females and 559 1 2 3 4 5 6 7 8 9 10 11 12 13 14 15 16 17 18 19 20 21 22 23 24 25 26 27 28 29 30 31 32 33 34 35 36 37 38 39 40 41 42 43 44 45 46 47 48 49 50 51 52 53 54 55 56 57 58 59
Version preprint
[17] Bauman DE, Currie WB. Partitioning of nutrients during pregnancy and lactation: a review of 561
mechanisms involving homeostasis and homeorhesis. J Dairy Sci. 1980;63:1514–29. 562
[18] Cassady JM, Maddock TD, DiCostanzo A, Lamb GC. Initial body condition score affects 563
hormone and metabolite response to nutritional restriction and repletion in yearling 564
postpubertal beef heifers. J Anim Sci. 2009;87:2262–73. 565
[19] Sosa C, Abecia JA, Carriquiry M, Forcada F, Martin GB, Palacín I, et al. Early pregnancy alters 566
the metabolic responses to restricted nutrition in sheep. Domest Anim Endocrinol. 2009;36:13– 567
23. 568
[20] Caldeira RM, Portugal A V. Interrelationships between body condition and metabolic status in 569
ewes. Small Rumin Res. 1991;6:15–24. 570
[21] Atti N, Bocquier F KG. Performance of the fat-tailed Barbarine sheep in its environment: 571
adaptive capacity to alternation of underfeeding and re-feeding periods. A review. Anim Res. 572
2004;53:165–76. 573
[22] Delavaud C, Bocquier F, Baumont R, Chaillou E, Ban-Tokuda T, Chilliard Y. Body fat content 574
and feeding level interact strongly in the short- and medium-term regulation of plasma leptin 575
during underfeeding and re-feeding in adult sheep. Br J Nutr. 2007;98:106–15. 576
[23] Bocquier F, Ferlay A Chilliard Y. Effects of body lipids and energy balance on the response of 577
plasma non-esterified fatty acids to a ß-adrenergic challenge in the lactating dairy ewe. In: 578
McCracken KK, Unsworth EF, Wylie ARG, editors. Energy metabolism of farm animals. 579
Proceedings of the 14th symposium on energy metabolism inform animals, Newcastle, 580
Northern Ireland; 1998. 167–170. CAB International, University Press, Cambridge. 581 1 2 3 4 5 6 7 8 9 10 11 12 13 14 15 16 17 18 19 20 21 22 23 24 25 26 27 28 29 30 31 32 33 34 35 36 37 38 39 40 41 42 43 44 45 46 47 48 49 50 51 52 53 54 55 56 57 58 59
Version preprint
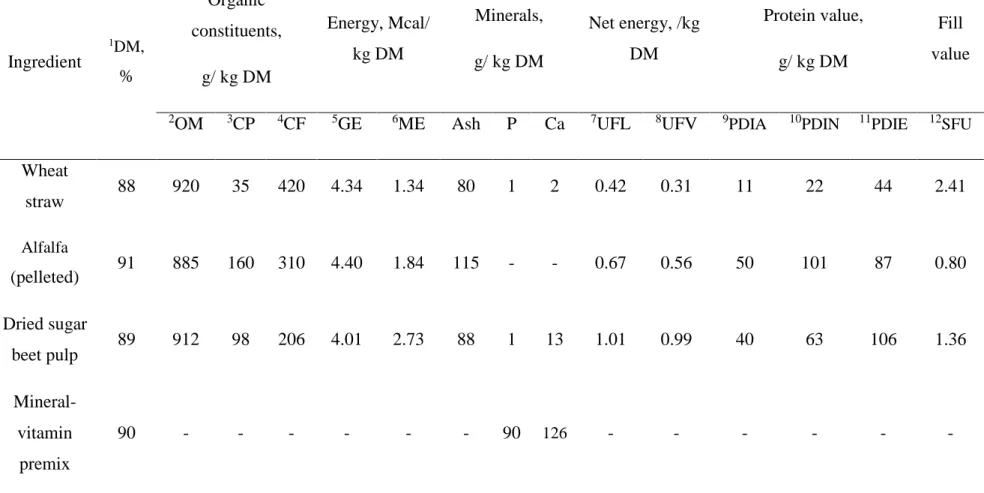
Table 1 Nutritive value of ingredients included in the experimental diets
Ingredient 1DM, % Organic constituents, g/ kg DM Energy, Mcal/ kg DM Minerals, g/ kg DM Net energy, /kg DM Protein value, g/ kg DM Fill value
2OM 3CP 4CF 5GE 6ME Ash P Ca 7UFL 8UFV 9PDIA 10PDIN 11PDIE 12SFU
Wheat straw 88 920 35 420 4.34 1.34 80 1 2 0.42 0.31 11 22 44 2.41 Alfalfa (pelleted) 91 885 160 310 4.40 1.84 115 - - 0.67 0.56 50 101 87 0.80 Dried sugar beet pulp 89 912 98 206 4.01 2.73 88 1 13 1.01 0.99 40 63 106 1.36 Mineral-vitamin premix 90 - - - 90 126 - - - -
1DM= Dry matter content; 2OM= Organic matter content; 3CP= Crude protein content; 4CF= Crude fibre content; 5GE= Gross energy; 6ME= metabolizable
energy; 7UFL= net energy for lactation; 8UFV= net energy for maintenance and meat production; 9PDIA= dietary protein undegraded in the rumen which is digestible in the small intestine;10PDIN= PDIA + PDIMN (microbial protein that could be synthesized from the rumen degraded dietary N when energy is not limiting); 11PDIE= PDIA + PDIME (microbial protein that could be synthesized from the energy available in the rumen when degraded N is not limiting); 12SFU=
Fill unit for sheep
1 2 3 4 5 6 7 8 9 10 11 12 13 14 15 16 17 18 19 20 21 22 23 24 25 26 27 28 29 30 31 32 33 34 35 36 37 38 39 40 41 42 43 44 45 46 47 48 49 50 51 52 53 54 55 56 57 58 59
Version preprint
Table 2 Diet composition and daily nutrient supply according to treatment during the dietary challenge period (day 0 to 49). Values between brackets correspond to the added or reduced quantities applied during the refeeding period (day 49 till 100)
Treatment Ingredienta
Nutrient supply per ewe (DM basis) Distributed
(as-fed), kg
DM, kg 1UFV 2PDIN, g 3PDIE, g Fill units 4CP, g P, g Ca, g
Control (100% 6MER) Wheat straw 0.91 (=) 0.80 (=) 0.25 (=) 18 (=) 35 (=) 1.28 (=) 28 (=) 1 (=) 2 (=) Alfalfa 0.17 (+11) 0.15 (+0.10) 0.08 (+0.06) 15 (+10) 13 (+9) 0.12 (+0.8) 24 (+16) 1 (+0.5) 1 (+0.5) Dried sugar beet pulp 0.17 (+11) 0.15 (+0.10) 0.15 (+0.10) 9 (+7) 16 (+11) 0.12 (+0.8) 15 (+10) 0 (+0.3) 2 Underfed (70% MER) Wheat straw 1.00 (˗0.50) 0.88 (˗0.38) 0.27 (˗0.11) 19 (˗8) 39 (˗17) 1.41 (˗0.61) 31 (˗13) 1 (=) 2 Alfalfa 0 (+10) 0 (+0.10) 0 (+0.06) 0 (+10) 0 (+9) 0 (+0.08) 0 (+16) 0 (=) 0 (=) Dried sugar beet pulp 0 (+11) 0 (+0.10) 0 (+0.10) 0 (+6) 0 (+11) 0 (+0.08) 0 (+10) 0 (=) 0 (+1) Overfed (160% MER) Wheat straw 0.57 (+11) 0.50 (=) 0.16 (=) 11 (=) 22 (=) 0.80 (=) 18 (=) 1 (=) 1 (=) Alfalfa 0.44 (+10) 0.40 (+0.10) 0.22 (+0.06) 40 (+11) 35 (+9) 0.32 (+0.08) 64 (+16) 1 (+0.5) 1 (+0.5) Dried sugar beet pulp 0.45 (+11) 0.40 (+0.10) 0.40 (+0.10) 25 (+7) 42 (+11) 0.32 (+0.08) 39 (+10) 0 (+0.5) 5 (+1.5)
1UFV= net energy for maintenance and meat production; 2PDIN= PDIA + PDIMN (microbial protein that could be synthesized from the rumen degraded dietary N when energy is not limiting); 3PDIE= PDIA + PDIME (microbial protein that could be synthesized from the energy available in the rumen when degraded N is not limiting); 4CP= Crude protein; 6MER= maintenance energy requirements. a The mineral-vitamin premix was supplied at the same rate for all treatments i.e. 10
g/ewe/d thus providing the same amount of P and Ca (1g/ewe/d and 1 g/ewe/d, respectively)
1 2 3 4 5 6 7 8 9 10 11 12 13 14 15 16 17 18 19 20 21 22 23 24 25 26 27 28 29 30 31 32 33 34 35 36 37 38 39 40 41 42 43 44 45 46 47 48 49 50 51 52 53 54 55 56 57 58 59
Version preprint
Table 3 Final individual daily feeding balances, after calculating average feed refusal per treatment
1UFV 2PDIN
Treatment
Requirements
Actual daily intake Balance,
% of 3MER
Requirements
Actual daily intake Balance,
% of 4MPR
0-49 d 50-100 d Average 0-49 d 50-100 d Average
Control 0.592 0.63 0.72 0.675 114 41 47 60 53 129
Underfed 0.592 0.41 0.39 0.403 68 41 22 30 26 62
Overfed 0.592 1.09 1.16 1.123 190 41 102 107 104 252
1UFV= net energy for maintenance and meat production; 2PDIN= PDIA + PDIMN (microbial protein that could be synthesized from the rumen degraded dietary
N when energy is not limiting); 3MER= maintenance energy requirements; 4MPR= maintenance protein requirements 1 2 3 4 5 6 7 8 9 10 11 12 13 14 15 16 17 18 19 20 21 22 23 24 25 26 27 28 29 30 31 32 33 34 35 36 37 38 39 40 41 42 43 44 45 46 47 48 49 50 51 52 53 54 55 56 57 58 59
Version preprint
Table 4 Average body weight (BW), body condition score (BCS) and plasma profiles of mature, dry, non-pregnant Mérinos d’Arles ewes (n = 36) receiving 70% (Underfed; n = 12), 100% (Control; n = 12) or 160% (Overfed; n = 12) of their maintenance energy requirements during the dry-off period
Item
Nutritional plane or treatment Effects, P value
Control Underfed Overfed Regimen Time Regimen × Time
BW, kg 44.27 (±0.285) 41.59 (±0.285) 47.48 (±0.446) <.0001 <.0001 <.0001 BCS, 1-5 1.92 (±0.017) 1.78 (±0.017) 2.00 (±0.027) <.0001 <.0001 <.0001 NEFA, mmol/L 0.12 (±0.011) 0.26 (±0.011) 0.09 (±0.017) <.0001 0.0002 <.0001 β-OHB, mg/L 23.36 (±0.684) 20.16 (±0.684) 23.58 (±1.068) 0.003 <.0001 <.0001 Glucose, g/L 0.55 (±0.005) 0.55 (±0.005) 0.59 (±0.008) 0.025 <.0001 0.0061 Insulin, µIU/mL 12.98 (±0.520) 11.58 (±0.520) 14.96 (±0.813) 0.004 0.0033 0.0001 Leptin, ng/mL 4.56 (±0.058) 4.52 (±0.058) 5.09 (±0.091) 0.003 <.0001 <.0001 1 2 3 4 5 6 7 8 9 10 11 12 13 14 15 16 17 18 19 20 21 22 23 24 25 26 27 28 29 30 31 32 33 34 35 36 37 38 39 40 41 42 43 44 45 46 47 48 49 50 51 52 53 54 55 56 57 58 59
Version preprint
Table 5 Average body weight (BW), body condition score (BCS), basal plasma NEFA (at -15 min.) and plasma NEFA responses to a β-adrenergic challenge with isoproterenol injection in mature, dry, non-pregnant Mérinos d’Arles ewes (n = 36) with different body
condition scores
BCS group
Item Normal Lean Fat
Effect, P <
LSmeans SEM LSmeans SEM LSmeans SEM
BW, kg 46.22 0.786 37.69 0.786 50.92 0.923 <.0001
BCS, 1-5 1.79 0.049 1.34 0.049 2.17 0.058 <.0001
Basal NEFA, mmol/L 0.06 0.02 0.11 0.02 0.05 0.02 0.0002
Response at 5 min., mmol/L 0.31 0.04 0.33 0.04 0.37 0.04 0.0003
Response at 10 min., mmol/L 0.23 0.04 0.42 0.04 0.22 0.04 <.0001
Response at 20 min., mmol/L 0.08 0.03 0.30 0.03 0.05 0.03 <.0001
Maximal response, mmol/L 0.38 0.04 0.56 0.06 0.42 0.03 <.0001
Time¶, min. 5.83 0.54 12.00 1.93 5.00 0.00 <.0001 AUCØ, mmol.min/L from 0 to 5 min. 1.1 0.14 1.4 0.23 1.2 0.09 <.0001 from 5 to 10 min. 1.6 0.22 2.4 0.33 1.7 0.14 <.0001 from 10 to 15 min. 1.2 0.20 2.6 0.31 1.1 0.12 <.0001 from 15 to 30 min. 1.9 0.38 5.6 0.62 1.4 0.23 <.0001 from 30 to 60 min. 2.8 0.58 5.5 0.65 2.0 0.23 <.0001 from 0 to 60 min. 5.4 0.87 13.3 1.53 5.5 0.59 <.0001
¶Time between isoproterenol challenge and maximal response; ØArea under the concentration curve and above baseline 1 2 3 4 5 6 7 8 9 10 11 12 13 14 15 16 17 18 19 20 21 22 23 24 25 26 27 28 29 30 31 32 33 34 35 36 37 38 39 40 41 42 43 44 45 46 47 48 49 50 51 52 53 54 55 56 57 58 59
Version preprint
Table 6 Correlation coefficients* between basal plasma NEFA and plasma NEFA responses to isoproterenol challenge in fat, lean or normal body condition score meat ewes (n = 36)
Response at 5 min Response at 10 min Response at 15 min Response at 20 min Maximal response Time ¶ AUCØ 0-60 AUC 0-5 AUC 5-10 AUC 10-15 AUC 15-30 AUC 30-60 Basal NEFA 0.61 0.73 0.69 0.66 0.54 0.25 0.69 0.79 0.72 0.73 0.65 0.67 Response at 5 min 0.77 0.63 0.51 0.84 -0.08 0.67 0.96 0.92 0.72 0.52 0.44 Response at 10 min 0.91 0.85 0.83 0.30 0.91 0.83 0.96 0.98 0.84 0.72 Response at 15 min 0.97 0.77 0.43 0.99 0.70 0.84 0.98 0.98 0.82 Response at 20 min 0.72 0.47 0.97 0.61 0.75 0.93 1.00 0.89 Maximal response -0.07 0.80 0.84 0.89 0.82 0.73 0.69 Time 0.40 0.01 0.15 0.37 0.47 0.44 AUC 0-60 0.74 0.86 0.97 0.97 0.83 AUC 0-5 0.94 0.79 0.61 0.59 AUC 5-10 0.92 0.75 0.64 AUC 10-15 0.93 0.79 AUC 15-30 0.89
*All significant at P < 0.0001 except for the variable Time
¶Time between isoproterenol challenge and maximal response; ØArea under the concentration curve and above baseline 1 2 3 4 5 6 7 8 9 10 11 12 13 14 15 16 17 18 19 20 21 22 23 24 25 26 27 28 29 30 31 32 33 34 35 36 37 38 39 40 41 42 43 44 45 46 47 48 49 50 51 52 53 54 55 56 57 58 59