HAL Id: hal-00844968
https://hal.archives-ouvertes.fr/hal-00844968
Submitted on 16 Jul 2013
HAL is a multi-disciplinary open access
archive for the deposit and dissemination of
sci-entific research documents, whether they are
pub-lished or not. The documents may come from
teaching and research institutions in France or
abroad, or from public or private research centers.
L’archive ouverte pluridisciplinaire HAL, est
destinée au dépôt et à la diffusion de documents
scientifiques de niveau recherche, publiés ou non,
émanant des établissements d’enseignement et de
recherche français ou étrangers, des laboratoires
publics ou privés.
A Comparison Between Divergence Measures for
Network Anomaly Detection
Jean Tajer, Ali Makke, Osman Salem, Ahmed Mehaoua
To cite this version:
Jean Tajer, Ali Makke, Osman Salem, Ahmed Mehaoua. A Comparison Between Divergence Measures
for Network Anomaly Detection. 7th International Conference on Network and Service Management
(CNSM 11), 2011, pp.1 - 5. �hal-00844968�
A Comparison Between Divergence Measures for
Network Anomaly Detection
Jean Tajer, Ali Makke, Osman Salem and Ahmed Mehaoua
Laboratoire d’Informatique PAris DEscartes (LIPADE)Abstract—This paper deals with the detection of flooding
attacks which are the most common type of Denial of Service (DoS) attacks. We compare 2 divergence measures (Hellinger distance and Chi-square divergence) to analyze their detection accuracy. The performance of these statistical divergence mea-sures are investigated in terms of true positive and false alarm ratio. A particular focus will be on how to use these measures over Sketch data structure, and which measure provides the best detection accuracy. We conduct performance analysis over publicly available real IP traces (MAWI) collected from the WIDE backbone network. Our experimental results show that Chi-square divergence outperforms Hellinger distance in network anomalies detection.
Keyword: DDoS, TCP SYN Flooding, K-ary Sketch, Hellinger Distance, Chi-Square Divergence.
I. INTRODUCTION
The security issues have been widely investigated in the last decade. Recently, many web servers were victim of flooding attacks over the Internet. In this paper, we focus on istributed Denial of Service (DDoS) attacks through TCP SYN flooding, since most of web servers use TCP protocol, and SYN flooding is the most commonly used attack [1], [2], [3]. Recently, PayPal was victim of SYN flooding attack and its services had been interrupted for a duration of 8 hours and 15 minutes on December 2010.
Many change point detection algorithms aggregate the whole network traffic in one flow, and identify the instant where deviation occurs in the resulted time series. However, as these methods aggregate the whole traffic in one time series, low intensity attacks are buried by the large variations of background traffic in high speed networks, and attacks may pass undetected. Moreover, the time series derived from IP traffic are subject to many variations that are irrelevant to anomaly. The time series are non-stationary and tend to change over time, leading to a lot of false alarms. Reducing the false alarms and increasing the detection accuracy in such methods is a challenging problem.
In this paper, we compare 2 divergence measures for the detection of flooding attacks. These measures describe the de-viation between two probability distributions. They are applied over Sketch data structure to accomplish a grained analysis for flooding attack detection. The Sketch data structure is used for dimensionality reduction, and to derive probabil-ity distributions. We emphasize our study in this paper on the comparison of these divergences measures with dynamic threshold. The objective is to pinpoint the divergence measure
with the highest detection rate and the lowest false alarm rate. To the best of our knowledge, there have been no prior attempts to compare the performance of divergence measures over Sketch.
The rest of this paper is organized as follows. Related work is provided in section II. Section III describes briefly the Sketch data structure and presents a short description of used divergence measures in our comparison. Section IV describes the implemented system used to achieve comparison between divergence measures. Section V presents our experimental results over real IP traces. Finally, we present the conclusion and our future work in section VI.
II. RELATED WORK
SYN flooding attack detection has been an interesting issue for security researchers. Proposed methods for network anomaly detection are based on different techniques, such as Haar-wavelet analysis [4], [5], entropy based method [6] and Holt-Winters [7] seasonal forecasting method. Authors in [3] compare two different algorithms (CUSUM and adaptive threshold) for the detection of SYN flooding attack. They con-clude that CUSUM performs better than adaptive threshold in terms of detection accuracy of low intensity attacks. However, both of these algorithms face problems of false alarm ratio under normal IP traffic variations.
Most of existing works for flooding attack detection ag-gregate the whole traffic in one time series, and applies a change point detection algorithm to detect the instant of anomaly occurrence. They have a good performance in terms of spatial and temporal complexity, but present the drawback of aggregating all traffic in one flow, where low intensity attacks cannot be detected and normal traffic variations raise false alarms.
In response to these problems, Sketch data structure uses random aggregation for more grained analysis than aggre-gating whole traffic in one flow. It has been used to sum-marize monitored traffic in a fixed memory, and to provide scalable input for time series analysis. Authors in [8], [9] apply Hellinger Distance (HD) over Sketch data structure, in order to detect heavy deviations between current and previous distributions of the number of SIP INVITE requests. In fact, HD increases up to one whenever the distributions diverge (e.g. under INVITE flooding attacks). In addition, they used a dynamic threshold mechanism (proposed in [9]) during their experimental analysis for anomaly detection.
In this paper, we also use Sketch data structure to provide grained analysis and to derive probability distributions. We are aiming to compare the performance of 2 divergence measures: Hellinger Distance and Chi-square divergence.
III. BACKGROUND
A. K-ary Sketch
Using Sketch data structure makes our framework flexible and scalable for grained analysis. No matter how many flows exist in the traffic, Sketch generates fixed-number of time series [10], [11] for anomaly detection. Sketch provides more grained analysis than aggregating whole traffic in one time series.
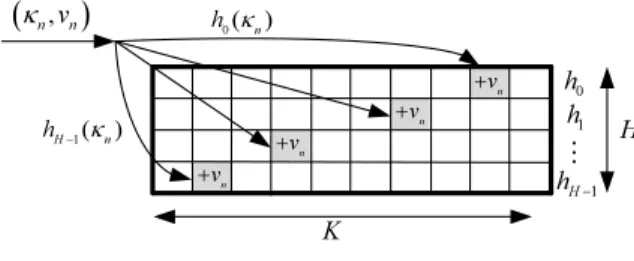
The Sketch data structure is used for dimensionality reduc-tion. It is based on random aggregation of traffic attribute (e.g. number of packets) in different hash tables. A Sketch S is a 2D array of H × K cell (as shown in Fig. 1), where K is the size of the hash table, and H is the number of mutual independent hash functions (universal hash functions). Each item is identified by a key κn and associated with a reward value νn. For each new arriving item(κn, νn), the associated value will be added to the cell S[i][j], where i is an index used to represent the hash function associated with ith hash table (0 ≤ i ≤ d − 1), and j is the hash value (j = hi(κn)) of the key by the ith hash function.
Data items whose keys are hashed to the same value, will be aggregated in the same cell in the hash table, and their values will be added up to existing counter in the hash table. Each hash table (or each row) is used to derive probability distribution as the ratio of the counter in each cell to the sum of whole cell in the line. The derived probability distributions (we getK probability set, one per line) are used as inputs for divergence measures. 0 h 1 h 1 H h − K ⋮
(
,)
n vn κ h κ0( n) 1( ) H n h κ − n v + n v + n v + n v + HFig. 1. Sketch data structure.
B. Divergence measures
These measures are used to detect the DDoS attacks based on the deviation of traffic distribution. In fact, the idea is to compare the prior distribution derived from Sketch counters in previous time slot, with the currently obtained distribution. One can use this change to detect flooding attack, because the counter of one cell will increase significantly with the number of sent requests, and the probability distribution deviates at the start and stop instants of the flooding attack.
1) Hellinger Distance (HD): is used to measure the di-vergence between two sets of probability values. For two discrete probability distributionsP = (p0, p1, . . . , pk−1) and Q = (q0, q1, . . . , qK−1), with pi≥ 0, qi≥ 0, and: K−1X i=0 pi= K−1X i=0 qi= 1 (1)
The HD [8] between current distributionP and prior distribu-tionQ is defined as:
HD(P, Q) = 1 2 K−1X ı=0 (√pi−√qi)2 (2) Where HD satisfies the inequality 0 ≤ HD(P, Q) ≤ 1, and HD(P, Q) = 0 iff P = Q. HD is a symmetric distance (e.g. HD(P, Q) = HD(Q, P )), and induces two spikes, one at the beginning of change, and the second at the end of the change.
2) Chi-square Divergence: χ2
divergence [12] between 2 probability distributionsP and Q is given by:
χ2 (P ||Q) = K−1X i=0 (pi− qi) 2 qi (3) Where Q is the prior probability distribution, and P is the current probability distribution, andχ2
(P, Q) is the divergence between distributionsP and Q.
χ2
divergence can run from zero into infinity. χ2
will be zero iff P and Q are identical (pi = qi) and χ2 increases as the distributions become dissimilar, and eventually so high (infinity) when the two distributions are independent (P 6= Q). It is important to note thatχ2
divergence is asymmetric, where it generates only one spike at the beginning of the attack. The division 0/0 in Eq. 3 is treated as 0, and the division by zero is replaced by a very small value ε.
The χ2
divergence between 2 probability distributions P and Q must be near zero under normal traffic, with a large deviation (one spike) when distributions change occurs.
IV. SYSTEM ARCHITECTURE
To compare divergence measures, we use K-ary Sketch to derive probability distributions. First, the time is divided into discrete interval T (e.g. T = 1 min). During each interval, the destination IP address (DIP), for each packet containing a SYN segment, is hashed by H hash functions. The resulted hash value by theithfunction (j = h
i(DIP )) is used as index of the associated counterSi,jwithDIP . In fact, the counter is shared with random destination addresses, because manyDIP may have the same hash value, and share the same counter. Each arriving SYN segment increments the associated counter. For the sake of simplicity, we will restrict our analysis to TCP SYN flooding by counting only the number of SYN, as many web services are based on TCP, and SYN flooding is the most used flooding attacks in these days. However, this approach can be used to detect flooding with any protocols (TCP, UDP, ICMP, etc.).
At the end of each epoch T , we derive probability distri-butions from Sketch. First, we get the sum of the counter in
each line, and the probabilitypi,j in each cell is calculated as the ratio of each counter to the total number of SYN:
pi,j= Si,j.Counter/ K−1X
j=0
Si,j.Counter (4) Each cellSi,j becomes a data structure, that contains: current counter, current and previous probabilities. Therefore, each line (or hash table) provides two probability distributions: the first one is from previous interval and used as reference distributionQi. The second one is from current intervalPi, and used to measure the divergence from the reference distribution, in order to detect anomalies. Divergence measures between the current (Pi) and reference probability (Qi) distributions is calculated for each line in the Sketch, at the end of each time interval (i.e. at n.T ). During malicious activities, the divergence measure D(Pi||Qi) produces spikes, and when more than L (L < H) divergences resulted from different hash tables exceed a dynamic threshold, an alarm is raised.
To detect deviations in the time series resulted from diver-gence measures, we derive a subsequent time series containing the values ofD(Pi||Qi) without spikes. In this last time series (without large values), we define a dynamic bound ofµi+ασi. Significant deviations are larger than the dynamic bound:
D(Pi||Qi) > µi+ ασi (5) Where D(Pi||Qi) is the divergence measure in the time interval n.T for the ith line in the Sketch, and µ
i &σi are the mean and the standard deviation respectively of smoothed time series that doesn’t contain spikes ( ˆD(Pi||Qi)). µi and σi are updated dynamically using the Exponentially Weighted Moving Average (EWMA):
µi= βµi−1+ (1 − β) ˆD(Pi||Qi) (6) σ2 i = βσ 2 i−1+ (1 − β)( ˆD(Pi||Qi) − µi) 2 (7) The threshold is updated dynamically with the value of µi and σi as shown in equations 6 & 7. α is a parameter used for calibrating the sensitivity of the detection algorithm to variations. It is also used to reduce the false alarm rate. Under normal traffic, divergenceD(Pi||Qi) falls inside the bound of µi+ 2σi. WhenD(Pi||Qi) exceeds the dynamically updated threshold overL lines, an alarm is triggered. Other interesting approaches for estimating and adjusting dynamic threshold were proposed in [9], [8] for SIP INVITE flooding detection.
V. EXPERIMENTAL RESULTS
In this section, we present the performance analysis results for integrating divergence measures over Sketch, for detecting SYN flooding attacks. As we want to compare 2 divergence measures (HD &χ2
) over Sketch for the detection of flooding attacks, we use real IP traces from MAWI [13] traffic reposi-tory. For the sake of simplicity, we focus our analysis on the detection of TCP SYN flooding attacks, as it is the widely used attack for DDoS in these days.
A. Dataset
We use the daily traces from samplepoint-F, collected on trans-Pacific line (150 Mbps) from 15/04/2010 07h30 to 16h00 as few hours in the life of the internet between Japan & USA. These traces are used to test the efficiency of divergence measures. IP addresses in the traces are scrambled by a modified version of tcpdriv [13] tool, but correlation between addresses are conserved. We analyze these 8h30 of wide area network traces using Sketch data structure, with a key of the Sketch (κn = DIP ), and a reward vn = 1 for SYN request only, and vn = 0 otherwise. We set the Sketch width K to 1024, and the number of hashH to 5.
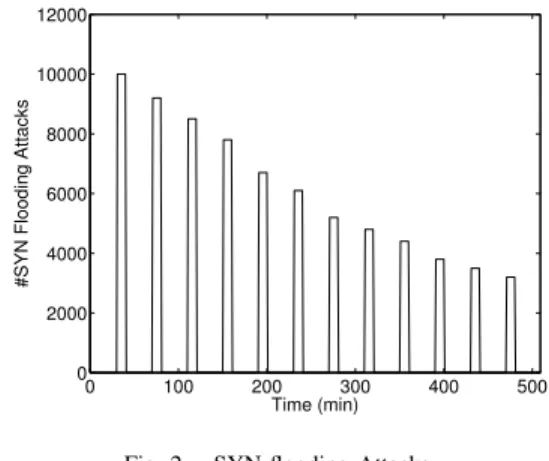
Afterward, we inject 12 real distributed SYN flooding attacks with different intensity inside this trace. These attacks are inserted each 30 minutes (on instants t=31, 71, 111, 127, etc.) and span for 10 minutes. These different intensity attacks are shown in Fig. 2. The first attack begins with a value of 10000 SYN/min and decreases exponentially until 3200 SYN/min. 0 100 200 300 400 500 0 2000 4000 6000 8000 10000 12000 Time (min)
#SYN Flooding Attacks
Fig. 2. SYN flooding Attacks.
Fig. 3 & Fig. 6 show the variation of number of SYN before and after the injection of SYN flooding attacks. By comparing these variations, we might not notice the differences between both figures without deep inspection. Inserted attacks don’t induce heavy deviations in the time series of the total number of SYN requests. Thus can be explained by the fact that the intensity of SYN flooding attacks is not large compared to the intensity of the total number of SYN segments. In such cases, the detection of attacks is very challenging, because no heavy changes in the time series describing the variations of the total number of SYN, and the intensity of the SYN flooding attacks is buried by the large number of SYN (as shown in Fig. 3) before attacks injection.
B. Evaluation strategy
In this section, we present the evaluation results of the application of these divergence measures on the IP traces. First, we begin our analysis by applying HD &χ2
divergence over the traces (before attacks injection). We set the dynamic threshold as given in Eq. 5. For the sake of clarity, we present the results over the first line of Sketch, where other lines exhibit similar variations.
100 200 300 400 500 2 4 6 8 10 12 14 x 104 Time (min) #SYN
Fig. 3. Total number of SYN.
100 200 300 400 500 0 0.05 0.1 0.15 0.2 Time (min) Hellinger Distance Hellinger Distance Threshold
Fig. 4. Hellinger Distance before attacks.
100 200 300 400 500 0 10 20 30 40 50 60 Time (min) Chi−square Divergence Chi−square Divergence Threshold
Fig. 5. Chi-square before attacks.
100 200 300 400 500 2 4 6 8 10 12 14 x 104 Time (min) #SYN
Fig. 6. Total number of SYN after attacks.
100 200 300 400 500 0 0.05 0.1 0.15 0.2 Time (min) Hellinger Distance Hellinger Distance Threshold
Fig. 7. Hellinger Distance after attacks.
100 200 300 400 500 0 50 100 150 200 250 Time (min) Chi−square Divergence Chi−square Divergence Threshold
Fig. 8. Chi-square after attacks.
Destination IP address Destination port
210.175.130.64 XX 211.174.112.130 110 211.174.112.135 110 211.174.110.34 110 211.174.110.53 110 211.174.88.200 110 202.68.36.5 443 TABLE I VICTIM SERVERS.
Fig. 4 & Fig. 5 show the variations of HD and Chi-square divergence, as well as the dynamic threshold (dashed line) before the injection of attacks. When the value of divergence measures is larger than threshold in at least 3 hash tables in the Sketch, an alarm is triggered. Therefore, we found that both measures detect anomalies at different instants (t=56, 111, 127, etc.). We verify these instants, and we found many existing anomalies (PortScan, flooding, NetScan). The IP addresses of victim servers and the destination port (unless for PortScan) are given in table I. XX is used to represent many ports. In fact, all these anomalies don’t span for more than few minutes. However, there are more anomalies that can be detected by using the source IP address as the key of the Sketch, but we will restrict our analysis to SYN flooding attacks. In fact, after the manual verification of traces, we found that HD triggers 4 false alarms, and the χ2
divergence achieves very high detection accuracy with 1 false alarm.
Afterward, we inject the SYN flooding attacks given in
Fig. 2 over the analyzed traces. We conduct the same analysis by applying HD and Chi-square divergence. In the case of HD with the dynamic threshold, we get (as shown in Fig. 7) 4 false alarms, with 100% of detection accuracy. In contrast, for the case ofχ2
Divergence, we get 1 false alarm (see Fig. 8), and spike intensity is proportional to the intensity of the attack. We found through our conducted experiments that Chi-square divergence performs better than HD in terms of reducing false alarm, with less effort for tuning the dynamic threshold. The intensity of raised spikes in Chi-square increases with the intensity of attacks and dynamic threshold becomes useless.
VI. CONCLUSION ANDPERSPECTIVES
In this paper, we analyzed the accuracy of 2 divergence measures (HD & Chi-square divergence) over Sketch data structure, for network anomaly detection. We compared their performances in terms of true positive and false alarm ratio, over real IP traces collected from backbone networks with in-jected real distributed SYN flooding attacks at known instants. Afterward, we used dynamic threshold for achieving the best trade off between false alarm and true detection. We found that HD achieves a good detection, but with higher false alarm ratio than Chi-square divergence. Furthermore, the intensity of trig-gered spikes by Chi-square divergence increases significantly with the intensity of attacks, and tuning the parameters of dynamic threshold is not required for anomaly detection. It is important to note that these divergence measures with Sketch are computationally efficient for handling traffic on high speed networks.
REFERENCES
[1] D. Moore, G. M. Voelker, and S. Savage, “Inferring Internet Denial-of-Service Activity,” in Proceedings of USENIX Security Symposium
(SSYM’01), 2001, pp. 9–22.
[2] H. Wang, D. Zhang, and K. G. Shin, “Detecting SYN Flooding Attacks,” in Proceedings of the IEEE Infocom’02, 2002, pp. 1530–1539. [3] V. A. Siris and F. Papagalou, “Application of Anomaly Detection
Algorithms for Detecting SYN Flooding Attacks,” in Proceedings of
IEEE Global Telecommunications Conference (GLOBECOM’04), vol. 4, 2004, pp. 2050–2054.
[4] W. Lu and A. A. Ghorbani, “Network Anomaly Detection Based on Wavelet Analysis,” EURASIP Journal on Advances in Signal Processing, pp. 1–16, 2009.
[5] S. Siripanadorn, W. Hattagam, and N. Teaumroong, “Anomaly detection using self-organizing map and wavelets in wireless sensor networks,” in
Proceedings of the 10th WSEAS international conference on Applied computer science (ACS’10), 2010, pp. 291–297.
[6] G. Nychis, V. Sekar, D. G. Andersen, H. Kim, and H. Zhang, “An Empirical Evaluation of Entropy-based Traffic Anomaly Detection,” in Proceedings of the 8th ACM SIGCOMM conference on Internet
measurement (IMC’08), 2008, pp. 151–156.
[7] J. D. Brutlag, “Aberrant Behavior Detection in Time Series for Network Monitoring,” in Proceedings of the 14th USENIX conference on System
administration (LISA’00), 2000, pp. 139–146.
[8] J. Tang, Y. Cheng, and C. Zhou, “Sketch-Based SIP Flooding Detection Using Hellinger Distance,” in Proceedings of the 28th IEEE conference
on Global telecommunications (GLOBECOM’09), 2009, pp. 3380–3385. [9] H. Sengar, H. Wang, D. Wijesekera, and S. Jajodia, “Detecting VoIP Floods Using the Hellinger Distance,” IEEE Trans. Parallel Distrib.
Syst., vol. 19, pp. 794–805, June 2008.
[10] O. Salem, S. Vaton, and A. Gravey, “A Novel Approach for Anomaly Detection over High-Speed Networks,” in Proceedings of the 3rd
Eu-ropean Conference on Computer Network Defense (ECND’07), vol. 30, 2009, pp. 49–68.
[11] G. Cormode and S. Muthukrishnan, “An Improved Data Stream Sum-mary: The Count-Min Sketch and its Applications,” J. Algorithms, vol. 55, pp. 29–38, 2004.
[12] M. Broniatowski and S. Leorato, “An estimation method for the Neyman chi-square divergence with application to test of hypotheses,” J. Multivar.
Anal., pp. 1409–1436, July 2006.