HAL Id: hal-00592014
https://hal.archives-ouvertes.fr/hal-00592014
Submitted on 10 May 2013
HAL is a multi-disciplinary open access
archive for the deposit and dissemination of
sci-entific research documents, whether they are
pub-lished or not. The documents may come from
teaching and research institutions in France or
abroad, or from public or private research centers.
L’archive ouverte pluridisciplinaire HAL, est
destinée au dépôt et à la diffusion de documents
scientifiques de niveau recherche, publiés ou non,
émanant des établissements d’enseignement et de
recherche français ou étrangers, des laboratoires
publics ou privés.
A new approach for centerline extraction in handwritten
strokes: an application to the constitution of a code
book
H. Daher, Véronique Eglin, Stéphane Bres, N. Vincents
To cite this version:
H. Daher, Véronique Eglin, Stéphane Bres, N. Vincents. A new approach for centerline extraction in
handwritten strokes: an application to the constitution of a code book. Document Analysis Systems,
Jun 2010, Boston, United States. pp.425-432. �hal-00592014�
A New approach for centerline extraction in handwritten
strokes: An Application to the constitution of a code book
H.Daher
PHD student
LIRIS UMR 5205 CNRS INSA de Lyon – 69621 Villeurbanne
Cedex
[email protected]
N.Vincents
Professor
Université René Descartes CRIP5 - Systèmes Intelligents de
Perception - 75270 Paris Cedex 06
[email protected]
V.Eglin
Senior lecturer
LIRIS UMR 5205 CNRS INSA de Lyon – 69621 Villeurbanne
Cedex
[email protected]
S.Bres
Senior lecturer
LIRIS UMR 5205 CNRS INSA de Lyon – 69621 Villeurbanne
Cedex
[email protected]
ABSTRACT
To obtain a good decomposition of handwritten strokes in manuscript images, the extraction of the medial axis represents a very important step. In this paper, we propose an automatic approach for the extraction of the median axis directly from the gray level images. This approach is based on the orientation and the stroke thickness analysis at different points of the handwritten shapes. This method is robust to degradations of the strokes, background noise and ink irregularities in the support paper. Then, we propose to consider all graphemes and to classify them from the analysis of median axis points. We use this decomposition to produce an identification scheme from various handwriting styles. This work is supported by the ANR GRAPHEM project.
Categories and Subject Descriptors
I.5.3 [Pattern recognition]: clustering – similarity measures.
General Terms
Algorithms, Measurement, Documentation, Performance, Design, Experimentation, Human Factors.
Keywords
Handwriting images, medial axis location, Hessian matrix, handwriting codebook.
1.
INTRODUCTION
The extraction of the centerline of lines contained in images represents a very important step in many research fields. For example in bioinformatics, the medial axis is used to follow a blood vessel or neurones. In fingerprint analysis, the medial axis is extracted to identification purposes. In satellite image analysis, the medial axis is used for road extraction. In manuscript image analysis, the centerline extraction represents a very important characterisation step that will allow us to compute the stroke thickness, to construct a graph that represents a specific shape or to decompose the strokes that form a letter. In this paper, we are interested in ancient Latin manuscripts from the Middle Ages. In this type of manuscripts we are faced to many problems such as the aging material and ink. In this paper, we propose to extract the centerline directly from the gray scale image, while the literature contains a lot of approaches that perform a binarization as an initial step making the localisation of the stroke easier. Thus, we differ from the methods used today by avoiding the conventional approaches that perform a thresholding and skeletonization of the image. There exist a lot of approaches in this domain that can improve the quality of the binarization and skeletonization algorithms. These methods give good results on regular or less degraded documents. But faced with problems of the aging ink and often poor quality of the documents, such approaches are not really suitable. This paper is organized as follows, section 1 introduces the different concepts of our study and presents the major contributions in the literature in relation with the skeletonization aspect and the extraction of the medial axis in handwritten strokes. Section 2 describes our major contribution in three sections: at first we will present the original algorithm of the ridge line following and we will validate it with respect to the performances that are estimated from the other skeletonization approaches that are most frequently used in the literature.Later on, we will describe in detail our stroke segmentation approach that is based on the stroke thickness which in turn is estimated at each point of the centreline. This section is followed by the construction of a code book from the segmented strokes by using Permission to make digital or hard copies of all or part of this work for
personal or classroom use is granted without fee provided that copies are not made or distributed for profit or commercial advantage and that copies bear this notice and the full citation on the first page. To copy otherwise, or republish, to post on servers or to redistribute to lists, requires prior specific permission and/or a fee.
DAS’10, June 9–11, 2010, Boston, MA, USA.
the following features: the standard deviation of the orientations at each point of the centerline and their main directions. In section 3 we will show how the constitution of a codebook for every manuscript might be used in the comparaison of handwritings by analyzing the variability between writers. To conclude this work, the section 4 gives a general overview of the decomposition and the analysis tool of the writings that we have chosen to focus on the centerline and announce the short-term prospects of these contributions.
2.
LITERATURE REVIEW
In this section we will present the previous centerline extraction methods:
- Morphological thinning: thinning is to gradually remove the
points of the contour shape, while maintaining its topological features. These methods require a prior binarization step of grayscale images. This can lead to a great loss of information when the documents are ancient and of poor quality [1] [2] and thus produce degraded binary lines: broken characters merged or biased (holes, noise). These degradations often distort the skeleton of the strokes and cause significant errors in their matching [3].
- Vornoï diagram: the skeleton of a continuous form is included
in the Voronoi diagram points on its border [4]. This approach is defined in a continuous space and produces a connected skeleton. The disadvantage of such methods comes from the difficulty of the sampling of contours that define the quality of the Voronoi diagram and the decomposition of the branches with the help complex stages of post-processing [5].
- Distance Transform: the distance map of an object is to
associate to every point its distance to the closest contour point. The local maximums of the distance map correspond exactly to the points of the skeleton of the object. Several distances were used in this context (Euclidean [6] [7], Chamfer [8], etc. mostly applied on binary images and also on grayscale images. With these methods the extraction of the skeleton is very sensible to the deformations of the contours that we usually encounter in our images.
- Heuristics: these methods are applied directly on grayscale
images using heuristics to set a large number of parameters that manage the detection of the medial axis. They were originally developed to extract the skeleton of fingerprints and their results are clearly robust and effective on degraded image than the two previous families [2] [9] We can also find the approaches in the domain of medical imaging as the work of Sun [10] that represented a geometric algorithm of line tracing on X-Ray images. This algorithm is known under the name of “Sun Algorithm”. [11] adapted this principle to tubular objects (blood vessels) on 3D grayscale images. The main disadvantage of this method is the absence of self adaption to changes in direction, the diameter and to overlapping and crossing problems of blood vessels or the lines on degraded images.
- Contour detection: These methods use the contour to navigate
along the lines and to detect the medial axis by correlation between a line and its two edges. In this context, an interesting iterative approach proposed in [12] to detect the center line in images of neurons. Other methods that are founded on the same principle are used for road tracing in satellite images [13] [14].
- New technologies have emerged including the wavelets [15], the partial differential equation (PDE) using diffusion fields [16], and the 3D approach [17]. These two approaches can skeletonize a grayscale image and avoid all the limitations related to the skeletonization of binary images. Such approaches require multiple iterations of smoothing, but it is more robust to degradations.
3.
CENTERLINE EXTRACTION
Our approach is directly applied on grayscale images of ancient manuscripts. It combines the aspects of the previous categories cited above offering a flexible tracing and a more precise detection of the mexial axis and robust to degradations. This is why we were insipired by the different skeletonization methods of blood vessels in medical images [18] [24]. The blood vessels have comparable properties to the ones of the black lines in handwriting this is why our methods was based on this type of methods.
- It uses the concept of Xu et al. to be able to navigate along the strokes and to extract the medial axis without the need of the contours. It takes into account the change of curvature of the trajectory at each point of the path where we must find the next point. It ensures good robustness to discontinuities encountered in the ancient manuscripts.
-It reinforces this tracing by the automatic initialization of the starting points of line tracing method, the closest possible to the ends of lines. In the method of Xu et al. the user must arbitrary initialize the starting points and directions. To avoid errors related to the intervention of the user and the difficult task of manual initialization, we use the skeleton that is obtained by the method of Zhang and Suen, [12]. This can also automatically associate to these points the radii and directions that are obtained by the method of Frangi.
-The part of the Frangi method that we use corresponds to the automatic, dynamic and progressive computation of the lines direction and the radius at each point of the path. These properties allow us to avoid the errors that are related to the manual choice of the directions and to avoid the rigidity of the tracing during the use of the fixed size radius imposed by the method of Xu et al. -We improved the method of Xu et al. by using at each point the combination of two complementary directions. a) Geometric direction to insure certain robustness to undesirable bifurcation and crossing situations. b) Intensity Direction that guarantees a tracing that is robust against sudden direction changes or thickness along the lines. We also used a dynamic size window to find the next point that will belong to the medial axis. The size of this window varies automatically depending if the situation is a bifurcation, crossing or a straight line.
(a) (b)
Figure 1. (a) The Look-ahead distance dk between the points
Pk and Pk+1, (b) Line tracing and extraction of the medial
3.1
Preprocessing
This part is to explain the various stages of pre-processing that have been applied on images before moving on to the stage of feature extraction. In this step, we use the method of Frangi [18]. This method has the advantage of preserving the different structures of the image, even the images that represent degraded structures. In our work, our contribution addresses the extraction of the centerline in black lines that have similar properties fto blood vessels. This approach will particularly enable us to calculate the radius at each point of the image and will be used to decompose the characters into distinct fragments. To initialize the method, we proceed to a convolution of the image with the classical second derivative of Gaussian Gxx, Gxy, Gyy. Then, we construct the Hessian matrix: the authors showed that eigenvalues of the Hessian matrix that verifies the following properties (
λ
1≤
λ
2 andλ
1≈
0
) will indicate the ideal structure of a black line. The value of the radius is then computed to maximize the function V0 defined as follows: The function V0 is a product ofexponential functions according to different scale values s (sigma). − − − = 2 2 2 2 0 2 exp 1 2 exp 0 ) ( c S R s V β β Where V0 = 0 for
λ
2>
0
, 2 1λ
λ
β=
R
,s
=
λ
1+
λ
2, c which is the norm of the hessian matrix (Frobenius) and beta are used to control the sensibility of the filter, the ratioR
β represents the eccentricity. The norms
(Second order structureness) is small when we are in the background with eigenvalues individually small for the lack of contrast. In regions with strong contrast this norm will increase will increase with the presence of at least one of the eigenvalues with greater amplitude. For each value of sigma, we have for each pixel of the image, a matrix that contains the values of the function V0 that are represented byψ
. We do the same for the maximum Eigen valuesλ
2, and for the directions that are calculated from the eigenvectorsI ,
xI
ywhere the direction at each point is equal toarctan
2
(
Ix
,
Iy
)
. After having constructed the different matrices for each sigma we compare the values ofψ
. The maximum value ofψ
for each pixel will allow us to extract the maximum value of sigma that represents the value of the line thickness on a given point, if for example the maximum value ofψ
is the one ofσ
1
then the radius will be equal toσ
1
.3.2
Extraction of the starting points
For the identification of starting points, we extract the skeleton using the method of Zhang and Suen [19] and we locate the end points of the strokes in the skeleton. These points will correspond to the starting points if each segment and we will be extracted them by using the following approach:
= 0 0 0 0 1 0 0 s
The structuring element s was applied on the skeleton by using the hit and miss operator. s was used in each of his 45° of rotation. These points will serve as starting points for our method of extraction of the medial axis. These points will contain: the principal direction and the thickness of the stroke (see Figure 1).
Figure 2. Example of starting points
3.3
Stroke tracing algorithm
The steps of our method of tracing and detection of the medial axis are summarized in the following algorithm:
a) Initialization
- Detect the starting points by using the skeleton of Zhang, - Extract their radius,
- Start from one of the points of departure and determine the next point 0
1
k
P+ by using
k
d « Look ahead Distance », and compute its
direction 0 1
k+
Ψ ,
b) Determine the next point and adjust its position
- Draw a density profile gk+1 perpendicular to the direction of the point 0
1
k P+,
- Update the direction to 1 1
k+
Ψ to find the next point 1 1
k
P+
- Proceed in the same way by computing the density profile at the point 1
1
k
P+to find the point Pk+1, focal point in the centerline, and
compute its directionΨk+1,
- Mark this point as a visited point, this way it will not be visited again by our tracing algorithm.
c) Stopping criteria
- If we find a bifurcation point and that point has already been visited, we stop the tracing process if we come at a point that is marked as starting point, and this point will be removed from the starting points list.
- Reiterate the process along the ling until a stopping criterion is met.
3.3.1
Tracking direction
To compute the tracking direction we used a combination of both the geometric direction and the intensity direction. By using a single type of direction, we might have been confronted with difficulties related to sudden changes of direction or diameter (thickness) at different points P calculated from the centerline and which are related to overlapping or superposition of strokes or degradation of the image. The geometric direction is defined as the direction of the current point to the new point. It is estimated and corrected. The successive estimations and corrections, for each point
P
0k+1,P
1k+1andP
k+1will lead to a geometricdirection that is defined as follows: k k k k k P P P P − − = + + + ∧ 0 1 0 1 0 1 µ k k k k k P P P P − − = + + + ∧ 1 1 1 1 1 1 µ , k k k k k
P
P
P
P
−
−
=
+ + + ∧ 1 1 1µ
,The geometric direction, as indicated by the name, is largely determined by the vessel’s geometrical topology. When there is, for example, an abrupt change in curvature from
P
k toP
k+1, tracking using geometric direction alone, may cause great deviations. To solve this problem we combined the geometric direction with the intensity direction. The Hessian matrix is defined as follow: = Iyy Iyx Ixy Ixx HWhere
I
uv represent the convolution of the image with a second order derivative Gaussian function. From the Hessian matrix we will extract the eigenvalues. Considering that the strokes are darker than the background, we define the intensity direction as the Hessian eigenvector corresponding to the smaller eigenvalue. The direction of sequential tracking is maintained by multiplying the Hessian eigenvector by the sign of the dot product of it and the current tracking directionψ
k,that the obtained intensity direction always points to the subsequent sections along the vessel. Letλ
1andλ
2be the eigenvalues of the Hessian at point1
+
k
P
and values are ordered such thatλ
1≤
λ
2 , andv
1 and2
v
be the corresponding eigenvectors. ForP
k+1, the intensity direction is defined ash
k 1sign
(
kv
1)
v
1∧ +
∧
=
ψ
similarly, we can obtain intensity directions forP
0k+1andP
1k+1, denoted by0 1 + ∧ k
h
and 1 1 + ∧ kh
respectively. Image degradation and overlapping strokes, makes the intensity distribution to exhibit rather complicated proprieties and hence tracking in virtue of the intensity direction alone would encounter great difficulties. In our proposed algorithm, tracking directions are updated using a weighted combination of aforementioned geometric directions and intensity directions: 0 1 0 1 0 1(
1
)
+ ∧ + ∧ + ∧−
+
=
k k kα
µ
α
h
ψ
, the same for1 1 + ∧ k
ψ
et +1 ∧ kψ
.Whereα
is a weighting factor and0
≤
α
≤
1
.5
.
0
=
α
achieved good results.3.3.2
Look ahead distance
The look-ahead distance is used in the estimation step of the point
P
0k+1 . The look-ahead distance is adapted to the changeof curvature encountered in the strokes. It is defined as follows:
k k
k R
d = ρ(π −θ ) Where
θ
k stand for the direction difference between the current and previous centerline points on the current trace segment.θ
k Provide the information of curvature change on the local stroke segment. When the curvature change is small, the value ofθ
k is small, and vice versa.) ( −1 ∧ ∧ − ∠ = k k k
ψ
ψ
θ
.3.3.3
Intensity profile and dynamic search window
Matched filtering is used in the correction step to obtain the new centerline point. A point on the intensity profile whos filtering output reaches maximum is identified as the centerline point. For matched filtering, the search window size plays an important role. The main idea of using a window size is dynamically is to cope with different geometric configurations that may be encountered during the line following algorithm. In regular cases we have
k
R
T =1.5∗ , such a window size also would allow distortions and inflexions to be adequately dealt with. In a bifurcation case we will have T = 4∗Rk so that both the strokes are included in the search range. As a result, a centerline point on one stroke would be identified anyway and the tracking procedure would continue along that stroke. In order to determine the type of geometrical configuration for a new centerline point, we assume a two-step approach; at first we try to distinguish the overlapping situation from the other cases. We first introduce a normalized gray scale parameter
τ
for each centerline point.1 + k
τ
is defined as ) 1 ( ) 1 ( ) 1 ( max min max 1 + + − + = + k I k I k I k τ .Where
I
maxandI
minrepresent the maximum and minimum on the intensity profile acrossP
k+1, respectively. In the overlapping case we haveτ
k+1≥
βτ
0, whereτ
0 represents the value ofτ
in the previous segment. In our case we usedβ
=
1
.
5
. When0
1
βτ
τ
k+≤
the situation is considered to be either normal or bifurcation, and it is further classified using the previous radius informationR
k−2,R
k+1, andR
k. IfR
k−2≤
R
k−1≤
R
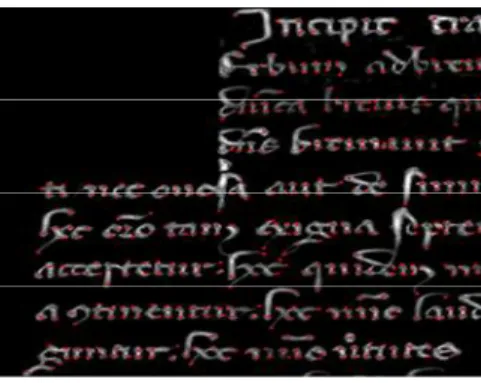
k, which means that the stroke under investigation is becoming wider, the situation is considered to be bifurcation; Otherwise, the situation is considered to be normal.Figure 3. Centerline extraction example (crossing and ink degradations)
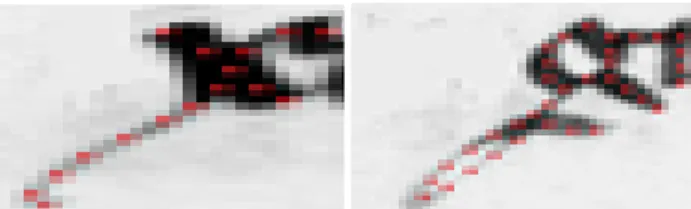
In Figure 1(a) we considered the situation of intersection encountered in the manuscripts and the situation of degradation of the ink. One can see that the approach is efficient for the extraction of the centreline where the ink is the most degraded. Similarly, in figure 1(b) we can notice that the centreline extraction is correct in the writing especially on the part where the ink impregnation is very bad. We tested the algorithm on medieval manuscripts in which the strokes are degraded and it is difficult to extract with a standard skeletonization algorithm. In Figure 3 we present the results of the extraction of medial axis in our approach. The first column contains the results of our method. One can see that we could extract the medial axis even in situations where the ink was degraded. The second column represents the result of binarization by the method of Sauvola chosen because it gave better results on the degraded ancient documents, [20].
a
b
c
Figure 4. Medial axis extraction by, (a) our method, (c) the method of Zhang, (b) binarization by the method of Sauvola,
For skeletonization, we used the method of Zhang and Suen [19] which is very efficient in computation time and robustness to noise. In total, we tested more than 8 skeletonization methods that provided noisier and less accurate results in terms of location of the skeleton than the method of Zhang. If we compare the results obtained by skeletonization with our results, we can see that the degraded strokes have disappeared, which will cause an important loss of information. We can see that the result of locating the medial axis allows a very precise localisation of the end of strokes that are confused with the background, compared with a binary or grayscale skeletonization which often truncates the late forms inadequately contrasting.
4.
GRAPHEMES EXTRACTION METHOD
In paleography, the implementing rules of writing are very strict because of the high specificity of feathers and arrows, used to produce shapes, some letters and letter combination can be produced only by a single dynamic execution. It was therefore necessary in this study to take into consideration the specifics of implementation to produce a coherent decomposition of forms,
including avoiding certain gestures cusp (backward movement of the pen). From a methodological point of view, the segmentation of strokes is performed as follows: between each start and stop, all the points involved in the formation of a stroke will be saved in a list with their directions and the thickness. The points of minimum thickness (local minimum) are then marked and offered as a point of cutting, as is the case in the formation of a line, see Figure 5. In this figure, each segment has a different coloration. We identify by this approach the crossing areas, points where the feather has been raised or where the feather has been put (see zoom in Figure 4). The decomposition of Figure 4 shows that the letters are formed from adjacent fragments attached to points of minimum thickness assumed to correspond to the points of raising and posing of the feather. This decomposition has been subject to the validation experts paleographers and has obtained their approval.
Figure 5. Decomposition of segments into graphemes
5.
CONSTRUCTION OF THE CODEBOOK
From all glyphs extracted from the previous step, we will proceed with the construction of our code book. Thus we produce a vectorized description of the glyphs, which is then processed to define the criteria of similarity. We have chosen to differentiate ourselves from the texture characterization approaches that are commonly used on homogeneous blocks of text, [23] [22], or from the differential characterizing approaches [21]. We have focused on analyzing the glyphs individually. The choice of characteristics is a key point for the final quality of the algorithm. Because graphemes can have variable sizes, the next step is to describe the images by a vector of characteristics of fixed dimension. The estimates of these descriptors are translated into real values and each is supposed to describe a property of forms such as:
•The roundness of the glyph (curvature vs. linearity). •The size of the glyph ( width,height)
•The area occupied by black pixels
•The direction of the glyph (dominant orientation) •Deviation of directions
•The average thickness of horizontal and vertical lines (these values are estimated on the entire image).
•The average number of horizontal and vertical lines ( transition between black and white pixel on a column of the image) •The maximum curvature
We consider each glyph of the image to be represented by a vector of characteristics consisting of the ten previous descriptors. These descriptors define a feature space where each glyph is represented by a point. For the classification of glyphs, we chose the algorithm of K-means. The final position of the centers of classes given by the K-Means will represent a signature for a given document. For the compilation of this code book, the number of classes is fixed before the classification stage. We used 25 classes for the classification of documents that are presented in this article.
Figure 6. Classification of the graphemes into 25 clusters
Each document is then represented by its code book of at most 25 clusters. We estimate the similarities between documents described by means of these signatures by computing a distance between the signatures. The distance d (D1, D2) between D1 and
D2 is calculated by the distance of each of the centers of the 25
clusters of D1 to the nearest neighbour of the centers of D2. The
distance d (D2, D1) between D2 and D1 is most often different. We
take as symmetric distance between D1 and D2, the larger of the
two distances d(D1, D2) and d(D2, D1). document D1 is
represented by n1 centers of classes (barycenters) 1
i
C and D2 is
represented by n2 centers of classes (barycenters) 2
j C , with
1
1≤ i≤ n and 1≤ j ≤ n2. The distance from D1 to D2 is:
) , ( min ) 2 , 1 ( 1 2 1 1 1... 2 j i n i j n C C d D D dist
∑
= = = , Where ( 1, 2) j i C Cd represents the Euclidean distance between two centers of classes in their representation space.
6.
COMPARAISON EXAMPLES
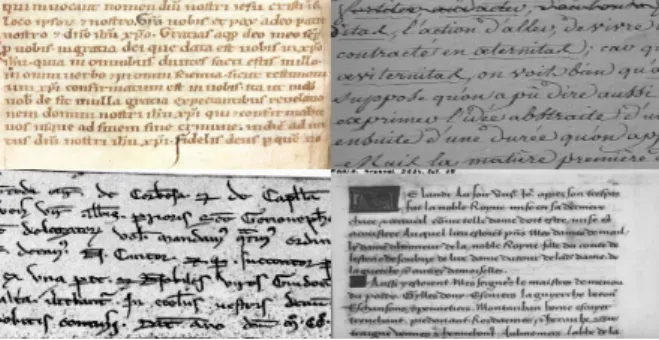
To illustrate this distance and the estimation of the similarity of document or writing, we present in Table 1 below the estimated distances between different samples extracted from handwriting documents of 4 classes. The documents in classes 1, 3 and 4 come from the same period but have been written by different writers. The distance between samples is a great indicator of visual similarity between writing family. Figure 5 below shows a copy of each of these 4 classes. The first image (top right) shows a copy of Class 1, the second shows us a copy of Class 2 and so on.
Figure 7. Example of 4 classes of manuscripts.
Tableau 1. Comparaison table between the 4 classes
In Table 1, we have projected the distance between the various documents. Cxy refers to the document y of the class x. From these
values we can deduce that documents of the same class have a greater similarity (lowest distance) that documents from different classes. In addition, documents of class C2 have a lower similarity
with other classes, which verifies our hypothesis that the class C2
is a time and a writing style very different.
7.
CONCLUSION
We showed that our method of medial axis extraction gives better line following results than the conventional methods of skeletonization which still allowed us to save time in the analysis and to work directly on the complete non threshold shapes (no binarization steps). Degraded strokes were taken into account in our method and we were able to extract the centerline in areas where it is difficult to do with the other methods. Similarly, our method allowed us to work directly on grayscale images without going through the stages of preprocessing, which still allowed us to save time in the analysis. With the segments that are extracted, we construct a set of glyphs that we regroup in a codebook by class similarity. These classes are then used as the signature of each document. We mainly use this method for classification of ancient documents, depending on their origin and type of writing class. However, we are also testing an extension of this algorithm on modern manuscripts, for which the decomposition glyphs pose specific problems and where objective is to identify the writer of the document.
8.
REFERENCES
[1] Lee D., Lee S.W., A new methodology for gray-scale character segmentation and recognition, ICDAR, vol. 1, pp.524, 1995.Ding, W. and Marchionini, G. 1997 A Study on Video Browsing Strategies. Technical Report. University of Maryland at College Park.
[2] Maio, D. Maltoni, Direct Gray-Scale Minutiae Detection in Fingerprints, IEEE Transactions on PAMI, vol. 19, n°. 1, pp. 27-40, 1997.Tavel, P. 2007 Modeling and Simulation Design. AK Peters Ltd.
[3] Suh et al. Stroke extraction from gray-scale character image, Progress in Handwriting Recognition 593-598, 1997. [4] Schmidt M., Some ex. of algo. analysis in comput. geometry
by means of math. morphology techniques” Geometiy anJ Robotics , Boissonnat and Laumond ed., Lecture Notes in Computer Se., 391, Springer-Verlag, Berlin (1989). [5] Attali D., Squelettes et graphes de Voronoi 2D et 3D. PhD
thesis, Université Joseph FOURIER, Grenoble I, 1995. [6] Danielsson P.E., Euclidean Distance Mapping, Computer
Graphics and Image Processing, vol. 14, pp. 227-248, 1980. [7] Choi et al., Extraction of the Euclidean skeleton based on a
connectivity criterion, Pattern Recognition, Volume 36, Issue 3, 2003.
[8] Rosenfeld A. and J.L. Pfalz. Distance Functions on Digital Pictures, Pattern Recognition, vol. 1, pp. 33-61, 1968. [9] Yaxuan Qi. Fingerprint Ridge Line Reconstruction.
Intelligent Information Processing, pp. 211-220, 2004. [10]Sun Y., Automated identification of arterial contours in
coronay arteriograms by an adaptive tracking algorithm,IEEE Trans. Med. Imaging , vol. 8,pp. 78-88,1989.
[11]Aylward S.R., Bullitt E., Initialization, noise, singularities, and scale in height ridge traversal for tubular object centerline extraction, IEEE Trans. Med. Imaging, vol. 2, pp. 61-75, 2002.
[12]Zhang Y. et al., A novel tracing algorithm for high throughout imaging Screening of neuron-based assays, J Neurosci Methods 160, pp. 149–162, 2007.
[13]Peteri R. et al., Detection and extraction of road networks from high resolution satellite images, International Conference on Image Processing, vol.1, pp I-301-4, 2003.
[14]Poz D. et al., Automated extraction of road network from medium and high-resolution images, Pattern Recognition and Image Analysis, vol. 16, n°. 2, pp 239-248, 2006.
[15]Y.Xinge, Tang, Y.Yuan,Zhang, W.P.Wei-Peng, Sun, L.Lu,Skeletonization of Character Based on Wavelet Transform, CAIP03(140-148).
[16]Cheriet M., Doré V., Amincissement-sans-segmentation et rehaussement des images de niveau de gris par un filtre de chocs utilisant des champs de diffusion, I-Revues,Traitement du Signal, 2006 - Volume 23, TS - Numéro 1 -2006. [17]Sanniti G., BAJA DI., NYSTRÖM I., 2D Grey-level Skeleton Computation: A Discret 3D Approach, 17th International Conference on Pattern Recognition(ICPR’04), Vol. 2, Août 2004, p. 455-458.
[18]A.F. Frangi, W.J. Niessen, K.L. Vincken, and M.A. Viergever, “Multiscale Vessel Enhancement Filtering,” Medical Image Computing and Computer-Assisted Intervention (MICCAI '98), pp. 130-137, 1998.
[19]T.Y. ZHANG et C.Y. SUEN : A fast parallel algorithm for thinning digital patterns. Communications of the ACM, 27(3):236–240, mars 1984.
[20]Stathis, P. Kavallieratou, E. Papamarkos, N, “An evaluation survey of binarization algorithms on historical documents” Pattern Recognition, 2008. ICPR 2008. 19th International Conference on Publicationm 2008.
[21]Dong-June Lee, Seong-Whan Lee, "A new methodology for gray-scale character segmentation and recognition," icdar, vol. 1, pp.524, Third International Conference on Document Analysis and Recognition (ICDAR'95) - Volume 1, 1995. [22]T. Wakahara, Y. Kimura, A. Tomono, Affine-invariant
recognition of gray-scale characters using global affine transformation correlation, IEEE Trans. Pattern Recognition Mach. Intell. 23 (2001) 384–395.
[23]Suh, J.W.;Kim, J.H.;Downton, A.C.(ed.);Impedovo, S.(ed.)Stroke extraction from gray-scale character
image;Progress in Handwriting Recognition 593-598, 1997. [24]Xu Y. et al., An improved algorithm for vessel centerline
tracking in coronary angiograms, Computer Methods and Programs in Biomedicine, Vol. 88, n° 2, Pages 131-143, 2007.