HAL Id: hal-02379853
https://hal.archives-ouvertes.fr/hal-02379853
Submitted on 25 Nov 2019HAL is a multi-disciplinary open access archive for the deposit and dissemination of sci-entific research documents, whether they are pub-lished or not. The documents may come from teaching and research institutions in France or abroad, or from public or private research centers.
L’archive ouverte pluridisciplinaire HAL, est destinée au dépôt et à la diffusion de documents scientifiques de niveau recherche, publiés ou non, émanant des établissements d’enseignement et de recherche français ou étrangers, des laboratoires publics ou privés.
Effect of relative humidity on the evaporation of a
colloidal solution droplet
Anisha Keshavan, Anna Hoang, Guillame Berteloot, Laurent Limat, Pirouz
Kavehpour
To cite this version:
Anisha Keshavan, Anna Hoang, Guillame Berteloot, Laurent Limat, Pirouz Kavehpour. Effect of relative humidity on the evaporation of a colloidal solution droplet. European Coating Symposium, ECS 2011, Martti Toivakka, Jun 2011, Turku, Finland. pp.202. �hal-02379853�
Effect of relative humidity on the evaporation of a colloidal solution
droplet
Anisha Keshavan1, Anna Hoang1, Guillame Berteloot1, Laurent Limat2 and Pirouz Kavehpour1 1Complex Fluids and Interface Physics Laboratory, Department of Mechanical and Aerospace Engineering,
UCLA, Los Angeles, CA
2Universiter Paris Diderot, Paris, France Corresponding author: [email protected]
Keywords: Relative Humidity, Colloids, Evaporation Background
The deposition of uniform layers of colloids on a solid surface is a major challenge for several industrial processes such as glass surface treatment and creating optical filters. One strategy involves the deposition of the colloids behind a contact line that recedes due to hydrodynamic reasons and evaporation (drying). The interaction between deposition, evaporation and hydrodynamics is a complex matter. We need to get a better understanding of the mechanisms at the contact line and the role they play in coating an organized deposit [1].
A simple way to coat a solid substrate is by allowing a droplet to dry on the substrate. This has been studied on a macroscopic scale [2, 3] and it was found that evaporation diverges at the contact line, explaining the famous “coffee stain” problem [3]. A high evaporation rate drives particles to the contact line and the particles form a ring as the droplet is drying. Excluding the case of polymer deposition [4] and drying micelles [5], the only available microscopic visualization of the
growing deposition was made by Berteloot et al[6]. They found that the deposit grows in several distinct phases, each its own dynamics. In the first phase, the deposit width and height grew with time following a power law of t2/3. A simple model was built where the particles are driven balistically to fill a wedge of constant contact angle. At larger time scales, the structure of the deposit becomes more complex, the front velocity increases and a “skin” is thought to float at at the free surface of the drop. Additionally, the pattern formations that were observed in later stages of growth were attributed to shear-banding or buckling induced by mechanical constraints by the flow. Finally, the deposit fractures and delaminates, as reported by other authors [7,8].
Our present work is an extension of the work of Berteloot et al. In the previous study, the evaporation rate was not controlled. Now we have factored in changes in relative humidity as a determinant of the spreading parameters. A humidity chamber is utilized to control the percent relative humidity of the environment in order to control the rate of evaporation of drop. The microscopic deposit growth,
deposit pattern, and drop height over time as a function of relative humidity is studied.
Materials and Equipment Setup
The colloidal solution that we used was 50R50 Klebosol silica slurries, which were diluted with distilled water to 5% concentration in volume. Untreated VWR micro coverglass No.1 glass slides were used for the substrate. The drop was observed by using a Nikon Eclipse TE-2000S inverted microscope using 2x, 10x and 20x magnification. NIS-elements software was used to capture a video of the deposition growth and to extract the deposit pattern.
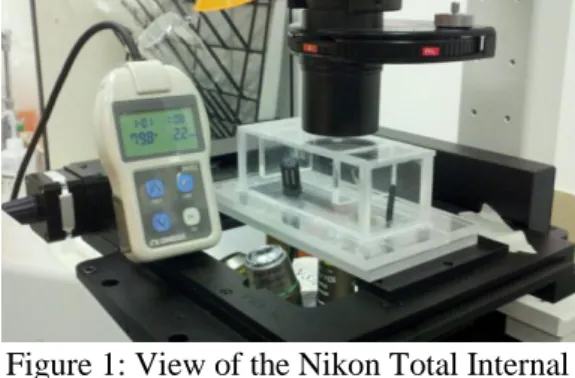
Figure 1: View of the Nikon Total Internal Reflection Flourescence microscope with
plexiglas humidity chamber and Omega RH32 humidity reader.
Figure 2: Kruss Drop Shape Analyzer 100 with
attached humidity chamber
A humidity chamber was constructed from Plexiglas with inserts for dry airflow and an Omega RH32 humidity reader, shown in figure 1. The relative humidity was controlled manually by adjusting the flow rate of dry air into the chamber as the
experiment ran. The relative humidity and temperature readings were recorded for each frame.
The Kruss Drop Shape Analyzer 100 (DSA) along with a humidity controlled chamber, shown in figure 2, was used to capture the profile of the drop and deposit. A drop of the silica particle solution was deposited on a glass slide inside the Kruss humidity chamber. A video of the profile of the drop was recorded by the DSA as the drop evaporated.
Results
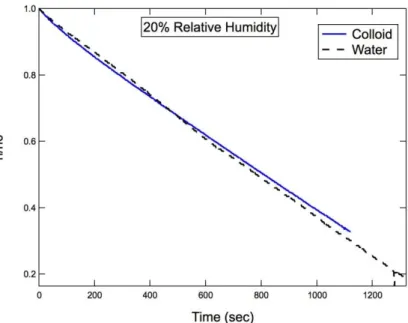
Teh DSA has a camera that takes a video of the profile of the drop inside the humidity chamber. Figure 3 shows the evolution of the drop profile over time. The DSA software fit the drop profile to a conic section and measured the height of the drop. The result is compared to a drop of pure water drying under the same rate of evaporation, shown in figure 4. Because we are looking at the side profile of the drop, we can only see the height of the outer border of nano-particles and not the growing deposition front or the deposition structure.
The Nikon microscope was used to measure the growing deposition front with 2x magnification. Initially the drop has no visible colloidal deposition, but after some time a deposition front is visible, along with the same pattern formations, shown in figure
5. These were the same patterns that were observed in previous studies[6].
Figure 3: Side profile of the evaporating colloid drop
Figure 4: Normalized Drop height over time, where h0 was the initial height of the drop
Figure 5: Figure a shows the deposit growth from the initial drop radius. Figure b shows the fracture of the deposit after it has completely dried.
(a)
(b)
(c)
Plots of the inner drop radius over time were normalized by the follow-ing equations:
(1)
– (2)
Where x is the measured deposit length, t0 is the time before the
depos-it fractures and x0 is the distance from
the initial radius to the final inner ra-dius of the drop before fracture. The result is plotted in figure 6.
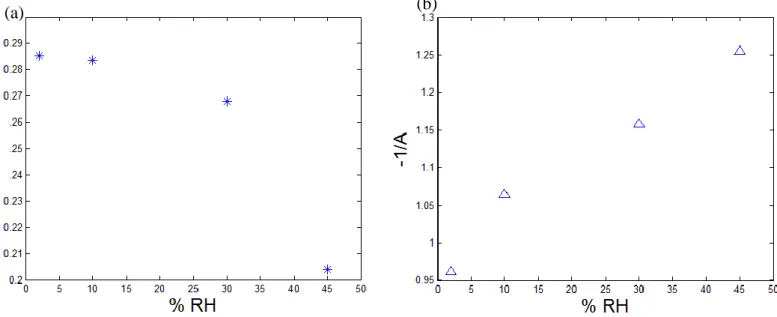
The normalized values were fit to the exponential function
(3)
where Y0 was held constant at 1 for each drop. Figure 7 shows the variation in A and τ over a range of
rela-tive humidities.
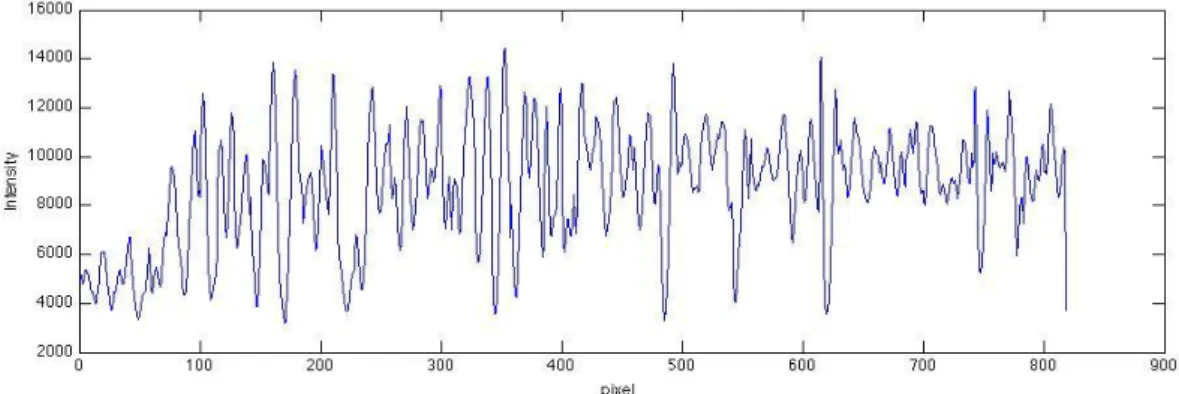
Next, the patterns of the dry deposit were observed with 10x magnification using the NIS elements software, and the intensity profile of the patterns left by the colloid was extracted (figure 9). The profile was divided into 8 sections so that we can see how the wavenumber changes in relation to radial distance. The wave-number of the patterns was computed using the fast Fourier transform for each section and then taking a weighted average of the wavenumbers. As shown in figure 10, the frequency of the pattern does not change significantly with distance from the outer radius. However, relative humidity does have an effect on the wavenumber. An increase in relative humidity corresponds to a higher wavenumber.
Summary
We investigated the location of the drying front (deposition front), drop height and deposition pattern as it varies with time as a function of relative humidity. The slope of drop height as a function of time was larger for the colloid than for the drop of pure water. Further experiments will be conducted for varying levels of relative humidity.
Figure 6: The normalized inner radius, X* against normalized time, t*
Figure 7: Figure a shows how the constant 1/τ in the exponent of equation 3 varies with relative humidity. Figure b shows the variation of -1/A with RH.
(a)
(b)
0.00E+00 1.00E+05 2.00E+05 3.00E+05 4.00E+05 5.00E+05 6.00E+05 7.00E+05 1 2 3 4 5 6 7 8
W
av
en
u
mb
er
(1/
m)
Section Number 10 % RH 20 % RHThe Nikon micoscope was used to record the growth of the colloid deposition over time under 2x magnification. We expected the radius to follow a power law similar to the previous findings by Berteloot et al, but instead we found that the data fit better to an exponential function. The previous study used a 10x lens and only recorded the earlier stages of deposit growth, wheras we used a 2x lens and captured the entirety of the drying patter includ-ing the later stages. The coefficients of the exponential function were found to vary inversely with relative hu-midity.
Finally, the patterns of the deposit were analyzed with a discrete Fourier transform. We found that the wave-number does not vary signifcantly across the radius of the deposit, but the wave wave-number of the pattern is larger for drops evaporating under higher RH. In the future, more deposit patterns will be analyzed under a larger range of RH.
References
1. Y. Koh and C. Wong, Langmuir 22, 897-900 (2006)
2. E. Adachi, A.S. Dimitrov and K. Nagayama, Langmuir 11, 1057 (1995)
3. R. Deegan, O. Bakajin, T. Dupont, G. Huber, S. Nagel and T. Witten, Nature 389, 827-828 (1997) 4. Y. Jung, T. Kajiya, T. Yamaue and M. Doi, Jap. Journal of App. Physics 48, (2009)
5. X. Liu, Y. Guan, Z. Ma and H. Liu, Langmuir 20, 10278-10282 (2004) 6. G’s paper!
7. L. Pauchard, Europhys. Lett. 74, 188 (2006) 8. W. Man and W. Russel, Phys Rev. Lett. 100, (2008)
Figure 8: Pattern left from colloid deposit under 10% RH
Figure 10: Wavenumber of the pattern is plotted against the sections of the intensity profile. Section 1 is the section that is furthest away from the center and section 8 is the last section of the intensity
profile, closest to the center of the drop. Figure 9: Intensity profile from figure 8