FRESHWATER LENS DYNAMICS IN ARID REGIONS
:
APPLICATION TO THE
M
ERTI AQUIFER
(
EASTERN
K
ENYA
)
PhD thesis presented at the Centre for Hydrogeology
and Geothermics of the University of Neuchâtel
For the degree of
Doctor in Science
by
Lucien Blandenier
Defended on September 2, 2015
Accepted by the following Jury:
Prof. Pierre Perrochet, director, Université de Neuchâtel Dr Ellen Milnes, co-director, Université de Neuchâtel Prof. Philip Brunner, co-director, Université de Neuchâtel Prof. Rachida Bouhlila, Ecole Nationale d’Ingénieurs de Tunis Prof. André Mermoud, Ecole Polytechnique Fédérale de Lausanne
Rue Emile-Argand 11 2000 Neuchâtel - Suisse Tél: + 41 (0)32 718 2100 E-mail: [email protected]
Imprimatur pour thèse de doctorat www.unine.ch/sciences
IMPRIMATUR POUR THESE DE DOCTORAT
La Faculté des sciences de l'Université de Neuchâtel
autorise l'impression de la présente thèse soutenue par
Monsieur Lucien Blandenier
Titre:
“
Recharge quantification and continental freshwater
lens dynamics in arid regions: application to the
Merti aquifer (eastern Kenya)”
sur le rapport des membres du jury composé comme suit:
- Prof. Pierre Perrochet, Université de Neuchâtel, directeur de thèse
- Prof. Philip Brunner, Université de Neuchâtel, co-directeur de thèse
- Dr Ellen Milnes, Université de Neuchâtel, co-directrice de thèse
- Prof. Rachida Bouhlila, Ecole Nationale d’Ingénieurs de Tunis, Tunisie
- Prof. André Mermoud, Ecole Polytechnique Fédérale de Lausanne, Suisse
Abstract
The Dadaab refugee camp, the largest refugee camp in the world with a population of approximately 400’000 persons, is located in the arid to semi-arid eastern Kenya, close to the Somali border. The only permanent water resource for the refugees and the host communities comes from the Merti aquifer which consists in a large continental freshwater lens of 250 km by 50 km surrounded by salty water. The increasing groundwater abstractions as well as signs of increasing salinity and uncertainty on the water level depletion led to the necessity to better characterise the aquifer recharge and the dynamics between the freshwater lens and the surrounding salty water.
Firstly, a new methodology was developed for quantifying the concentrated groundwater recharge through a physically-based coupled surface/groundwater numerical model reproducing inundated surfaces during flood events which is calibrated with inundated surfaces derived from satellite images. Secondly, the dynamics of freshwater lenses are investigated with a series of synthetic numerical models. These models aim to analyse the effect of the recharge rates and mechanisms (rainfall, concentrated recharge) on the freshwater lens geometries and to compare these geometries with the observed geometry of the freshwater lens of the Merti aquifer. These two approaches are cross-validated owing to a groundwater monitoring network of twenty high time-resolution devices installed over the whole freshwater lens in September 2013. Finally, results from these three axes are combined in a regional numerical model.
The approaches developed in this study allowed to quantify a concentrated groundwater recharge to be between 195 and 329 x 106 m3/y. Diffuse recharge contributing to the freshwater lens is estimated to be between 12 and 62 x 106 m3/y. Compared to these recharge rates, the current groundwater extraction (about 4.8 x 10⁶m3/y), is considered as sustainable on the regional scale. However, this recharge is about 50 to 100 higher than the axial flow estimated with the gradient and the transmissivities obtained with pumping tests. This discrepancy led to postulate the presence of a multi-layer aquifer much thicker than the currently exploited horizon but with uncertainties on its thickness and the vertical salinity gradient.
The synthetic numerical model revealed a very high inertia of the Merti aquifer and confirmed that the recharge of the aquifer is mainly controlled by concentrated recharge on flood plains in the upstream area of the freshwater lens. The high inertia of the aquifer is consistent with the very small groundwater level and electrical conductivity variations observed with the monitoring network.
As conclusion, this work opens new perspectives for the quantification of groundwater recharge in arid to semi-arid areas occurring during large scale flood events. However, it also showed the necessity to continue the monitoring of the aquifer and to carry out further investigations on the aquifer thickness if further exploitations are foreseen.
Résumé
Avec une population de près de 400'000 personnes, le camp de réfugiés de Dadaab est le plus grand au monde. Il est situé dans la région semi-aride de l’est du Kenya, proche de la frontière somalienne. L’unique ressource permanente en eau potable pour les réfugiés et les communautés locales provient de l’aquifère de Merti, qui consiste en une large lentille d’eau douce souterraine de 250 km sur 50 km, et qui est entourée par de l’eau salée. L’augmentation des volumes pompés, des signes d’augmentation de la salinité de l’eau et l’incertitude sur la diminution du niveau de l’eau souterraine ont fait prendre conscience du risque d’épuisement de la ressource. Ces observations ont abouti à la nécessité de mieux caractériser la recharge de l’aquifère ainsi que la dynamique entre la lentille d’eau douce et l’eau salée environnante.
Dans un premier temps, une nouvelle méthodologie a été développée pour quantifier la recharge concentrée à travers un modèle numérique, basé sur la physique des écoulements, couplant l’eau souterraine et l’eau de surface. Ce modèle a eu pour but de reproduire les surfaces inondées durant les crues et a été calibré à l’aide d’images satellites. Deuxièmement, la dynamique de la lentille d’eau douce a été investiguée par une série de modèles numériques synthétiques. Ces modèles ont permis d’analyser les effets des taux de recharge et leurs mécanismes (pluie, recharge concentrée) sur la géométrie de la lentille et de comparer ces géométries simulées avec la géométrie réelle de la lentille de l’aquifère de Merti. Ces deux approches ont été contre-validées à l’aide d’un réseau de monitoring de l’eau souterraine composé de vingt stations de mesures à haute résolution temporelle (15 min), installé sur toute la lentille en septembre 2013. Finalement, les résultats de ces trois axes de recherche ont été combinés dans un modèle numérique régional.
L’approche développée dans cette étude a permis de quantifier une recharge concentrée entre 195 et 329 x 106 m3/a. La recharge diffuse sur la lentille d’eau douce est quant à elle estimée entre 12 et 62 x 106 m3/a. Comparée à ces taux de recharge, l’extraction courante de l’eau souterraine (environ 4.8 x 10⁶ m3/a) est considérée comme durable à l’échelle de l’aquifère. Cependant, la recharge totale est environ 50 à 100 fois plus grande que l’inféroflux traversant le niveau exploité, calculé à l’aide du gradient hydraulique de l’aquifère et des valeurs de transmissivité issues des essais de pompage. Cet écart a mené à postuler la présence d’un aquifère multi-couche considérablement plus épais qu’uniquement l’horizon couramment exploité, mais avec une importante incertitude sur son épaisseur et sur le gradient vertical de salinité entre la lentille d’eau douce et l’eau salée sous-jacente.
Les modèles numériques ont révélé la très grande inertie de l’aquifère et ont également confirmé que la recharge a principalement lieu de manière concentrée lors des évènements de crue, juste en amont de la lentille d’eau douce. La grande inertie de l’aquifère est cohérente avec les faibles variations des niveaux d’eau et de la conductivité électrique (salinité) observées avec le réseau de monitoring.
En conclusion, ce travail ouvre de nouvelles perspectives pour la quantification de la recharge en milieu aride à semi-aride lors d’évènements de crue. Il a également permis de mettre en avant la nécessité de poursuivre le monitoring de l’aquifère et de mener de nouvelles investigations sur l’épaisseur de l’aquifère afin de confirmer les résultats de la recharge.
Executive summary
This executive summary presents the main results and recommendations of the PhD study “Recharge quantification and continental freshwater lens dynamics in arid regions: application to the Merti aquifer (Eastern Kenya)”, which was conducted at the Center for Hydrogeology of the University of Neuchâtel (Switzerland), financed by the Swiss Agency for Development and Collaboration (SDC) and in collaboration with the United Nation High Commissioner for Refugee (UNHCR). This study aimed to assess the sustainability of the exploitation of the Merti aquifer that is the only permanent freshwater resource of the Dadaab refugee camp, the largest refugee camp in the world with a population varying between 350’000 and 450’000 persons. The increase of the camp population since its settlement in the early 1990s and the related increasing groundwater abstractions led to the concern of groundwater level depletion and risk of salinization.
The particular hydrogeological setting of the Merti aquifer is characterised by the combination of the vast aquifer size, the semi-arid to arid conditions and the interplay between fresh water surrounded by brackish-salty groundwater. Moreover, the hydrology of the basin is characterised by major periodic inundations caused by the intermittent Ewaso Ng’Iro River. In the past, these inundations led to the formation of a swamp, the so-called Lorian Swamp, located at the end of the permanent path of the Ewaso Ng’Iro River and directly upstream of the freshwater lens. Nowadays, this area is not anymore permanently wet but the recurrent inundations are still supposed to play a major role for the groundwater recharge.
The geological and hydrogeological characterisation of the aquifer was carried out through the analysis of geological maps, boreholes logs, hydrodynamical data obtained from pumping tests and groundwater levels as well as electrical conductivity data from historical data and from a monitoring network of 20 devices installed within the framework of this project. The analysis of the geology allowed to define the geometry of the aquifer, which is located within a large Miocene sedimentary basin, composed of a succession of coarse and fine layers of sediments (Fig. 1). The granulometry and the hydraulic conductivity of the sediments diminish towards the border of the basin. The freshwater lens develops in the central zone with high hydraulic conductivities.
The main focus of this study was to develop a new methodology for quantifying the concentrated groundwater recharge under the Lorian Swamp through a physically-based coupled surface/groundwater numerical model reproducing inundated surfaces during flood events and which was calibrated with inundated surfaces derived from satellite images. This
methodology allowed to quantify an average annual concentrated groundwater recharge between 195 and 329 x 106 m3/y. The diffuse recharge was estimated between 12 and 62 x 106 m3/y, yielding a total recharge ranging between 207 and 391 x 106 m3/y.
These results pointed out a discrepancy between literature values of recharge, the transmissivity measured by pumping tests and the transmissivity required to accommodate the estimated recharge, which is about 50 to 100 higher than estimations of the groundwater flow through the exploited aquifer horizon (the Merti beds). This led to the hypothesis that the Merti aquifer is an aquifer system composed of numerous water bearing horizons located within the coarse-sedimentary succession, of which only the first horizon (the so-called Merti beds) is currently exploited.
Fig. 1: Conceptual geological model of the Merti aquifer. The basin is delimitated at its border by normal faults and, in some places, by tilted blocks associated to the rifting of the Anza basin. Successive coarse horizons are likely to be found at several depths (block a). Within the lower part of the aquifer, Miocene limestones separated from marine shales are present at a depth of 250 and 500 m (block b). Beyond the limit of the graben, the basement is covered by only few tens or hundreds meters of sediments. Coarse sediments dominate within the center of the basin while the fine sediments proportion increases towards the border of the basin.
In order to cross-validate these recharge rates, a second approach was adopted, investigating the dynamics of a freshwater lens in response to such recharge rates. This was done with a series of numerical models. These models aimed to analyse the effect of the recharge rates and mechanisms (rainfall, concentrated recharge) on the freshwater lens geometries and to
compare these geometries with the observed geometry of the freshwater lens of the Merti aquifer. This approach confirmed of the concentrated recharge as the predominant recharge mechanism, being more than 80 % of the total recharge.
Thus, the recharge results and the proposed aquifer system suggest that deeper horizons may contain fresh to brackish groundwater (Fig. 2) below the Merti beds. However, the depth of the transition between the fresh and brackish water remains unknown since no deep water prospection has been done in the area.
Fig. 2: Conceptual model of the Merti aquifer system. The Merti aquifer consists in a succession of fine and coarse sedimentary layers, where the Merti beds are only the upstream uppermost. Freshwater recharge occurs mainly as concentrated recharge over the Lorian Swamp area (between 195 and 329 x
106 m3/y). From this location, the freshwater lens develops in width and thickness. Part of this
freshwater recharge is diluted with the surrounding brackish and salty water. Diffuse recharge over the
freshwater lens ranges between 12 and 62 x 106 m3/y.
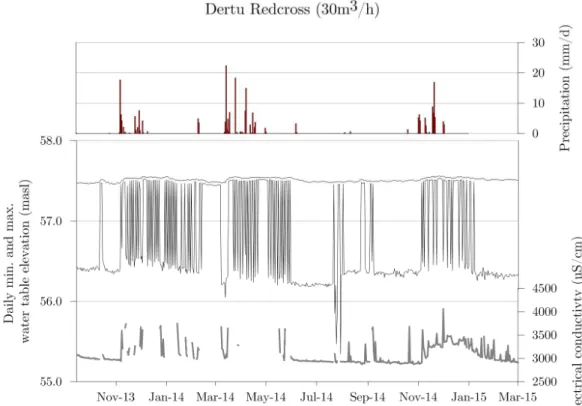
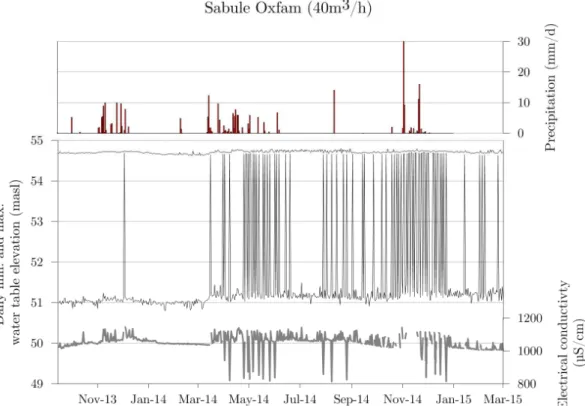
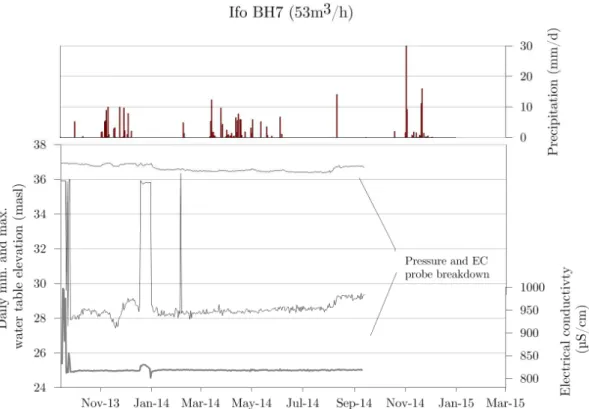
The very stable water levels and electrical conductivity values measured through the groundwater monitoring support the hypothesis of deeper freshwater bearing horizons which act as a “buffer” between the exploited horizon (the Merti beds) and the deeper brackish/saline water. Thus, the possibility of contamination of the wells by upconing of saline water from the underlying layers of the aquifer system is reduced due to the probable presence of the fresh water between the Merti beds and the underlying saline/brackish water. Furthermore, the numerical modelling carried in this study showed that the risk of migration of saline water from the lateral saline zones is insignificant on the regional scale.
However, locally, especially close to the border of the freshwater lens, as in Hagadera (south of Dadaab), signs of salinity increase were observed (up to 100 µS/cm during a period of few years), which requires to carefully consider the salinity evolution. These increases remain low and electrical conductivities of these boreholes remain below the value of 2’000 µS/cm, which is the limit considered for potable water.
Considering only the Merti beds, groundwater axial flow is estimated to be 5 to 8 x 10⁶ m3/y. Comparing this to the 4.8 x 10⁶ m3/y of extractions shows that the upper limit of exploitation of the Merti beds has been reached and calls for careful monitoring.
Hence, in order to investigate the potential of the underlying freshwater resources, it was recommended to drill deep exploration boreholes (350 m), in the upstream area, close to the Lorian Swamp, as well as in the area of refugee camp. Such boreholes would allow to better evaluate the available freshwater resource and the risk of contamination of the boreholes by upconing of saline water. Additionally, it would also allow to confirm the estimation of the groundwater recharge by estimating the flow of freshwater through the entire aquifer system and not only through the Merti beds.
Since groundwater salinity along the edges of the freshwater is the higher, it is recommended to maintain the groundwater monitoring network. This data is essential for the understanding of the groundwater dynamics but also to identify precursory signs of rapid salinity increase and to adapt the groundwater extraction strategy. If the groundwater extraction should be increased at the refugee camps, then it is recommended to increase extraction in the area of the central freshwater lens (Dagahaley and Ifo) and not in Hagadera.
Finally, an extension of the monitoring network over the concentrated recharge area (the Lorian Swamp) may allow to better understand and quantify the recharge mechanism of the aquifer, and thus, its sustainability. Such monitoring networks are also a valuable tool for technicians in charge of the day-to-day exploitation of the wells, for instance for the monitoring of the pumping duration or the identification of well degradation (e.g. clogging).
Keywords
Groundwater, Recharge, Arid areas, Remote sensing, Numerical modelling, Continental freshwater lens, Monitoring, Flooding.
Acknowledgements
The acknowledgments are usually the last words written in the manuscript of the PhD. It’s the opportunity for me to remember the various steps of this work and the people who supported me during these four years.
This project was an incredibly rich scientific, professional and human adventure which allowed me to meet fascinating people in the domain of humanitarian aid and hydrogeology, to discover the context of the refugee camps (or at least part of it!) and work in the spectacular landscape and environment of the Turkana region, in the north of Kenya. So, for all this, I would like to sincerely thank all the people who have made this project possible and who accompanied and supported me during this experience.
First of all, I want to thank Ellen Milnes, my co-director, who invested for the elaboration and realisation of this project who proposed me to join this adventure. Thank you also to Philip Brunner and Pierre Perrochet, my two other supervisors. I would like to define their support and accompanying with the following words: creativity, encouragement, scientific rigor and endless enthusiasm!
Thanks also to the institutions that founded and supported this project: the Swiss Humanitarian Aid (SHA) and the United Nations High Commissioner for Refugees (UNHCR). In particular, I want to thank Marc-André Bünzli, the Head of the Expert Group WES, for his great interest on this study and his very constructive and relevant inputs, as well as Dominique Porteaud, Murray Burt and Claudia Perlongo, Heads of the WASH department at the UNHCR in Geneva, who guided me within the twists and turns of the UN administration and made the challenging field work of this thesis possible.
I also want to thank the members of the jury and the scientific committee of this thesis: Cédric Egger, Olivier Senegas, Yves Haeberlin, Rachida Bouhlila and André Mermoud. I also express my gratitude to all those who supported the field side of this project in Nairobi, Dadaab, Kakuma and Auvernier: Andrea Cippà, Patrick Galli, Christel Dischinger, Patrick D’Aoust, Bernard Chamoux, Kebede Asegedew, Osman Ahmed, Matthew Binyiri, Jecinta Mwongeli, Dominic Gachanja, and the staff from the Earth-Water company as well as Thierry Schneider and Christine Koch from the Tetraedre company in Auvernier. A particular thought goes to Jonathan with whom I spent 7 weeks in the refugee camp of Kakuma.
This PhD was also an enriching period at the Center for Hydrogeology of the University of Neuchâtel. Many thanks to my PhD colleagues, Post-docs, senior lecturers for the numerous
discussions, sharing of experiences, helping hands and the nice moments. Particular thanks to Cécile, Claire, Greg, Lorienne, the two Guillaume, Andrea, Dom, Pierik, Paco, Jaouhar, Fabio, Fabien, Oli, Léa and Nico. Of course, without forgetting Roberto, our dream technician!
Finally, before entering in the core of this study, I let the reader enjoy some pictures from Pierik from the Kakuma field campaign of October – November 2012.
Contents
INTRODUCTION ... 1
CHAPTER 1 1.1 BACKGROUND ... 2
1.2 RECHARGE IN ARID AND SEMI-ARID AREAS – THE NEED FOR A COUPLED SURFACE/GROUNDWATER APPROACH ... 4
1.3 FRESHWATER LENS DYNAMICS ... 7
1.4 THE MERTI AQUIFER SITE ... 9
1.5 APPROACH AND STRUCTURE OF THE THESIS ... 13
GEOLOGICAL AND HYDROGEOLOGICAL CHARACTERISATION CHAPTER 2 OF THE MERTI AQUIFER ... 15
2.1 INTRODUCTION ... 16
2.2 GEOMETRY AND GEOLOGY OF THE MERTI AQUIFER ... 16
2.2.1 Regional geological setting ... 16
2.2.2 Description of the Merti beds and quaternary deposits ... 22
2.2.3 Conclusions on the geology of the Merti aquifer ... 24
2.3 HYDROGEOLOGICAL CHARACTERISATION OF THE MERTI AQUIFER ... 26
2.3.1 Regional piezometry ... 26
2.3.2 Mid-term groundwater level evolution at the Dadaab refugee camp ... 29
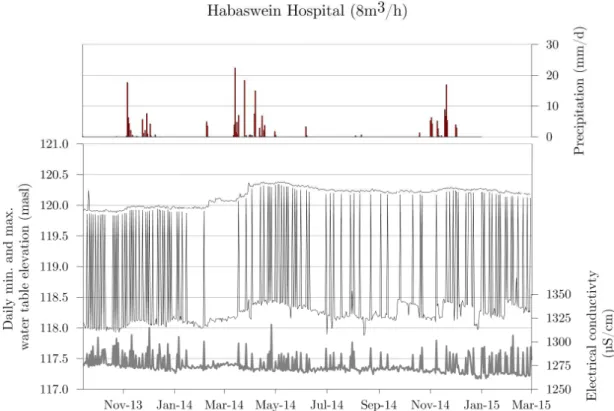
2.3.3 High temporal resolution monitoring of water level and electrical conductivity ... 30
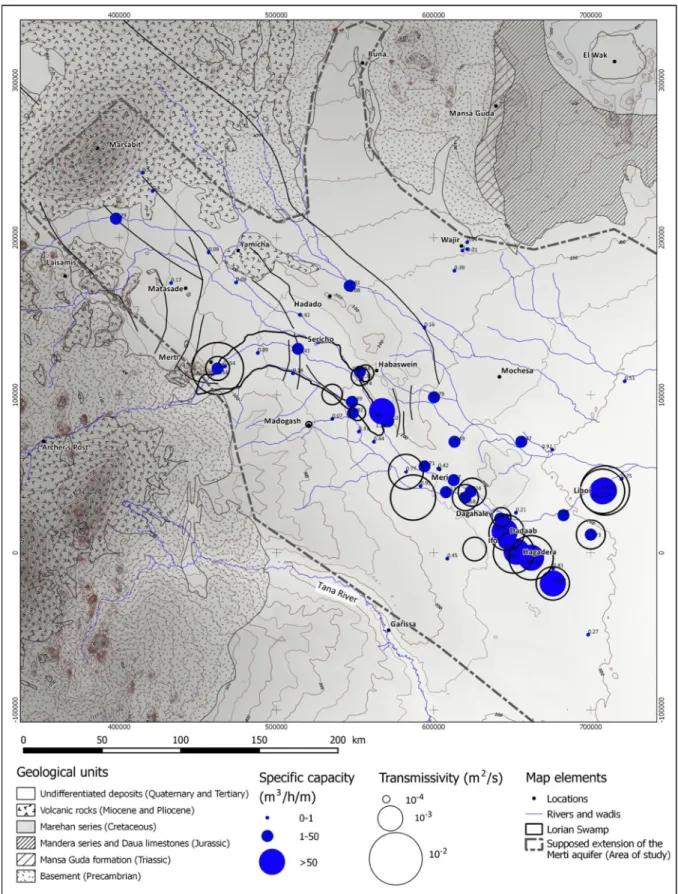
2.3.4 Transmissivity and specific capacity ... 36
2.3.5 Storativity and pumping test interpretation ... 39
2.3.6 Electrical conductivity map and major ions ... 42
2.3.7 Conclusions of the hydrogeological characterisation of the Merti aquifer... 47
QUANTIFICATION OF CONCENTRATED AND DIFFUSE CHAPTER 3 RECHARGE OF THE MERTI AQUIFER ... 49
3.1 INTRODUCTION ... 50
3.2 IDENTIFICATION OF REGIONS OF DIFFUSE AND CONCENTRATED RECHARGE ... 51
3.3 DIFFUSE RECHARGE - LARGE SCALE APPROACH... 55
3.3.1 Precipitation ... 55
3.3.2 Actual evapotranspiration ... 57
3.3.3 P-ET vertical water balance ... 59
3.3.4 Diffuse recharge estimations in published literature ... 60
3.3.5 Conclusions of the diffuse recharge ... 61
3.4 CONCENTRATED RECHARGE – A COMBINED APPROACH BASED ON REMOTE SENSING DATA AND A FULLY COUPLED SURFACE-GROUNDWATER MODEL ... 61
3.4.1 Quantification of groundwater recharge by combining a coupled surface-groundwater model with remote sensing data ... 64
3.4.1.2 Description of the model ... 66 3.4.1.3 Calibration method ... 69 3.4.1.4 Infiltration results by event ... 70 3.4.1.5 Evapotranspiration from the subsurface ... 78 3.4.1.6 Groundwater recharge by event ... 81 3.4.1.7 Relation between the ground conductance, river discharge and recharge volume by event ... 82 3.4.1.8 Discussion on the fictitious event ‘G’ ... 84 3.4.1.9 Uncertainty on the groundwater recharge quantification ... 84
3.4.2 Annual groundwater recharge and return period ... 87
3.4.2.1 Conversion of statistical monthly river discharge distribution into monthly recharge distribution ... 88 3.4.2.2 Return period of maximum annual inundation events ... 94
3.4.3 Analytical 1D vertical approach for quantifying concentrated recharge ... 94
3.4.3.1 Analytical development ... 95 3.4.3.2 Application to the inundation surface of the Lorian Swamp ... 97
3.4.4 Conclusions of the concentrated recharge analysis ... 98
3.5 CONCLUSION OF THE RECHARGE QUANTIFICATION ... 100 DYNAMICS OF CONTINENTAL FRESHWATER LENSES ... 103 CHAPTER 4
4.1 INTRODUCTION ... 104 4.2 METHODOLOGY: THE MERTI INSPIRED SYNTHETIC MODEL, VARYING PARAMETERS AND
INDICATORS ... 104
4.2.1 The Merti inspired synthetic model ...105 4.2.2 Recharge mechanisms and recharge ratios ...108 4.2.3 Geometrical ratios ...110
4.3 CHARACTERISATION OF FRESHWATER LENS DYNAMICS ... 112
4.3.1 Effect of recharge on freshwater lens surface...112 4.3.2 Width ratio analysis ...114 4.3.3 Effect of rainfall on lens geometry ...116 4.3.4 Effect of longitudinal transmissivity heterogeneity on lens geometry ...118 4.3.5 Conclusion of the steady state analysis ...119
4.4 COMPARISON WITH THE MERTI FRESHWATER LENS GEOMETRY ... 120
4.4.1 Similarity surface ratio...120 4.4.2 Pairs of transmissivity and recharge ...122 4.4.3 Conclusion of the comparison with the Merti aquifer...123
4.5 EFFECT OF PUMPING ON THE LENS GEOMETRY ... 123 4.6 CONCLUSIONS OF THE FRESHWATER LENS DYNAMICS ... 125 CONCEPTUAL AND NUMERICAL REGIONAL MODELS OF THE CHAPTER 5
MERTI AQUIFER ... 129 5.1 INTRODUCTION ... 130 5.2 CONCEPTUAL MODEL ... 130 5.3 REGIONAL NUMERICAL MODEL ... 132
5.3.1 Reference model ...133
5.3.1.2 Steady state calibration of the reference model ... 137 5.3.1.3 Transient analysis - Formation of the freshwater lens ... 141
5.3.2 Sensitivity analysis on the diffuse recharge ...142 5.3.3 Sensitivity analysis on the recharge location ...146
5.3.3.1 Sensitivity analysis on the spatial distribution of concentrated recharge ... 146 5.3.3.2 Lateral recharge model ... 147
5.4 CONCLUSION OF THE REGIONAL NUMERICAL MODEL ... 149 CONCLUSIONS, PERSPECTIVES AND RECOMMENDATIONS . 155 CHAPTER 6
6.1 MAIN RESULTS... 156 6.2 SUSTAINABILITY OF THE MANAGEMENT OF THE MERTI AQUIFER ... 158 6.3 PERSPECTIVES FOR FURTHER RESEARCH ... 159 REFERENCES ... 163 CHAPTER 7
APPENDIX A: Synthesis of groundwater levels ... 173 APPENDIX B: Water level monitoring within the Dadaab refugee camp (1993-2003) ... 181 APPENDIX C: High temporal resolution monitoring of the groundwater levels and electrical
conductivities ... 189 APPENDIX D: Drilling logs ... 201 APPENDIX E: Pumping test at Dagahaley BH3 ... 205 APPENDIX F: Synthesis of hydrochemical analyses for the period 1956-2011 ... 207 APPENDIX G: Freshwater lens dynamics - Transient analysis ... 219 APPENDIX H: Observations points used for the calibration of the regional numerical model .... 225 APPENDIX I: Transmissivity maps and scatter plots of the regional numerical model ... 227
Chapter 1
1.1 Background
Over the past decades, armed conflicts combined with harsh arid climatic conditions in the Horn of Africa have led to internal displacement and migration of populations. As an example of such migration, the civil war in Somalia led to the creation of the Dadaab refugee camp in the early 1990s. This camp is located in eastern Kenya, close to the Somali border. Initially, the Dadaab camp was planned to host up to 90’000 refugees as an emergency solution.
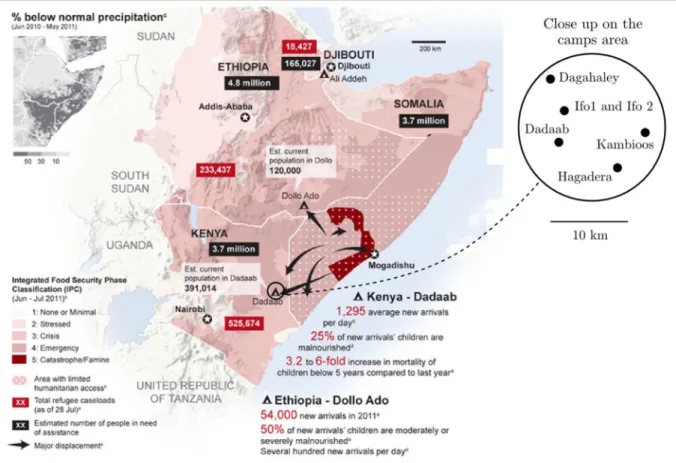
In 2004, however, 150’000 refugees were hosted in the now semi-permanent camp. The population increase accelerated dramatically to 465’000 refugees in 2011 due to the devastating drought (www.data.unhcr.org), Dadaab becoming the biggest refugee camp in the world. Its actual population varies between 350’000 and 450’000 refugees, distributed into five sub-camps: Dagahaley, Ifo, Ifo 2, Hagadera and Kambioos, Dadaab being the village hosting the UNHCR and NGOs staff (Fig. 1.1).
Fig. 1.1 : Humanitarian crisis situation in the Horn of Africa at the beginning of the project, in 2011. Food security classification and major displacement (OCHA, 2011, http://www.unfpa.org). The Dadaab refugee camp is located close to the Somali border and is subdivided into five camps (Dagahaley, Ifo, Ifo2, Hagadera, Kambioos) plus Dadaab that hosts the UNHCR and NGOs staff.
Humanitarian crises led to innumerable challenges for authorities, host communities and humanitarian actors, but also for applied research. One of these challenges and a key
component of public health is water supply: both the necessary quantity and quality of water have to be guaranteed. In the case of Dadaab, where water supply entirely relies upon groundwater exploited from the so-called Merti aquifer, at a depth of 150 m, ensure both quantity and quality of water is crucial.
The critical growth of the Dadaab refugee camps combined with the transition towards semi-permanent settlement led to conflict situations with the host community, the latter accusing the refugee operation of depleting the groundwater reserves. As a result, the importance of assessing the sustainability of groundwater management within this changing demographic context became clear, for which an extensive hydrogeological study was necessary.
The Swiss government released substantial funds during the 2011 crisis in order to address the water scarcity issue in the Horn of Africa, while UNHCR invested in a novel groundwater monitoring system, providing the required ground data for the understanding of hydrogeological processes. The present PhD thesis is a joint outcome of the 2011 emergency funding by the Swiss development cooperation (SDC) and the United Nation High Commissioner for refugees (UNHCR), and was carried out at the Center for Hydrogeology of the University of Neuchâtel (CHYN).
The particular hydrogeological setting of the Merti aquifer is characterised by the combination of the vast aquifer size, the semi-arid to arid conditions and the interplay between fresh and brackish groundwater. Moreover, the hydrology of the basin is characterised by major periodic inundations caused by the intermittent Ewaso Ng’Iro River, which drains a large catchment north of Mt-Kenya (Fig. 1.2). In the past, these inundations led to the formation of a swamp, the so-called Lorian Swamp, located at the end of the permanent path of the Ewaso Ng’Iro River and directly upstream of the freshwater lens. Nowadays, this area is not anymore permanently wet but the recurrent inundations are still supposed to play a major role for the groundwater recharge.
Similar hydrogeological and hydrological environments can be found all around the sub-Saharan region or in other arid/semi-arid regions, and are so far not well understood, neither the processes of groundwater recharge, nor the evolution and dynamics of the freshwater lenses.
The work which forms the basis for the present thesis was carried out against this general backcloth and attempts to make a contribution towards developing a comprehensive approach allowing quantification of recharge processes in continental mega-aquifers in semi-arid/arid regions and towards a better understanding of the dynamics of freshwater lenses in continental context. It uses the Merti aquifer and Dadaab as a case-study.
Fig. 1.2: Map of the Merti aquifer, showing the fresh and the saline groundwater domains in light and dark blue, respectively (modified after Swarzenski and Mundorff, 1977). The recurrent inundations of the Ewaso Ng’Iro River over the Lorian Swamp are supposed to play a major role for the groundwater recharge of the Merti aquifer.
1.2 Recharge in arid and semi-arid areas – the need for a coupled
surface/groundwater approach
Despite scarcity of surface water in arid to semi-arid areas, surface and groundwater flow are closely linked: groundwater flow is constrained by the geology of the aquifer, but also by the recharge from the surface water. Dynamics of recharge from the surface is complex. Surface water infiltrates into the subsurface. Part of the infiltrated water then percolates deeper toward the aquifer and constitutes the recharge. The other part of the infiltrated water is evapotranspired back to the atmosphere.
Additionally to migration of water from the surface to the groundwater, the processes of diffuse and concentrated recharge have to be distinguished (Fig. 1.3). Diffuse recharge includes areal distributed recharge from rainfall or irrigation while concentrated recharge (also called focussed, localised or indirect recharge (Lerner, 1997)) refers to recharge under water surface accumulations such as rivers, lakes or inundated plains (Scanlon et al., 2006).
Fig. 1.3: Schematic model for diffuse recharge (a) and concentrated recharge (b)
Numerous methods have been developed in order to quantify these processes, in particular in arid and semi-arid areas where quantification of groundwater recharge is crucial for assessing the groundwater sustainability. These methods allow the estimation of recharge by investigating the surface-water dynamics, the unsaturated zone or the saturated zone, using various techniques such as chemical tracers, physical techniques, or numerical modelling (Scanlon et al., 2002; Shanafield and Cook, 2014).
Groundwater recharge based on surface-water data is commonly estimated using a simple water budget (e.g. Lerner 1997):
= − + − − −∆
∆ ( 1.1 )
where R is recharge rate, Qup and Qdown are flows at the upstream and downstream ends of
the considered section, Qin and Qout refer to tributary inflows and outflows along the reach
and Ea is the evaporation from surface water and stream bed, and ∆ is change in channel
and unsaturated-zone storage over change in time ∆ .
Numerous analytical and numerical flood-routing models based on this general equation have been developed, using water discharge rates at gauging stations (Jordan, 1977; Lerner et al., 1990; Morin et al., 2009; Sorman and Abdulrazzak, 1993). Integrated hydrological models using distributed precipitation were also developed for simulating the transmission losses within the river bed of an ephemeral river in Eastern Egypt (Gheith and Sultan, 2002). However, such models require accurate and several gauging stations along the river to validate the results. Besides, they often neglect the influence of evaporation and groundwater evapotranspiration during and after the flood as well as the complex temporal dynamics and the complexity of the unsaturated zone (Brunner et al., 2011). The development of fully integrated physically based hydrological models such as HydroGeoSphere allows to couple surface water and groundwater flow and to solve complex flow problems, in particular better considering the evapotranspiration and unsaturated zone dynamics (Brunner and Simmons, 2012).
For shallow aquifers, groundwater level increase during short periods allows to estimate the variation of groundwater volume after a delimitated recharge event (Healy and Cook, 2002). Additionally, in steady state, calculation of the underflow through a cross-section of an aquifer can be done by multiplying the transmissivity of the aquifer by the hydraulic gradient and the aquifer section. However, this method can lead to significant uncertainty because of the high variability of the transmissivity.
Chemical methods complete the panel of tools available for estimating the groundwater recharge from the unsaturated zone (Edmunds, 2010). Environmental tracer methods, such as the chloride mass-balance (CMB) have been widely used in arid to semi-arid areas where drainage is low, giving results for diffuse recharge ranging from 0.05 to about 100 mm/y (Scanlon et al., 2002). However, methods investigating the unsaturated zone, such as CMB but also lysimeter or chemical tracers generally apply to small scale regions because they are difficult to interpolate on larger scale.
Chemical methods are also widely used for assessing the recharge focusing on the saturated zone. These methods include analysis of historical tracers such as bomb-pulse tritium (3H), chlorofluorocarbons (CFC) and the 3He/3H ratio that allows to assess ages of groundwater recharge for recent periods (up to 50 year). Older recharge ages, from 200 to 20’000 years, can be estimated with the radioactive decay of 14C. The chloride mass-balance (CMB) method can also be used for investigating the saturated zone but results could be up to two times higher than for the unsaturated zone (Scanlon et al., 2002).
As discussed, each of these methods has its own relevance specific to each site and each issue to be addressed. Combining various methods on a same site allows to cross-validate results and to improve the system understanding. However, regardless of the approach, the recharge quantification in arid or semi-arid areas remains challenging due to the specific constraints in arid and semi-arid regions. Data are generally limited in such regions because of the remoteness of the study sites and limited means of some governments. Besides, arid and semi-arid regions are characterised by high temporal variability of rainfall and flood events which are difficult to fully integrate into conceptual and numerical models.
Recent developments in remote sensing introduced new perspectives for addressing these lacks, especially for large scale studies. The large spatial cover of images satellites can be used to create spatially distributed input parameters for a model or to constrain models during the calibration (Brunner et al., 2007). Salama et al., (1994) used Landsat images and aerial photographs for delimitating recharge and discharge areas in Western Australia. Multispectral and radar (passive microwave) images were also used to identify surface water (Carbonneau and Piégay, 2012; Jackson, 2002; Matgen et al., 2007; Mc Feeters, 1996; Ordoyne and Friedl, 2008).
Despite the growing possibilities of numerical simulations, especially with the arrival of coupled surface-groundwater models, and despite the recent development of remote sensing products with high temporal and spatial resolution, methods coupling both approaches remain rare to inexistent for quantifying recharge in arid or semi-arid regions. This study proposes a new method combining the potential of remote sensing products and coupled surface-groundwater simulation tools, in order to quantify recharge.
1.3 Freshwater lens dynamics
In semi-arid and arid areas, freshwater lenses commonly develop along ephemeral rivers and streams or below flood plains, and are often the only permanently available water resource (Wheater et al., 2010). Continental freshwater lenses are characterised by specific dynamic behaviours that need to be understood in order to assess the sustainability of this particular groundwater resource under given exploitation schemes.
The dynamics between freshwater and salty/brackish water have been studied for many decades. In particular, variable density flow has been extensively studied in coastal contexts where seawater intrusions often occur (e.g. Cheng, 2004; Steyl and Dennis, 2010; Werner, 2009). Implications of seawater intrusions on water management and soil and groundwater salinization have also been widely discussed in literature (e.g. Essaid, 1990; Essink, 2001; Milnes and Renard, 2004; Milnes et al., 2006; Sophocleous and Ma, 1998; Vengosh, and Rosenthal, 1994).
However, despite the numerous examples of continental saline groundwater bodies, in particular in arid to semi-arid contexts (van Weert et al., 2009), freshwater lens dynamics in these contexts is less documented than seawater intrusion and studies generally focus on smaller scales. Thorne et al. (1990) identified a freshwater lens along the Murray River (Australia). Age, origin and stability of this lens were further investigated by Cartwright et al. (2010) by means of hydrodynamic investigations (piezometry and surface water elevation) and geochemistry (major ions, δ18O, 14C activities, 3H concentrations). They identified five main aspects that have to be investigated when studying continental freshwater lenses along loosing streams : “(1) the controls on the location of the lens; (2) the time-scales over which
the water in the lens is replenished; (3) the extent of mixing between the water in the lens and the regional groundwater; (4) whether the lens is recharged directly from the river or through the floodplains; and (5) whether the lens is stable, growing or degrading under the current hydrogeological conditions ”. In this latter study area, it was found that recharge of
the lens is mainly controlled by the river levels and mainly occurs through the river bank, and not through the flood plain. They highlighted the control of aquifer lithology on the freshwater lens extension.
Another Australian example of a freshwater lens was investigated by Cendón et al. (2010) beneath the Cooper Creek floodplain. The freshwater lens is located over a shallow regional saline groundwater and crops out in a ‘waterhole’ of about 50 m by 400 m along the ephemeral streambed. The freshwater is located in unconsolidated fluvial sands and is covered by a layer of 2 to 7 m of impermeable mud. Investigations revealed that the waterhole is fully connected with the surrounding freshwater lens and is the preferential route for recharge during major flood events related to monsoonal cycles. This is supported by stable groundwater isotopes (δ2H and δ18O) which have a homogeneous signature, and by the total dissolved solids that increase with the distance to the waterhole, up to 5’000 and 15’000 mg/l at a distance of 1’000 m.
A further example of a continental freshwater lens is found in the hyper-arid climate of Central Oman. Young et al. (2004) detected this freshwater lens below a topographic depression of 60 km2 using a geophysical method and confirmed its presence by drilling boreholes. Isotope analyses showed that the lens is recharged by modern water from rare cyclonic rainfall events. However, the current dynamics of the lens was not investigated. In Africa, numerous saline aquifers and local or regional freshwater bodies can be found (van Weert et al., 2009), such as in the Western Sahara Aquifer System, the Nubian Sandstone Aquifer System, the Niger Delta and the Kalahari-Karoo aquifer. The characterisation of these aquifer systems very rarely includes the dynamics between fresh and saline water. One example of this dynamics characterisation is given by Bauer et al. (2006) for the Shashe River Valley aquifer, south of the Okavango Detla in Northern Botswana. The temporal dynamics of the groundwater salinity of the aquifer, located around an ephemeral stream was modelled using coupled flow/transport models. These models allowed to assess the importance of evapotranspiration and pumping and to reproduce the long term evolution of the freshwater lens.
These literature examples reveal a high variability of contexts in which continental freshwater lenses may exist. Two main parameters controlling the dynamics of a freshwater lens can be identified: firstly, the recharge dynamics, which depend on the surface water dynamics; and secondly, the geological and soil settings which determine the possibility of water to infiltrate and controls surface-groundwater interaction. Some freshwater lens replenishments are controlled by major flood events, while others are dominated by infiltration through the river bank and thus depend on the water level in the river and not on inundation or flood events.
Up to now, continental freshwater lens dynamics have been studied through case-by-case analysis and mostly on small scales, combining geochemical, hydrodynamic, geological or numerical modelling approaches. In this study, we aim to develop a numerical approach that allows the assessment of the recharge mechanisms (volumes, concentrated or diffuse recharge)
by comparing simulated and observed freshwater lens geometry and which can be applied for characterising the Merti aquifer and other continental freshwater lenses, in particular for large-scale contexts.
1.4 The Merti aquifer site
In the 1960s and 1970s, the Merti aquifer has been largely studied to develop agro-pastoralism within the Merti-Dadaab region (Arnold, 1952; Mundorff and Swarzenski, 1970; Swarzenski and Mundorff, 1977; Wanyeki, 1979). These works established the basis of the understanding of the aquifer, in particular describing the geology of the area and identifying the presence of the large continental freshwater lens (Fig. 1.2). The groundwater resource study of the Merti aquifer restarted in the 1990s with the creation of the Dadaab refugee camps (Gachanja and Tole, 2002; Lane, 1995; WRAP, 1991). In 2004, GIBB updated the understanding of the aquifer carrying out a large groundwater field campaign and compiling the massive pre-existenting data. A first numerical model, aiming to assess the impact of the increasing groundwater extraction on the groundwater quality and levels was developed by Earth Water Ltd (2012).
In parallel to these groundwater-oriented investigations, numerous studies focused on the larger geological settings of the Anza Graben, a minor associated rift system of the East African Rift in which the Merti aquifer developed (Bosworth and Morley, 1994; Greene et al., 1991; Hendrie et al., 1994; Nyagah, 1995; Reeves et al., 1987; Winn et al., 1993).
These numerous studies allowed to establish a first conceptual model of the aquifer. This previous conceptual model, which is presented below, will be further investigated in the next chapters of this study.
The development of the Anza Graben created a large and deep sedimentary basin (several thousands of meters) which is filled by Cretaceous, Paleogene and Neogene sediments.
The upper part of the basin (about 600 meters) is constituted of an intercalation of fine and coarse alluvial to peri-marine sediments of Miocene and Pliocene ages; A late Miocene horizon of coarse sediments, called the “Merti beds”, is located at a
depth of 90 to 50 meters and is 20-40 meters thick.
This water-bearing horizon, that constitutes the productive unit of the Merti aquifer, extents over 200 km from Habaswein to Dadaab and Liboi, and possibly downstream. It is several tens of kilometres wide. The shape of this main productive layer coincides with the freshwater part of the aquifer (Fig. 1.4), while the areas
surrounding this freshwater lens are characterised by brackish (2’000 to 10’000 µS/cm) to saline water (higher than 10’000 µS/cm).
Recharge of the aquifer was also estimated by various methods (Table 1.1). Estimations vary between 2.6 x 10⁶m3/y and 33 x 106m3/y. These estimations are quite rough and do not distinguish between diffuse and concentrated recharge. From the description given in these reports it is assumed that these estimations refer to the freshwater recharge supplying the freshwater lens. Thus, in order to assess the vertical recharge flux, these figures are normalised by the surface of the freshwater lens between the Lorian Swamp and Liboi (the downstream limit before the freshwater lens become brackish) (Table 1.1).
Fig. 1.4: General overview the Merti aquifer and the fresh and saline groundwater zones. The Merti aquifer is supposed to extend upstream of the freshwater lens as defined by Swarzenski (1977) and to be delimited laterally by the border of the Anza Rift and upstream by the topographic watershed limit of the Marsabit volcanic plateau, which covers the Tertiary sediments in which the aquifer developed.
The various methods used for the recharge estimation can lead to significant uncertainties. The method based on the groundwater underflow computed from hydraulic gradient, section and transmissivity indicates recharge between 3.3 and 4.6 x 10⁶m3/y (Lane, 1995; Swarzenski and Mundorff, 1977; Wanyeki, 1979; WRAP, 1991). This method may give reliable estimations if the regional transmissivity is well defined. Also, even though the aquifer has been described with a thickness of 20 to 40 meters, its exact thickness is not documented and could therefore lead to considerably higher transmissivities.
Based on decreasing Cl- concentrations between the upper part of the aquifer (Yamicha triangle) and Habaswein, GIBB (2004) suggested high freshwater recharge around Habaswein in order to dilute the salinity observed in the upper part of the aquifer. They estimated the freshwater recharge to be at least ten times higher than at the Yamicha triangle, that is 3.3 and 33 x 106m3/y respectively.
Source Calculation method Recharge volume (106 m3/y) Vertical flux (mm/y)
Swarzenski et al (1977)
Groundwater flux at Liboi
2.6 – 3.9 0.21
Wanyeki (1979) Finite difference model 3.8 0.30
Wanyeki (1979) Groundwater flux at Liboi
4.7 0.38
WRAP (1991) Groundwater flux 2.4, at the Yamicha triangle 0.19
0.9, at the Ewaso Ng’iro River 0.07
Lane (1995) Groundwater flux at
Habaswein
1.2 0.10
GIBB 2004 Dilution ratio 3.3 and 33, at the Yamicha
triangle and Ewaso Ng’Iro River
2.90
Table 1.1: Recharge estimations from previous studies. The vertical recharge flux is normalised by the
surface of the freshwater lens surface (12’500 km2). Locations are shown on Fig. 1.4.
These studies also discussed the main possible recharge mechanisms. The main hypothesis is that recharge occurs periodically during flood events of the Ewaso Ng’Iro River beneath large inundations over the Lorian Swamp area. The Ewaso Ng’Iro River drains a large watershed west of Mt-Kenya and is permanent up to Archer’s Post (Fig. 1.2). From Archer’s Post, the river becomes ephemeral and reaches the Lorian Swamp only during major floods, i.e. about once per year. Wanyeki (1979) estimated that once every ten year, major flood would lead to significant recharge volume of up to 30 x 106m3. However, his approach is based on the total river discharge volume during the flood event and does not consider evapotranspiration. Estimation of the recharge is presented graphically in Fig. 1.5. This figure will be completed in the next chapters in order to compare the various recharge estimations. Extraction was estimated in the refugee camp in 2011 to 3.2 x 10⁶m3/y and to 1.6 x 10⁶m3/y outside the camp in 2003, for a total of 4.8 x 10⁶m3/y for the entire aquifer in 2003 (Earth Water Ltd, 2012).
Recharge is also supposed to occur along other ephemeral rivers of the Merti basin, such as the Lagh Dera and Lagh Bogal rivers (Fig. 1.4). But again, no precise and solid quantification of this recharge was presented.
Fig. 1.5: Annual recharge estimations from previous studies and extraction rate within and outside the Dadaab refugee camp.
The basaltic plateaus located north-west of the freshwater lens at Merti, Yamicha, Laisamis and the Mt-Marsabit were also suggested as preferential recharge areas due to the supposed higher precipitation rate over these plateaus, and possibly due to the basalt fracturation. However, these two hypotheses were not strongly demonstrated.
Another mechanism is suggested via localised infiltration in sinkholes within carbonate rocks (GIBB, 2004) at Oresaboru (few kilometres north of Merti) and Shantabak (between Habaswein and Madogash). However this type of recharge is assumed to be limited because of the small extension of the carbonate rocks, as they were only described at these locations. In the previous studies, five geochemical campaigns were carried out since 1974 (GIBB, 2004; Gachanja and Tole, 2002; Ingraham and Matthews, 1988; Lane, 1995; Pearson and Swarzenski, 1974; Sklash and Mwangi, 1991), using analyses of 2H, 3H, 18O, 14C and 87Sr isotopes. Following hypotheses about recharge dynamics were established, indicating that the Merti aquifer water is composed from very old to recent water :
1) δ18O and δ2H analyses reveal that water from the central Merti aquifer (between Dadaab and Habaswein) is significantly isotopically depleted, indicating that recharge is made up of water coming from higher areas (i.e. the upper Ewaso Ng’Iro catchment) or occurred during a more humid period (paleorecharge).
2) Recent recharge in shallow groundwater systems along the Ewaso Ng’Iro River and in volcanic regions is validated by tritium data. Unusually high values found at Sericho, Shantabak and Sabule are interpreted as recent recharge during the 1997/1998 ENSO (El Niño Southern Oscillation) or earlier ENSO events.
3) 14C isotopic analyses suggest recent to very old recharge ages which could be associated with recent or previous known wet periods: (1) recent recharge; (2) around 2’700 years BP; (3) 9’200 years BP; and (4) 14’200 years BP. Younger ages are found around Habaswein and Gurufa.
Finally, based on the current understanding of the aquifer, Earth Water Ltd (2012) elaborated a finite-difference groundwater model in order to predict the groundwater depletion and salinity evolution at Dadaab, according to two different recharge scenarios (6.8 and 32.2 x 10⁶m3/y) and assuming increasing abstraction rates due to growing populations. They concluded that, from 2035 onwards, drawdown at Dadaab could reach 2.4 to 8.2 meters and that pumped water at boreholes close to the edge of the freshwater could become brackish with electrical conductivities beyond 8’000 µS/cm. The results of this first numerical model of the Merti aquifer reveal the risk of a degradation of the groundwater quality and quantity, and the necessity to undertake further investigations.
Up to now, only local increases of salinity at the edge of the freshwater lens were measured and little to inexistent depletion of static water level could be observed. However, mid to long term degradation of the groundwater quality and level could have dramatic humanitarian, social and economic consequences. To avoid such consequences, a better understanding of the Merti aquifer is required.
1.5 Approach and structure of the thesis
The present thesis follows two main objectives. The first one is to propose new methods for (1) estimating groundwater recharge in arid to semi-arid areas, using the high potential of remote sensing products and of a fully integrated, physically based flow model (HGS); and (2) for quantifying the dynamics of large scale continental freshwater lenses. The second objective is to better characterise the Merti aquifer, in particular by applying these new methods but also by the interpretation of geological and hydrogeological field data (the piezometry, well tests, groundwater electrical conductivities and hydrochemistry).
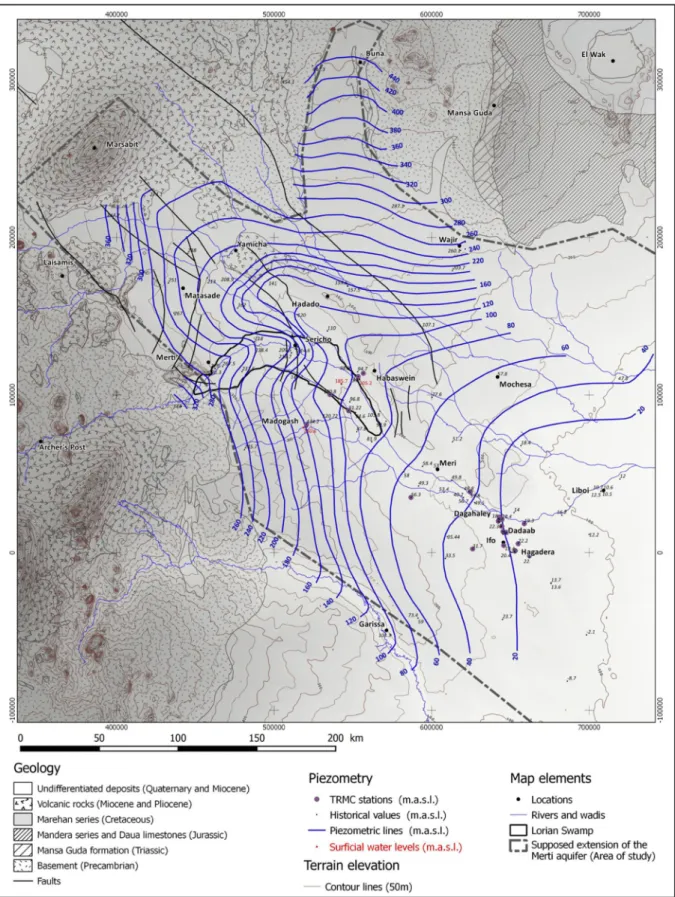
Chapter 2 describes the overall geological and hydrogeological characteristics of the Merti aquifer. The geometry and hydrodynamic characteristics of the aquifer are described based on geological and well test data. The characterisation of the aquifer is completed with the spatial and temporal analysis of the piezometry and groundwater electrical conductivities. For this purpose, historical data collected since Swarzenski (1977) are used, as well as high resolution temporal data acquired with a network of 20 monitoring devices installed in 2013 in the framework of this research project. This chapter provides the basis for the conceptual model of the Merti aquifer and the latter numerical model.
The method for quantifying concentrated groundwater recharge developed in this research work is presented in Chapter 3. This method relies on an integrated physically coupled groundwater / surface water flow model, calibrated by satellite images of inundation surfaces. Based on the recharge quantified for six inundation events, average annual groundwater recharge is computed converting the statistical distribution of the river discharge rates into a
recharge distribution. Additionally to the concentrated recharge quantification, estimation of areal recharge (diffuse recharge) is approached using remote sensing products and values found in literature for similar environments.
Chapter 4 explores the dynamics of a synthetic continental freshwater lens inspired from the Merti aquifer geometry. The dynamics of this freshwater lens is assessed under various recharge conditions (concentrated recharge, diffuse recharge and various rates) and aquifer characterisation (e.g. transmissivity) using geometric indicators (size and shape of the freshwater lens). The effect of pumping is also evaluated observing the modification of the freshwater lens geometry. Comparison with the actual Merti aquifer is carried out in order to cross-validate hypotheses of recharge conditions suggested in chapter 3.
In chapter 5, a conceptual and a numerical model of the Merti aquifer are elaborated. The conceptual model is established using results from recharge quantification and the freshwater lens dynamics, as well as interpretations of geological and field data of chapter 2. This conceptual model serves as basis for the development of the regional numerical model. This numerical model is used to test hypothesis of the conceptual model.
Chapter 2
Geological and hydrogeological
2.1 Introduction
The aim of this chapter is to characterise the main geological and hydrogeological features of the Merti aquifer in order to set the framework for the further investigations on groundwater recharge (chapter 3) and the freshwater lens dynamics quantification (chapter 4). Eventually, these three pillars will serve as base for the development of the conceptual and regional numerical models of chapter 5.
First, the aquifer geometry and the main lithostratigraphic units are interpreted by the analysis of the geological units and structures (faults). This step allows to define the main hydrostratigraphic units with qualitative hypotheses on hydraulic behaviour. Then, hydrodynamic characterisation of the aquifer is refined with the analysis of piezometry, well test data and hydrochemical distributions and evolution. This analysis, which integrates historical and recent field data, allows to define more precisely the areas of high transmissivities but also to interpret the effect of recharge over the Lorian Swamp on the observed piezometry.
2.2 Geometry and geology of the Merti aquifer
The analysis of the geology serves to define as accurately as possible the geometry and the major units of the aquifer. First, the large scale setting of the geology is presented. Secondly a more detailed description of the Merti beds (the main aquifer formation) and the quaternary deposits and soils is given, with a focus on hydrostratigraphic characteristics. 2.2.1 Regional geological setting
The Merti aquifer is located within a large tertiary sedimentary basin, between the East African Rift (EAR) and the passive margin of the Indian Ocean. This basin (Fig. 2.1) was created along a minor associated rift system of the large EAR, the Anza Rift, that was mainly active during the Paleogene (Bosworth and Morley, 1994; Reeves et al., 1987).
Sedimentary rocks in the basin consist of an alternation of high energy environment depositional sediments (mainly sands and some gravels) and low energy depositional environment sediments (clays and silts). Some rare limestones are present, which formed in shallow marine depositional environment. These rocks are deposited over the pre-existant Mesozoic sedimentary units and the Precambrian basement.
Fig. 2.1: Tectonic map of the East African Rift and the Anza Rift in which the Merti aquifer develops (modified after Hendrie et al., 1994 and Rop, 2011). The freshwater lens as defined by Swarzenski and Mundorff (1997) is superimposed to the main productive area of the Merti aquifer.
The dynamics of sedimentation within the Anza Rift is constrained by normal fault systems but also by eustatic sea level fluctuations that affect the sedimentation facies of the formations (Nyagah, 1995). The major structure is the Lagh Bogal Fault crossing the area northwest-southeast under the entire Marsabit plateau up to Habaswein (Fig. 2.2). Various normal faults and minor grabens associated to the large extension context were also identified by the same author. From Middle Miocene, faulting considerably decreased or stopped, suggesting that faults do not significantly affect the more recent layers. Since Middle Miocene, volcanism started over the basin and formed high reliefs (Kenya and Mt-Marsabit) and plateaus covering part of the Tertiary sediments.
The main characteristics of the basement, Mesozoic and Cenozoic rocks are presented below with a hydrostratigraphic overview.
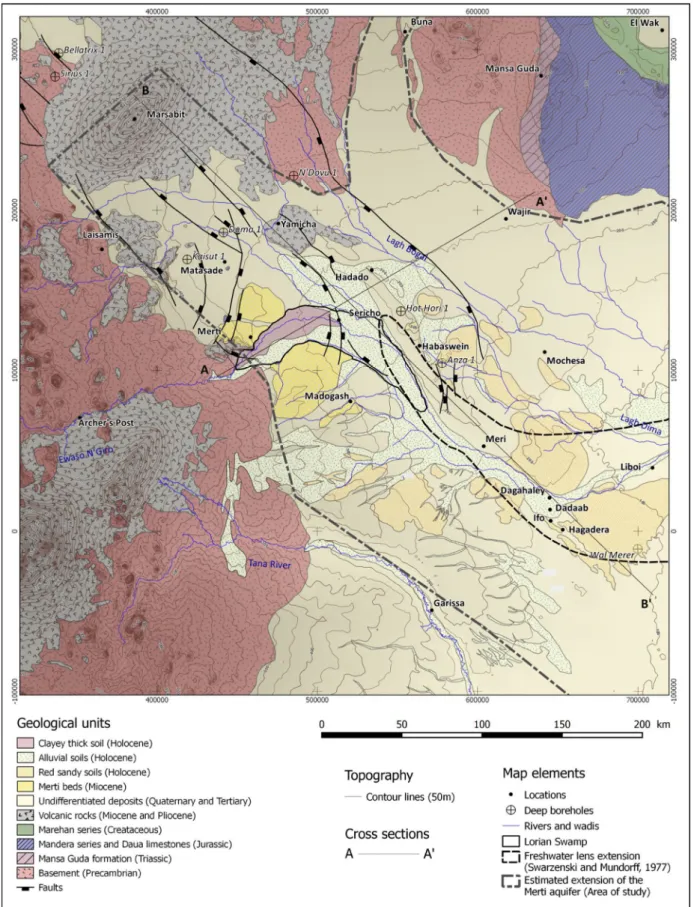
Fig. 2.2: Geological map of the Merti area compiled from the sources : GIBB, 2004; Lane, 1995; Swarzenski and Mundorff, 1977; Kenyan Water Resources Management Authority (WRAP).
Precambrian Basement
North, west and southwest of the Merti aquifer, the basement present under the sedimentary piles consists of metamorphic rocks of Precambrian and Paleozoic ages. It includes quartzites, granulites, gneisses, schists and amphibolites, intruded by granites, gabbros and others salic to ultramafic rocks.
Basement rocks are characterised by fracture porosity and low hydraulic conductivity. Swarzenski and Mundorff (1977) reported that water production at boreholes usually yield less than 10 litres per minute. In rare cases, some boreholes produce between 25 litres per minute to more than 100 litres per minute.
Carboniferous and Permian rocks, included in the basement unit, do not crop out within the Merti aquifer. Remnants are visible south of the Tana River but they are covered northward by Mesozoic and Cenozoic deposits. Carboniferous and Permian rocks are not of relevance for the Merti aquifer. Indeed, they are neither found as reservoirs nor as infiltration areas.
Mesozoic
Except for a Jurassic outcrop in Matasade and south east of Merti, the Mesozoic formations are not identified in the Merti aquifer area. Triassic is present north of Wajir (north of the Merti aquifer) in a subsiding basin, and south of the Tana River. It consists of consolidated conglomerates, sandstones, siltstones and shales, contained in the Mansa Guda formation. Jurassic rocks mainly crop out in the subsiding basin northeast of Wajir. This basin is not of interest for the study because it is separated of the Merti aquifer by basement rocks. The limestones cropping out locally in Matasade and south east of Merti are interpreted as the upper part of tilted blocks at the edge of the graben. These limestones are capped by unconformable quarzitic sandstones (Bosworth and Morley, 1994). They are described by Gachanja and Tole (2002) as karstified and sinkholes were identified within this formation. In the centre of the Anza Rift, the Jurassic formations are found at several thousand of meters below the surface. In the upper area of the Merti aquifer area, the Jurassic was not encountered in boreholes despite an investigation depth of 4’000 to 5’000 meters (Fig. 2.3). At Garissa, in the border of the rift system, the Jurassic formation is found at a depth of 1040 m. At Wal Merer, 30 km east of Hagadera, Early Cretaceous is still present up to a depth of 3’800 m (Nyagah, 1995).
The early Cretaceous formation is not well known over the basin. The compiled stratigraphic section of Fig. 2.3 shows the very great thickness of the Cretaceous formation up to several thousands of meters. Additionally, Aptian and Albian are present as marine strata in the Northern Lamu embayment, at Wal-Merer-1 at a depth of 1470 m (Bosworth and Morley, 1994; Winn et al., 1993).
Fig. 2.3: Stratigraphic sections of the Anza rift (reprinted from Winn et al., 1993).
The schematic cross-section of Fig. 2.4 summarises the vertical distribution of the rocks between the two shoulders of the graben, up to a depth of 6000 m, along the section shown in Fig. 2.2. This figure illustrates the importance of the normal fault system for the depositional dynamics of the Mesozoic and Tertiary formations. Laterally, the Jurassic limestones found in the Merti area are interpreted as tilted-blocks along the western border of the Anza graben.
Fig. 2.4: Schematic cross-section of the Anza Graben. The graben is delimited laterally by normal faults, which leads to the deposition of several thousand meters of Cenozoic sediments in the middle of the basin. Laterally, tilted blocs with Jurassic cover are presumed. These blocks crop out in few locations along the western border. At the base of the basin, presence of Jurassic limestones is expected. Over the shoulder of the basin, a thickness of few tens or hundreds meters of late Tertiary sediments is present. The Merti aquifer developed within the Late Oligocene and Miocene formation. The exact thickness of the aquifer is not documented. Sources: geological map of Kenya 1:3’000’000, Bosworth and Morley, 1994 and Winn et al., 1993.
These limestones present at the edge of the rift basin could possibly lead to a complementary connected aquifer system, which could be dominated by karstic flows, underlying the unconsolidated Tertiary Merti aquifer. However, according to the geological map, the Jurassic rocks are not directly in contact with the main recharge area (the Lorian Swamp), which is around 30-40 km east of the tilted block. Furthermore, these rocks crop out more than 20 km south and north of the Ewaso Ng’Iro River, making difficult the possibility of the Ewaso Ng’Iro to infiltrate into this formation.
Cenozoic
The upper part of the Anza graben is filled with Paleogene and Neogene formations that constitute the reservoir of the Merti aquifer. Thickness of these sediments highly varies from the center of the Anza Rift to the shoulders. East of Marsabit, the thickness of Cenozoic sediments ranges from 0 to 600 m while within the basin, the Miocene sediments reach a thickness from 300 to 600 m (Bosworth and Morley, 1994). Eocene and Oligocene formations reach several hundreds of meters of thickness at Hot-Hori (Fig. 2.3 and Fig. 2.4)
Fig. 2.5: Schematic geological cross-section of the Merti aquifer, interpreted from the borehole logs described by Bosworth and Morley (1994), Nyagah (1995) and Winn et al. (1993). Downstream, oceanic Miocene limestones could be karstified and lead to significant increase of the transmissivity. The transition between the Miocene oceanic sediments (clays and limestones) and the continental deposits is not known. Campanian marine shales are interpreted as the upper part of tilted block along the border of the Anza graben. The exploited productive layer of the Merti beds is located within the middle to late Miocene formation. Deeper productive horizons are probable.