HAL Id: hal-01238217
https://hal.archives-ouvertes.fr/hal-01238217
Submitted on 10 May 2021
HAL is a multi-disciplinary open access
archive for the deposit and dissemination of
sci-entific research documents, whether they are
pub-lished or not. The documents may come from
teaching and research institutions in France or
abroad, or from public or private research centers.
L’archive ouverte pluridisciplinaire HAL, est
destinée au dépôt et à la diffusion de documents
scientifiques de niveau recherche, publiés ou non,
émanant des établissements d’enseignement et de
recherche français ou étrangers, des laboratoires
publics ou privés.
Distributed under a Creative Commons Attribution| 4.0 International License
Mediterranean Sea) using size structure and
environmental conditions
Boris Espinasse, Francois Carlotti, M. Zhou, Jean Luc Devenon
To cite this version:
Boris Espinasse, Francois Carlotti, M. Zhou, Jean Luc Devenon. Defining zooplankton habitats in
the Gulf of Lion (NW Mediterranean Sea) using size structure and environmental conditions. Marine
Ecology Progress Series, Inter Research, 2014, 506, pp.31-46. �10.3354/meps10803�. �hal-01238217�
INTRODUCTION
Continental margins are generally highly produc-tive areas compared to the open sea and provide the main spawning habitats for small pelagic fishes (Palomera et al. 2007, Planque et al. 2007, Bellido et al. 2008, Nicolle et al. 2009). Shallow waters, stronger currents, river discharges, and wind-driven up -welling cause strong variations in physical
struc-tures, resulting in a variety of hydrological patterns (Yanagi 2000). Physical processes have direct effects on the production of the first trophic levels by mixing different water masses and bringing nutrients from terrestrial runoff and coastal upwelling. To under-stand how these environmental conditions affect zoo-plankton distributions at the mesoscale, physical and biological variables must to be measured simultane-ously at a sufficiently high resolution to detect fine
© Inter-Research 2014 · www.int-res.com *Corresponding author: boris.espinasse@univ-amu.fr
Defining zooplankton habitats in the Gulf of
Lion (NW Mediterranean Sea) using size structure
and environmental conditions
B. Espinasse
1, 2,*, F. Carlotti
1, 2, M. Zhou
3, J. L. Devenon
1, 21Aix Marseille Université, CNRS/INSU, IRD, Mediterranean Institute of Oceanography (MIO), UM 110, Marseille, France 2Université du Sud Toulon-Var, CNRS/INSU, IRD, Mediterranean Institute of Oceanography (MIO), UM 110, La Garde, France
3Department of Environmental, Earth and Ocean Sciences, University of Massachusetts Boston, 100 Morrissey Blvd, Boston,
Massachusetts 02125, USA
ABSTRACT: The size structure of zooplankton communities in the Gulf of Lion, NW Mediterra -nean Sea, was studied in May 2010 and January 2011. The integrated physical and biological measurements provided a 3D view with high spatial resolution of the physical and biological variables and their correlations over the whole gulf. The effects of physical processes such as freshwater input, coastal upwelling, and water column mixing by winds on phytoplankton and zooplankton distributions were analyzed using these data. During the winter, strong northerly winds mixed the water column, and the vertical distributions of biological variables were uniform over most of the gulf while there were local hot spots with high chlorophyll a (chl a) concentrations in front of the Rhône mouths and in coastal areas. During the spring, light winds and water column stratification resulted in less vertical mixing, and the Rhône River freshwater plume spread over a large part of the gulf. The nutrients delivered by the freshwater input encouraged high primary production in the surface layer. In the pycnocline, a thin layer of high particle concentration was associated with these high phytoplankton biomasses. Three habitats were distinguished based on statistical analysis performed on biological and physical variables: (1) the coastal area character-ized by shallow waters, high chl a concentrations, and a steep slope of the normalcharacter-ized biomass size spectrum (NBSS); (2) the area affected by the Rhône with high stratification and flat NBSS slope; and (3) the continental shelf with a deep mixed layer, relatively low particle concentrations, and moderate NBSS slope. Defining habitat is a relevant approach to designing new zooplankton sam-pling strategies, validating distribution models and including the zooplankton compartment in trophodynamic studies.
KEY WORDS: Plankton dynamics · Size spectra · Freshwater plume · Stratification · Coastal ecosystems · River Rhône
structures in the water column (Labat et al. 2009, Möller et al. 2012, Ohman et al. 2012). The data from high-resolution measurements can be used to deter-mine zooplankton habitats with specific hydrological and biological features. Recent advances in in situ optical and acoustic sensors have made such high-resolution measurements of physical and biological variables possible (Mikkelsen & Pejrup 2001, Davis et al. 2004, Jiang et al. 2007, Picheral et al. 2010, Powell & Ohman 2012). The laser optical plankton counter (LOPC) can be used to measure the size spectrum of zooplankton communities (Herman et al. 2004) and can also be coupled with other sensors to monitor simultaneous changes in the physical and biological variables along the water column. In con-junction with net tows to establish ground truth, this size structure approach provides important informa-tion on the funcinforma-tioning of marine ecosystems. The characteristics of the size spectrum have been suc-cessfully used in several studies as an indicator for the dyna mics of plankton communities (Matsuno et al. 2012, Tarling et al. 2012, Schultes et al. 2013, Basedow et al. 2014). Size-based mathematical mod-els have been developed and can be used to deter-mine the characteristics of plankton communities and to quantify the efficiency of energy transfer between trophic levels (Zhou 2006, Andersen et al. 2009). Sizes of zooplankton organisms also play an important role in predator−prey interactions,
espe-cially in the survival of fish larvae (Plounevez & Champalbert 2000, Costalago et al. 2012, Nikoliou -dakis et al. 2012). Although the concept of habitat is widely used and well defined for the study of fish (Bellido et al. 2008, Giannoulaki et al. 2011, Tugores et al. 2011, Salas-Berrios et al. 2013), only a few stud-ies have used this concept for zooplankton. The spe-cies-based ap proach used to study fish is difficult to transpose to the zooplankton compartment, espe-cially in tropical and temperate regions with high biodiversity. Zooplankton habitats are therefore gen-erally defined as function of the environmental con-ditions that create a specific assemblage of species characterized by taxonomic composition (Schulz et al. 2012, Sano et al. 2013) or size structure features (Matsuno et al. 2012). In this study, we characterized zooplankton communities by their abundances and size structures rather than by taxonomic composition. The term ‘habitat’ is used to refer to geographical areas where there are statistically meaningful rela-tionships between the environmental conditions and zooplankton community variables.
The Gulf of Lion in the northwestern (NW) Medi-terranean Sea has a large continental shelf up to 80 km wide (Fig. 1). Several rivers, in particular the Rhône River, flow into the Gulf of Lion carrying freshwater, terrestrial particles, and nutrients. The Northern Current (NC) flows southwestwards along the continental slope and sometimes intrudes onto the shelf, bringing oligotrophic waters into the gulf. Strong winds such as the Mistral and Tramontane occur fre-quently, creating coastal upwellings and driving the dispersion and dilu-tion of the Rhône River plume. The hydrography of the Gulf of Lion is well documented (Millot 1990, Broche et al. 1998, Petren ko et al. 2005) and simu-lated by several physical models (Estournel et al. 2003, André et al. 2005, Rubio et al. 2009). The MARS-3D hydrodynamic model simulates cir-culation in the NW Mediterranean and resolves the coastal dynamics. The effects of the Rhône River plume on biological processes have been described in many studies dealing with nutrient inputs, phytoplankton growth, and zooplankton grazing and behavior (Gau dy et al. 1990, Pagano et al. 1993, Pujo-Pay et al. 2006, Diaz et al. 2008). However, very few studies have been undertaken for the area
Fig. 1. Schematic representation of the main hydroclimatic phenomena that interact with the physical features in the Gulf of Lion. Tramontane and Mistral are frequently occurring strong winds that create coastal upwellings and drive
spanning coastal runoff to the NC in the past 25 yr (Kouwenberg 1994, Gaudy et al. 2003), and these do not provide an overall view of the distributions. Fur-thermore, only 1 study focused on the size structure of zooplankton communities (Rian dey 2005). Consid-erable efforts have been made to study trophic dynamics and effects of physical processes at differ-ent scales in the Gulf of Lion (Raimbault & Durrieu de Madron 2003, B˘anaru et al. 2013), but, despite the key position of the zooplankton compartment in the food web, no studies have used a specific sampling strategy to determine zooplankton dynamics.
Two surveys were conducted in May 2010 and Jan-uary 2011 over the entire Gulf of Lion to produce 3D maps of zooplankton distributions and environmen-tal conditions simultaneously at a synoptic scale. The aims of this study were (1) to define spatial zooplank-ton habitats in relation to environmental conditions, (2) to identify the main processes shaping the habi-tats, and (3) to suggest a method suitable for coastal marine ecosystem monitoring and management in the future.
MATERIALS AND METHODS Data collection and sampling
Two surveys were conducted on board the RV ‘Téthys II’: from 25 April to 2 May 2010 (COSTEAU 4) and from 23 to 27 January 2011 (COSTEAU 6). Six transects from the coast to the open sea were sur-veyed with up to 15 sampling stations at regular intervals of 2.5 nautical miles (Table 1). All sampling operations were carried out during the day from the bottom, or a maximum depth of 200 m for offshore stations, to the surface using a Seabird 911 CTD
(Sea-Bird Electronics), an Aqua Tracka 3 fluorometer (Chelsea Technologies Group), and a LOPC (Herman et al. 2004) mounted on a 12-bottle Rosette water sampler. Water samples were collected at a range of depths and immediately filtered using GF/F filters. In the laboratory, chlorophyll a (chl a) was extracted in an acetone solution as described by Aminot & Kérouel (2004). The regression between in situ-mea-sured fluorescence (fluo) and laboratory-measitu-mea-sured chl a were de termined as chl a = 1.64 × fluo (R2 = 0.77,
n = 202) for COSTEAU 4 and chl a = 5.43 × fluo (R2 =
0.83, n = 201) for COSTEAU 6. Wind data were ob -tained from the maritime meteorological station and weather forecast model Aladin from Météo-France.
The recently developed LOPC has already been used in several studies (Finlay et al. 2007, Checkley et al. 2008, Gaardsted et al. 2010, Ohman et al. 2012, Basedow et al. 2013). The high acquisition rate of the LOPC, and the simultaneous measurements of other variables, provides the fine spatial resolution map-ping necessary for understanding the interactions be-tween environmental conditions and zooplankton communities. The LOPC was coupled to a data logger and a micro-CTD to measure the vertical dis tribution of the size spectrum and abundance of particles (zoo-plankton and suspended particulate matter) from 100 µm to 1 cm equivalent spherical diameter (ESD; Herman et al. 2004). The LOPC has a flow-through tunnel with an open area of 7 × 7 cm and measures the attenuation of the light intensity caused by parti-cles passing through the tunnel and crossing at the laser beam. The digital size of the particles is inferred from the changes in intensity and is converted to the ESD. The data were processed using a program de-veloped on MATLAB software (Mathworks). Like other laser-based sensors, the LOPC does not distin-guish between organisms and suspended particulate matter (SPM). However, recent studies have de-scribed the development of new theoretical ways for separating living and non-living particles, based on the lognormal distribution ex pected for particle spec-tra (Petrik et al. 2013), and using an opacity index to separate zooplankton organisms from SPM for parti-cles over 1.5 mm ESD (Checkley et al. 2008). Unfortu-nately, these methods were not suitable for this study owing to the low concentrations of organisms over 2 mm ESD in the Mediterranean Sea and the small vol-ume of water analyzed at each cast.
Spatial and transect maps were generated using Ocean Data View (Schlitzer 2014) with the embed-ded gridding software DIVA (Troupin et al. 2012). Data from a hull-mounted acoustic Doppler current profiler (ADCP, 150 kHz, RD Instruments) and
simu-Tran- —— COSTEAU 4 —— —— COSTEAU 6 —— sect Date No. of Date No. of
(dd/mm) stations (dd/mm) stations A 27/04 11 (+ 2 trans.) 23/01 13 (+ 1 trans.) B 28/04 14 24/01 7 C 29/04 12 25/01 15 (+ 2 trans.) D 30/04 14 (+ 1 trans.) 26/01 14 (+ 1 trans.) E 01/05 6 27/01 15 F 02/05 6
Table 1. Dates and numbers of stations for each transect dur-ing 2 sampldur-ing campaigns in the NW Mediterranean Sea: COSTEAU 4 (2010) and COSTEAU 6 (2011); ‘trans.’ stations were between 2 transects. Positions of the stations are
lations from the MARS-3D hydrographic model (André et al. 2005) were used to assess the stability of the physical structures during the surveys.
Habitat mapping
The methodology used to define habitats followed a sequence of operations: (1) selection of a limited number of measured or calculated variables; (2) prin-cipal component analysis (PCA) of these variables; (3) cluster analysis of the stations characterized by their coordinates on the principal components (PCs); (4) definition of the number of clusters using an objective measure of partitioning efficiency.
The first step characterized each station using a limited set of variables representing hydrological and biological features and including vertical infor-mation (Table 2). Several sets of variables were tested with the objective of balancing them between physical and biological variables. Physical variables were selected to be representative of all the physical processes occurring in the gulf. Five variables were selected: sea surface temperature and salinity, mixed layer depth, stratification index, and potential den-sity at the bottom. The stratification index was calcu-lated using the Brunt-Väisälä frequency (N). Each station where at some depths N2 was higher than
10−3s−2was considered to have a pronounced
pycno-cline. To calculate the intensity of the pycnocline, a density profile model (ρmod) was defined using the
following function:
(1) where ρh0 (density at top of section), Δρh (density
change over the section), and z0 (absolute depth at
inflexion point) were evaluated directly on a profile section centered on the pycnocline. Parameter α was estimated using least-squares minimization of the difference between the modeled density profile and the observed profile. Differentiating this equation related to dz gives:
(2) The stratification index dρmod/dz is the value of the
slope at the inflexion point, where z = z0:
(3) The depth at which N2 was greater than 0.2 ×
10−3s−2was taken to define the mixed layer depth. In
addition to the chl a concentration, biological vari-ables were selected to characterize zooplankton com-munities. The selection was based on the type of data obtained by the optical sensors used. The variables selected were the abundance of 3 particle size classes integrated along the water column and the slope of the normalized biomass size spectrum (NBSS).
The next step was to perform a PCA on the data set constructed from all of these variables. This step iden-tified any signi ficant correlation between the ables, showed which variables influenced the vari-ability between stations, and reduced the number of variables to the 3 principal components. Outliers were defined arbitrarily by calculating the Mahalanobis distance (MD) for the distributions of stations, and setting a threshold of MD2= 50, which resulted in 2
outliers (out of 165 stations). Although outliers were excluded from the data set used for the calculation, their coordinates on the PC axes were calculated. The PCA was performed separately on the data sets for each survey in order to avoid the cluster definition being biased by the variability in the variables be -tween the 2 surveys.
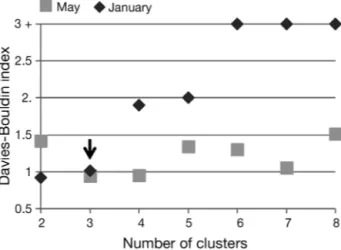
A cluster analysis was then performed on the sta-tions characterized by the PCs. The Davies-Bouldin (DB) index, which is an objective measure of parti-tioning efficiency, provided the optimal number of groups defined by clustering (Davies & Bouldin 1979). The number 3 was selected since it gave one of the lowest DB index values for both the COSTEAU 4 and the COSTEAU 6 surveys (Fig. 2), making it possible to compare the distribution of the habitats between the 2 periods. Furthermore, although the DB index was relatively low for 7 clusters for the May
d d mod ρ ρ z = Δ h 2 α [ ] ρ = ρ + Δρh h + α −z z 2 1 tanh ( ) mod 0 0 d d tanh mod ρ ρ z = Δ
[
− z−z]
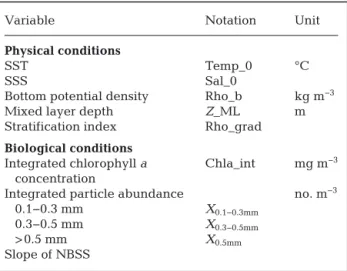
h 2 1 2 0 α α( )Variable Notation Unit
Physical conditions
SST Temp_0 °C
SSS Sal_0
Bottom potential density Rho_b kg m−3
Mixed layer depth Z_ML m Stratification index Rho_grad
Biological conditions
Integrated chlorophyll a Chla_int mg m−3
concentration
Integrated particle abundance no. m−3
0.1−0.3 mm X0.1−0.3mm
0.3−0.5 mm X0.3−0.5mm
> 0.5 mm X0.5mm
Slope of NBSS
Table 2. Physical and biological variables and indices. SST: sea surface temperature; SSS: sea surface salinity; NBSS:
data, it was preferable to have a limited number of habitats for summarizing the information and be able to explain the differences between each region. All statistical tests were carried out using the dudi.pca, kmeans, and index.DB functions of the ‘R’ free statis-tical software (R Development Core Team 2014).
Size spectrum
Normalized biomass size spectra (NBSS) were cal-culated as described by Herman & Harvey (2006). Using logarithmic bins provided high resolution for small sizes and avoided empty classes for large sizes. The biomass within each size class was divided by the class width to normalize the biomass size spec-trum. Finally, each NBBS was divided by the corre-sponding volume of filtered water. A linear regres-sion performed on the NBSS provided the slope and the yintercept of the NBSS. NBSS slopes were cal -culated from the third class (120 µm ESD) to the first empty class in the spectrum. The NBSS slope is linked to the community assimilation efficiency across the size spectrum and the number of trophic levels (Gaedke 1993, Gilabert 2001, Zhou 2006).
RESULTS
Weather conditions and river discharges
During the January survey, strong northerly winds blew regularly and played an important role in homogenizing and cooling the water column. The Rhône River discharge was up to 3410 m3s−1 2 wk
before the survey, well above the annual average (1721 m3s−1; Ludwig et al. 2009) but below extreme
flash flood events (> 5000 m3s−1). In May, the winds
were light with frequent changes in direction, and the Rhône River discharge was slightly below the annual average, down to 1343 m3s−1during the 2 wk
preceding the survey.
Stability of the physical structures
The stability of the physical structures during the survey (6 d for COSTEAU 4 and 5 d for COSTEAU 6) was investigated using ADCP data (not included in this paper) and simulations from the hydrodynamic circulation model MARS-3D. The predictions from the MARS-3D model gave a better, more detailed insight of spatial and temporal scales of variability. The wind conditions and river flows, which are the main factors of non-stationarity over short time scales in the Gulf of Lion, were constant during both sur-veys, resulting in the model predicting nearly stable physical structures. This was in agreement with the low values of currents inferred from ADCP data. We therefore assumed that the spatial distributions were quasi-stationary and good representatives of their mean values over the time scales of the surveys.
Hydrological structures
In January 2011, the effect of the Rhône was limi -ted to the area near the coast, easily identifiable with colder, low salinity surface waters compared to the marine waters (temperature, T < 12°C and salinity,
S < 35; Fig. 3a). The Rhône divides into 2 branches
50 km upstream of the coast, which explains the presence of 2 plumes: 1 to the east associated with the Great Rhône and 1 to the west associated with the Little Rhône. Along the continental slope, S > 38 and high temperature (>13°C) revealed the presence of the NC. Cooling processes take place in the west-ern part of the Gulf of Lion in the shallowest waters (<11.5°C). The slight decrease in salinity was associ-ated with the mouths of several small rivers. Cooling processes were found along Transect D with a tongue of cold water (<11.5°C) in the bottom layer (Fig. 3b). A front separating the continental shelf waters from the NC waters was also clearly identifiable (S > 38 and T > 13°C), 50 km away from the coast. The Rhône River plume was a very thin surface layer near the coast (less than 3 m thick) and diluted vertically towards the open sea.
Fig. 2. Davies-Bouldin index of partitioning efficiency as a function of number of clusters. Lower index values indicate better partitioning. The black arrow shows the number of
Fig. 3. COSTEAU 6 (23 to 27 January 2011): (a) Spatial distributions of sea surface temperature (SST), sea surface salinity (SSS), chlorophyll a (chl a) concentration, and particle concentration (laser optical particle counter [LOPC] counts, 0.1−35 mm equivalent spherical diameter [ESD]). Stations are represented by the black dots and Transects A–F are indicated. (b) Vertical distributions of sea temperature (T ), sea salinity (S), chl a concentration, and particle concentration along Transect D. Black
In May 2010, the Rhône outflow affected a large part of the Gulf of Lion, far out to the west to the coast and to the south up to the continental slope (S < 37 and T > 16°C; Fig. 4a). The tip of the plume curved slightly westward. At the surface, continental shelf waters were only visible in the eastern part of the gulf (S > 38). Transect D in front of the mouth of the Little Rhône crossed the tip of the Great Rhône plume. The spring warming of the surface waters stratifies the water column along the whole transect. In the vicinity of the Rhône River plume, mixing of warmer waters with the fresh water of the plume cre-ated a strong potential density gradient between the surface and bottom layers. The pycnocline was at a depth of around 12 m (Fig. 4b).
Chlorophyll a and zooplankton distributions
During the winter survey (23 to 27 January 2011), the integrated chl a concentrations were highest in coastal waters, in front of the Rhône estuaries and in the coldest waters in the western part of the gulf (Fig. 3a). However, concentrations on the continental shelf were fairly high, generally over 0.5 mg m−3. In the
center of the gulf, the vertical distributions showed 3 identifiable patterns (Fig. 3b): the highest concentra-tions were situated near the coast in the subsurface water layer affected by freshwater inputs, intermedi-ate concentrations were found in continental shelf waters, and the lowest concentrations were in the oli-gotrophic waters of the NC.
The distributions of particle concentrations were correlated with chl a distributions: the highest con-centrations were found near the coast in the west-ern part of the gulf and in front of the estuaries, especially that of the Little Rhône (Fig. 3a). On the continental shelf, the particle concentrations were lower but uniform. In the water column, high parti-cle concentrations were concentrated in a thin layer centered on the pycnocline (Fig. 3b). Farther offshore, some smaller patches appeared near the surface.
During the spring survey (27 April to 2 May 2010), vertically integrated chl a concentrations were not uniformly distributed and, although there were a few hot spots in the coastal area, concentrations were lower than in January (Fig. 4a). Mean concentrations on the continental shelf were also quite low com-pared to January (< 0.3 mg m−3). Along transect D,
chl a vertical distributions were very patchy (Fig. 4b). The highest concentrations were found in the freshest waters at the tip of the Rhône River plume
(>1.5 mg m−3). Deeper, about 40 m, concentrations
occasionally reached 0.5 mg m−3.
The highest particle concentrations were in the coastal area, in both the western and eastern parts of the gulf (>150 × 103counts m−3; Fig. 4a). High
parti-cle concentrations, correlated with the spatial distri-bution of the Rhône River plume, were also present far from the coast on the shelf. Vertical particle distri-butions show several patches distributed in the sub-surface layer at the interface between the warm sur-face waters and the colder continental shelf waters (Fig. 4b). The highest concentrations were found in the Rhône River plume (> 400 × 103counts m−3).
Con-centrations under the pycnocline were quite low (> 30 × 103 counts m−3), although several hot spots
appeared near the bottom on the shelf up to the con-tinental slope.
Analytical results
Statistical tests were performed separately for each data set. In January, the first PC calculated by the PCA had positive coordinates for mixed layer depth and sea surface temperature and negative coordinates for small- and medium-sized particles (Table 3). The second component was defined by the stratification index and the NBSS slope on the positive side and sea surface salinity on the negative. The correlation circle formed by PCs 1 and 2 (Fig. 5a) shows a posi-tive correlation between the abundance of small par-ticles and chl a concentration, and be tween the strat-ification index and the abundance of large particles. In May, the main pattern from the variable coordi-nates was a positive correlation between water col-umn stratification (Rho_grad, Temp_0, and Sal_0) and the abundance of large particles (Table 3). The second component showed that the NBSS slopes were negatively correlated with chl a concentrations and the abundance of small particles. Some of the patterns highlighted by the correlation circle (Fig. 5b) were similar to those found for the January data (Fig. 5a), with similar correlations between the water column stratification and the abundance of large particles and between chl a concentrations and the abundance of small particles.
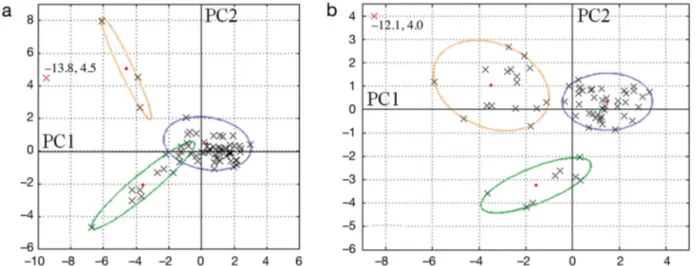
Stations D1 and E1 were considered as outliers for COSTEAU 6 (January) and COSTEAU 4 (May), respectively. These stations gave extreme values which were clearly different from the other stations (Fig. 6). Station D1 was the shallowest station (15 m depth) with extreme values for chl a and particle con-centrations. Station E1, in front of the Rhône River
Fig. 4. COSTEAU 4 (27 April to 2 May 2010): (a) Spatial distributions of sea surface temperature (SST), sea surface salinity (SSS), chlorophyll a (chl a) concentration, and particle concentration (laser optical particle counter [LOPC] counts, 0.1−35 mm equivalent spherical diameter [ESD]). Stations are represented by the black dots and Transects A−F are indicated. (b) Vertical distributions of sea temperature (T ), sea salinity (S ), chl a concentration, and particle concentration along Transect D. Black
mouth, was characterized by the freshest surface waters (Sal_0 < 25) and therefore a very stratified water column (Rho_grad very high).
Habitat mapping
The plot of the 3 groups of stations defined by the cluster analysis pro-duced a consistent spatial represen-tation for the 2 surveys (Fig. 7). In January, Habitat 2 contained only 3 stations directly in front of the Rhône River mouth, whereas in May this habitat covered a large area in front of the Rhône River mouth and along the coast to the west. Habitat 1
cov-Para- ———– COSTEAU 6 –——— ———–– COSTEAU 4 ———— meter PC1 PC2 PC3 PC1 PC2 PC3 (−44.50%) (−24.70%) (−13.50%) (−43.90%) (−19.90%) (−11.60%) Z_ML 0.79 −0.16 −0.39 0.5 0.24 0.54 Rho_grad −0.51 0.76 0.06 −0.75 0.45 −0.29 Temp_0 0.89 0.03 −0.16 −0.78 0.3 −0.22 Sal_0 0.66 −0.65 −0.16 0.82 −0.37 0.28 Rho_b 0.13 0.38 0.72 0.44 0 −0.57 Chla_int −0.67 −0.55 −0.12 −0.39 −0.56 −0.02 X0.1−0.3mm −0.84 −0.47 −0.09 −0.7 −0.62 0.06 X0.3−0.5mm −0.89 −0.03 −0.32 −0.86 −0.26 0.29 X0.5mm −0.4 0.59 −0.59 −0.8 0.12 0.43 NBSS slope 0.46 0.65 −0.39 −0.03 0.85 0.25 Table 3. Correlation coefficients of the parameters (with percentages of the total variance in parentheses) for the 3 first principal components for COSTEAU 6 (January) and COSTEAU 4 (May). Significant coefficients of each component are shown in bold. Parameter abbreviations are defined in Table 2; NBSS:
normalized biomass size spectrum
Fig. 5. Principal component analysis correlation circle on axes 1 and 2 for (a) COSTEAU 6 (January) and (b) COSTEAU 4 (May). Abbreviations are given in Table 2
Fig. 6. Positions of the stations (gray crosses) in the plane formed by the first 2 principal components for (a) COSTEAU 6 (January) and (b) COSTEAU 4 (May). The results of cluster analysis are represented using the minimum volume enclosing ellipsoid function. Red crosses represent (a) Station D1 and (b) Station E1, which are considered to be outliers. Red diamonds
ered only the west part of the coast in May, but in January it included an ad-ditional area in the center. Habitat 3 was the most extensive of the 3 habi-tats, containing all stations situated along the slope and in the eastern part of the gulf to the Bay of Marseilles. There were similarities between the distribution and the characteristics of the 3 habitats even though statistical tests were performed independently on the 2 data sets. The means of the variables defining the 3 habitats showed the following features (Table 4): • Habitat 1, coastal area: shallow
waters, steep NBSS slope, high chl a concentration
• Habitat 2, area affected by the Rhône: marked stratification, flat NBSS slope • Habitat 3, continental shelf: deep mixed layer, low density gradient, low particle concentrations
Habitat characteristics
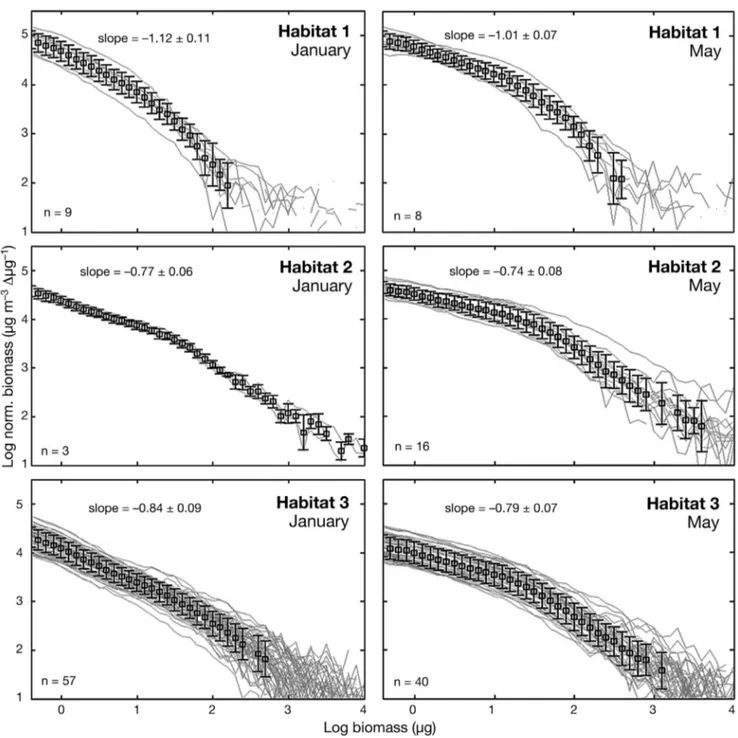
To confirm the definition of the habi-tats, the size spectra of living and non-living particles from 100 µm to 5 mm ESD were investigated using NBSS (Fig. 8). NBSS showed diffe r ent pat-terns between the 2 surveys in each of the 3 habitats. In general, NBSS shapes were linear in January whereas a break point appeared around 1.5 log(µg) for May stations, and the mean NBSS slopes were steeper in January than in May. Within each survey, the NBSS slopes were steepest in Habitat 1,
ow-Fig. 7. Spatial distribution of the 3 habitats defined by the cluster analysis for (a) COSTEAU 6 (January) and (b) COSTEAU 4 (May). Habitat 1 (green) corre-sponds to ‘coastal area,’ Habitat 2 (red) to ‘area affected by the Rhône,’ and
Habitat 3 (blue) to ‘continental shelf.’ Black dots represent the stations
Z_ML Rho_grad Temp_0 Sal_0 Rho_b Chla_int X0.1−0.3mm X0.3−0.5mm X0.5mm NBSS slope
January Habitat 1 18 0.07 11.35 37.08 28.69 0.93 127 910 6119 890 −1.15 Habitat 2 1 1.46 11.57 33.88 28.71 0.47 63 480 7610 2730 −0.79 Habitat 3 74 0.02 12.58 37.70 28.70 0.53 35 620 2932 1207 −0.85 May Habitat 1 1.8 0.13 16.16 36.78 28.72 0.50 165 491 14 800 3075 −1.03 Habitat 2 2.6 0.59 17.26 34.95 28.64 0.38 89 478 15 480 6389 −0.74 Habitat 3 5.3 0.13 16.19 37.07 28.73 0.32 31 656 4698 1632 −0.80 Table 4. Mean values of the parameters within the 3 habitats for the 2 campaigns. Parameter abbreviations are defined in
ing to the high abundances of small particles (< 0.9 log(µg); 0.3 mm ESD) and flattest in Habitat 2, owing to the high abundances of large particles (>1.6 log(µg); 0.5 mm ESD). In Habitat 3, NBSS slopes had intermediate values and a lower y-intercept.
Based on the spatial proportion, i.e. the ratio be -tween the number of stations included in the habitat and the total number of stations, and the mean parti-cle concentrations in each habitat (Table 4), the
indi-cators of the contributions to the global zooplankton stock were calculated for 3 size classes in January and May (Table 5). In January, most of the medium to large organisms were concentrated in the continental shelf habitat, while the small organisms used both the continental shelf and the coastal area. In May, most of the large organisms were in the area affected by the Rhône, while small organisms were equally distributed across the 3 habitats.
Fig. 8. Normalized biomass size spectrum (NBSS) of the stations (light grey lines) included in the 3 habitats (see Fig. 7) for the 2 campaigns. The mean NBSS and standard deviation for each habitat is represented by the squares and the error bars. Mean
DISCUSSION LOPC data
The use of in situ optical counters in coastal regions and stratified waters could be tricky owing to high particle concentration peaks caused by resuspension and aggregation processes. For the LOPC, coinci-dence issues could result in incoherent element plankton (MEP) sequences and an overesti-mation of large-particle abundances. Schultes & Lopes (2009) suggested the ratio of Total Count (TC):MEP Count as an indicator to show whether a profile is coherent. If this ratio drops below 20, the system has been probably overloaded by MEP counts during counting. In the present study, incoherent MEP sequences appeared in stratified waters (9 out of 135 stations) and did not always correspond to a TC:MEP ratio below 20 (2 out of 135 stations). This is probably because the ratio was integrated along the water column and its mean value will depend on the height of the water column under the pycnocline, where the ratio is generally very low owing to high transparent aggregate concentrations. Basedow et al. (2014) showed that in polar regions, a low TC:MEP ratio can also be the result of a high concentration of large organisms. In all cases, the number of profiles concerned in this study is low and we consider that the conditions were suitable for LOPC during the surveys.
Physical processes
The regions of freshwater influence (Simpson 1997) for the Rhône River were different for the 2 surveys. The plume position, movement, and dilution were closely associated with wind conditions. During the January survey, strong northerly winds mixed the water column and diluted the Rhône River plume, leaving only a small area affected by the freshwater
input. In May, a lens of freshwater was separated from the rest of the plume (Fig. 4a). Light winds pushed the plume southwards. At the same time, the Coriolis force caused the tip of the plume to drift to the west (Ekman transport). The creation of freshwater lenses and, more generally, the stratification of the water column at this time imply that a large part of the gulf was affected by the Rhône River discharge during the May survey.
The NC separates the continental shelf from the open sea. Intrusions were recorded along Transect D in the east of the gulf in January (Fig. 3b). At this time, the NC was narrow, strong, and close to the slope with frequent intrusions onto the shelf (Estournel et al. 2003, Petrenko 2003). Saltier and ultra- oligotrophic waters carried by the NC intrude onto the shelf and create a front with the continental shelf waters. In the coastal western part of the gulf, the cold, strong northerly winds cool the shallowest waters and mix them with freshwaters coming from the Rhône River and other sources (Broche et al. 1998, Petrenko 2003).
Environmental conditions
Hydrodynamic conditions in the coastal area have a significant influence on the distribution and avail-ability of nutrients and therefore drive the distribu-tion and the populadistribu-tion dynamics of primary produc-ers. In the Gulf of Lion, the winds and the fluvial inputs are the 2 main factors affecting the physical structures. The combination of these 2 factors creates 2 main highly productive areas, viz. the nearshore area and the area where the Rhône river plume is diluted (Champalbert 1996, Lefevre et al. 1997, Gaudy et al. 2003), corresponding to 2 of the 3 habi-tats identified by statistical analysis in this study.
The habitat in the nearshore area is characterized by shallow mixed waters and high chl a concentra-tions. In this area (< 50 m depth), biological produc-tion was increased by nutrient-rich freshwater dis-charges and wind-driven resuspension, especially in the western part, where there are many river mouths and the Tramontane is frequent and strong.
The habitat in the area affected by the Rhône waters is characterized by stratified waters caused by the freshwater runoff in a thin surface layer. The Rhône River plume has food webs that are time dependent and can be divided into several steps from microbial loop dominance at the mouth, to large size
———— January ———— ————— May —————
X0.1–0.3mm X0.3−0.5mm X0.5mm X0.1−0.3mm X0.3−0.5mm X0.5mm
Habitat 1 L M S M S S
Habitat 2 VS S S M L VL Habitat 3 L VL VL M M L Table 5. Indicators of zooplankton stock for each habitat estimated from the spatial proportion and the mean particle concentrations (VS: very small; S: small; M: medium; L: large, VL: very large) within 3 size classes during January and May surveys. Spatial distribution of the habitats is
phytoplankton production a few days later (Diaz et al. 2008). The combination of high chl a concentra-tion in the surface waters with a stratified water col-umn results in an increase in biomass at the interface of the water masses which is caused by a slowing down of the sinking biomass and aggregation pro-cesses at the pycnocline (Alldredge et al. 2002, Checkley et al. 2008, Jackson & Checkley 2011). This represents an important source of food for zooplank-ton which come to feed at the front between the water masses (Gaudy et al. 1990, 1996, Pagano et al. 1993). The spread of this habitat is closely linked to the hydroclimatic conditions, especially thermal stratification and wind.
The third habitat was characterized by the mean conditions on the continental shelf and was less affected by coastal dynamic variability. The biologi-cal production was lower in this area than in the other 2 habitats, owing to the oligotrophic influence of the NC and to the lack of nutrient inputs.
Zooplankton habitats
Based on the zooplankton size structure and the environmental conditions, 3 zooplankton habitats were defined (Table 4, Fig. 7). In this study, vertical information was integrated to produce 2D habitat maps that are easier to use and visualize. Defining habitats is a statistical way of analyzing the distribu-tion of zooplankton communities as a funcdistribu-tion of environmental conditions (Zarauz et al. 2007, Schulz et al. 2012). This approach is particularly useful for continental shelves and, more generally, coastal areas where changing physical structures have a sig-nificant effect on the marine ecosystems by creating different environmental patterns. Given the variabil-ity of the physical structures, habitats can only be identified by mapping the study area at high spatial resolution and checking that the physical structures are stable during the surveys. Using in situ optical captors was less time-consuming than traditional sampling and provides characteristics of size spectra as indicators of zooplankton communities. The pro-cesses which shape the habitats lead to different zoo-plankton size structure characterized by changes in NBSS slopes (Fig. 8).
Mixed-water ecosystems are known to promote small mesozooplankton production (Jackson et al. 1997, Checkley et al. 2008), which is in agreement with the steep NBSS measured in the nearshore habitat. It is likely that the highly variable hydro -logical conditions in the shallowest waters are not
favorable to the development of large-sized species. The steepness of the slope indicates a short food web adapted to episodic phytoplankton bloom driven by winds. This habitat is the most productive during the winter and supports biological production within the Gulf of Lion when production on the shelf is low (Kouwenberg 1994, Gaudy et al. 2003). Moreover, despite the small area covered by this habitat, there was a large stock of small-sized species in January (Table 5).
Stratified ecosystems encourage the development of large copepods (Williams et al. 1994, Poulet et al. 1996, Sourisseau & Carlotti 2006), which is confirmed by the flat NBSS found in the habitat closely associ-ated with the spreading of the Rhône waters. The diversity of food sources prevented food limitation for zooplankton and encouraged the biodiversity of spe-cies resulting in the ecosystem being efficient at transferring the biomass from the small to large organisms, illustrated by the flattening of the slopes (Zhou et al. 2009, Basedow et al. 2010). When the water is stratified and the Rhône waters are spread widely, as during the May survey, this habitat is a refuge for large zooplankton species (Table 5).
A coastal to offshore gradient in particle concentra-tions was observed during this study which agrees with previous surveys conducted in the Gulf of Lion (Kouwenberg 1994, Gaudy et al. 2003). The third habitat was the main part of the continental shelf, the continental slope, and the eastern end of the gulf and had lower particle concentrations than the other habitats. The oligotrophic influence of the NC was clear, especially in the eastern part of the shelf. How-ever, this habitat is larger than the other 2 and is an important reserve for large species during the winter (Table 5).
The differences between the NBSSs for the habi-tats confirm that the size structures and, therefore, zooplankton communities were not the same, show-ing that they were distinct zooplankton habitats, or ‘guilds,’ according to the classification proposed by Costello (2009).
Use and future of habitat definition
Based on data from field samples over 2 periods, our study shows a significant correlation between physical and biological features (Fig. 5, Table 3). Although statistical analysis was performed sepa-rately on the data sets for each survey, the character-istics of the habitats are similar. This is due to the per-manent presence of certain processes, such as the
Rhône water runoff and the wind-driven mixing of coastal waters, which drive the distribution of the habi-tats. Therefore, changes in the distribution of habitats can be determined by identifying the variables which characterize these processes and by estimating the values of these variables at high spatio-temporal res-olution using simulations from hydro logical models (Planque et al. 2004, Zarauz et al. 2007). Remote sensing data also provide certain variables that are characteristic of the surface layer. These types of data can be used to determine spatial distribution of the habitats during the year.
Defining habitats provides a firm basis for develop-ing efficient sampldevelop-ing strategies for studydevelop-ing zoo-plankton dynamics by defining a limited number of stations that are representative of specific conditions. By mapping large, consistent habitats to collate the information on zooplankton distribution and charac-teristics, defining habitats is the best way of in -cluding zooplankton communities in trophodynamic studies, especially in the Gulf of Lion which is consid-ered to be one of the main reproduction areas for small pelagic species (Plounevez & Champalbert 2000, Palomera et al. 2007). Furthermore, determin-ing habitats with distinct zooplankton size structures provides important information given that recent studies have highlighted the role of prey size in the recruitment success of fish larvae (Irigoien et al. 2009, Costalago et al. 2011). Defining habitats would also be useful for validating zooplankton distribution models and estimating indicators of zooplankton stocks in different parts of and over the whole gulf, as shown in Table 5. This type of information is suitable for coastal management programs, such as coastal ecosystem observatory networks, in order to deter-mine the best means for protecting and preserving coastal marine ecosystems.
Acknowledgements. We acknowledge the Captain and crews
of the RV ‘Téthys II’ for their assistance during the cruise. We thank A. Desnues for the laboratory assessment of chl a concentrations. This study was supported by the Agence Nationale de la Recherche (ANR): ANR COSTAS funded the research cruises and laboratory analysis, whereas the ANR FOCEA funded the optical sensors implemented and used during the cruises and the data analysis from these captors. The manuscript was improved by comments from 3 anony-mous reviewers.
LITERATURE CITED
Alldredge AL, Cowles TJ, MacIntyre S, Rines JEB and others (2002) Occurrence and mechanisms of formation of a dramatic thin layer of marine snow in a shallow Pac ific fjord. Mar Ecol Prog Ser 233:1−12
Aminot A, Kérouel R (2004) Hydrologie des écosystèmes marins: paramètres et analyses. Ifremer, Plouzané Andersen KH, Beyer JE, Lundberg P (2009) Trophic and
individual efficiencies of size-structured communities. Proc R Soc Lond B Biol Sci 276:109−114
André G, Garreau P, Garnier V, Fraunié P (2005) Modelled variability of the sea surface circulation in the North-western Mediterranean Sea and in the Gulf of Lions. Ocean Dyn 55:294−308
Ba˘ naru D, Mellon-Duval C, Roos D, Bigot JL and others (2013) Trophic structure in the Gulf of Lions marine ecosystem (north-western Mediterranean Sea) and fishing impacts. J Mar Syst 111−112:45−68
Basedow SL, Tande KS, Zhou M (2010) Biovolume spectrum theories applied: spatial patterns of trophic levels within a mesozooplankton community at the polar front. J Plankton Res 32:1105−1119
Basedow SL, Tande KS, Norrbin MF, Kristiansen SA (2013) Capturing quantitative zooplankton information in the sea: performance test of laser optical plankton counter and video plankton recorder in a Calanus finmarchicus dominated summer situation. Prog Oceanogr 108:72−80 Basedow SL, Zhou M, Tande KS (2014) Secondary produc-tion at the Polar Front, Barents Sea, August 2007. J Mar Syst 130:147−159
Bellido J, Brown A, Valavanis V, Giráldez A, Pierce G, Iglesi as M, Palialexis A (2008) Identifying essential fish habitat for small pelagic species in Spanish Mediterran-ean waters. Hydrobiologia 612: 171–184
Broche P, Devenon JL, Forget P, de Maistre JC, Naudin JJ, Cauwet G (1998) Experimental study of the Rhone plume. Part I: physics and dynamics. Oceanol Acta 21: 725−738 Champalbert G (1996) Characteristics of zooplankton stand-ing stock and communities in the Western Mediterran-ean Sea: relations to hydrology. Sci Mar 60:97−113 Checkley DM Jr, Davis RE, Herman AW, Jackson GA,
Bean-lands B, Regier LA (2008) Assessing plankton and other particles in situ with the SOLOPC. Limnol Oceanogr 53: 2123−2136
Costalago D, Tecchio S, Palomera I, Álvarez-Calleja I, Ospina-Álvarez A, Raicevich S (2011) Ecological under-standing for fishery management: condition and growth of anchovy late larvae during different seasons in the Northwestern Mediterranean. Estuar Coast Shelf Sci 93:350−358
Costalago D, Navarro J, Álvarez-Calleja I, Palomera I (2012) Ontogenetic and seasonal changes in the feeding habits and trophic levels of two small pelagic fish species. Mar Ecol Prog Ser 460:169−181
Costello MJ (2009) Distinguishing marine habitat classifica-tion concepts for ecological data management. Mar Ecol Prog Ser 397:253−268
Davies DL, Bouldin DW (1979) A cluster separation meas-ure. IEEE Trans Pattern Anal Machine Intellig 1:224− 227 Davis CS, Hu Q, Gallager SM, Tang X, Ashjian CJ (2004) Real-time observation of taxa-specific plankton distribu-tions: an optical sampling method. Mar Ecol Prog Ser 284: 77−96
Diaz F, Naudin JJ, Courties C, Rimmelin P, Oriol L (2008) Biogeochemical and ecological functioning of the low-salinity water lenses in the region of the Rhone River freshwater influence, NW Mediterranean Sea. Cont Shelf Res 28:1511−1526
Estournel C, Durrieu de Madron X, Marsaleix P, Auclair F, Julliand C, Vehil R (2003) Observation and modeling
➤
➤
➤
➤
➤
➤
➤
➤
➤
➤
➤
➤
➤
➤
➤
➤
of the winter coastal oceanic circulation in the Gulf of Lion under wind conditions influenced by the conti -nental orography (FETCH experiment). J Geophys Res 108:8059, doi:10.1029/2001JC000825
Finlay K, Beisner B, Barnett A (2007) The use of the laser optical plankton counter to measure zooplankton size, abundance, and biomass in small freshwater lakes. Lim-nol Oceanogr Methods 5:41−49
Gaardsted F, Tande KS, Basedow SL (2010) Measuring copepod abundance in deep-water winter habitats in the NE Norwegian Sea: intercomparison of results from laser optical plankton counter and multinet. Fish Oceanogr 19:480−492
Gaedke U (1993) Ecosystem analysis based on biomass size distributions: a case study of a plankton community in a large lake. Limnol Oceanogr 38:112−127
Gaudy R, Pagano M, Lochet F (1990) Zooplankton feeding on seston in the Rhone River plume area (NW Mediterra -nean Sea) in May 1988. Hydrobiologia 207:241−249 Gaudy R, Bianchi M, Pagano M, Soto Y (1996) Cross frontal
variability in hydrological and biological structures observed in a river plume area (Rhône mouth, NW Medi-terranean Sea). Hydrobiologia 324:131−140
Gaudy R, Youssara F, Diaz F, Raimbault P (2003) Biomass, metabolism and nutrition of zooplankton in the Gulf of Lions (NW Mediterranean). Oceanol Acta 26:357−372 Giannoulaki M, Pyrounaki MM, Liorzou B, Leonori I and
others (2011) Habitat suitability modelling for sardine juveniles (Sardina pilchardus) in the Mediterranean Sea. Fish Oceanogr 20:367−382
Gilabert J (2001) Short-term variability of the planktonic size structure in a Mediterranean coastal lagoon. J Plankton Res 23:219−226
Herman AW, Harvey M (2006) Application of normalized biomass size spectra to laser optical plankton counter net intercomparisons of zooplankton distributions. J Geo-phys Res 111:C05S05, doi:10.1029/2005JC002948 Herman AW, Beanlands B, Phillips EF (2004) The next
generation of optical plankton counter: the Laser-OPC. J Plankton Res 26:1135−1145
Irigoien X, Fernandes JA, Grosjean P, Denis K, Albaina A, Santos M (2009) Spring zooplankton distribution in the Bay of Biscay from 1998 to 2006 in relation with anchovy recruitment. J Plankton Res 31:1−17
Jackson GA, Checkley DM Jr (2011) Particle size distribu-tions in the upper 100 m water column and their implica-tions for animal feeding in the plankton. Deep-Sea Res I 58:283−297
Jackson GA, Maffione R, Costello DK, Alldredge AL, Logan BE, Dam HG (1997) Particle size spectra between 1 µm and 1 cm at Monterey Bay determined using multiple instruments. Deep-Sea Res I 44:1739−1767
Jiang S, Dickey TD, Steinberg DK, Madin LP (2007) Tem -poral variability of zooplankton biomass from ADCP backscatter time series data at the Bermuda Testbed Mooring site. Deep-Sea Res I 54:608−636
Kouwenberg JHM (1994) Copepod distribution in relation to seasonal hydrographics and spatial structure in the north-western Mediterranean (Golfe du Lion). Estuar Coast Shelf Sci 38:69−90
Labat JP, Gasparini S, Mousseau L, Prieur L, Boutoute M, Mayzaud P (2009) Mesoscale distribution of zooplankton biomass in the northeast Atlantic Ocean determined with an optical plankton counter: relationships with environ-mental structures. Deep-Sea Res I 56:1742−1756
Lefevre D, Minas HJ, Minas M, Robinson C, Le B, Williams PJ, Woodward EMS (1997) Review of gross community production, primary production, net community produc-tion and dark community respiraproduc-tion in the Gulf of Lions. Deep-Sea Res II 44:801−832
Ludwig W, Dumont E, Meybeck M, Heussner S (2009) River discharges of water and nutrients to the Mediterranean and Black Sea: Major drivers for ecosystem changes dur-ing past and future decades? Prog Oceanogr 80:199−217 Matsuno K, Yamaguchi A, Imai I (2012) Biomass size spectra of mesozooplankton in the Chukchi Sea during the sum-mers of 1991/1992 and 2007/2008: an analysis using opti-cal plankton counter data. ICES J Mar Sci 69:1205−1217 Mikkelsen O, Pejrup M (2001) The use of a LISST-100 laser particle sizer for in-situ estimates of floc size, density and settling velocity. Geo-Mar Lett 20:187−195
Millot C (1990) The Gulf of Lions’ hydrodynamics. Cont Shelf Res 10:885−894
Möller KO, St. John M, Temming A, Floeter J, Sell AF, Herr -mann JP, Möll-mann C (2012) Marine snow, zooplankton and thin layers: indications of a trophic link from small-scale sampling with the Video Plankton Recorder. Mar Ecol Prog Ser 468:57−69
Nicolle A, Garreau P, Liorzou B (2009) Modelling for anchovy recruitment studies in the Gulf of Lions (West-ern Mediterranean Sea). Ocean Dyn 59:953−968 Nikolioudakis N, Isari S, Pitta P, Somarakis S (2012) Diet of
sardine Sardina pilchardus: an ‘end-to-end’ field study. Mar Ecol Prog Ser 453:173−188
Ohman MD, Powell JR, Picheral M, Jensen DW (2012) Mesozooplankton and particulate matter responses to a deep-water frontal system in the southern California Current System. J Plankton Res 34:815−827
Pagano M, Gaudy R, Thibault D, Lochet F (1993) Vertical migrations and feeding rhythms of mesozooplanktonic organisms in the Rhône River Plume area (North-west Mediterranean Sea). Estuar Coast Shelf Sci 37:251−269 Palomera I, Olivar MP, Salat J, Sabatés A, Coll M, García A, Morales-Nin B (2007) Small pelagic fish in the NW Medi-terranean Sea: an ecological review. Prog Oceanogr 74:377−396
Petrenko AA (2003) Variability of circulation features in the Gulf of Lion NW Mediterranean Sea. Importance of iner-tial currents. Oceanol Acta 26:323−338
Petrenko A, Leredde Y, Marsaleix P (2005) Circulation in a stratified and wind-forced Gulf of Lions, NW Mediter-ranean Sea: in situ and modeling data. Cont Shelf Res 25:7−27
Petrik CM, Jackson GA, Checkley DM Jr (2013) Aggregates and their distributions determined from LOPC observa-tions made using an autonomous profiling float. Deep-Sea Res I 74:64−81
Picheral M, Guidi L, Stemmann L, Karl DM, Iddaoud G, Gorsky G (2010) The Underwater Vision Profiler 5: an advanced instrument for high spatial resolution studies of particle size spectra and zooplankton. Limnol Oceanogr Methods 8:462−473
Planque B, Lazure P, Jégou AM (2004) Detecting hydrologi-cal landscapes over the Bay of Biscay continental shelf in spring. Clim Res 28:41−52
Planque B, Bellier E, Lazure P (2007) Modelling potential spawning habitat of sardine (Sardina pilchardus) and anchovy (Engraulis encrasicolus) in the Bay of Biscay. Fish Oceanogr 16:16−30
Plounevez S, Champalbert G (2000) Diet, feeding behaviour
➤
➤
➤
➤
➤
➤
➤
➤
➤
➤
➤
➤
➤
➤
➤
➤
➤
➤
➤
➤
➤
➤
➤
➤
➤
➤
➤
➤
➤
➤
➤
➤
➤
and trophic activity of the anchovy (Engraulis encrasi
-colus L.) in the Gulf of Lions (Mediterranean Sea).
Oceanol Acta 23:175−192
Poulet SA, Laabir M, Chaudron Y (1996) Characteristic fea-tures of zooplankton in the Bay of Biscay. Sci Mar 60 (Suppl 2):79−95
Powell JR, Ohman MD (2012) Use of glider-class acoustic Doppler profilers for estimating zooplankton biomass. J Plankton Res 34:563−568
Pujo-Pay M, Conan P, Joux F, Oriol L, Naudin JJ, Cauwet G (2006) Impact of phytoplankton and bacterial production on nutrient and DOM uptake in the Rhône River plume (NW Mediterranean). Mar Ecol Prog Ser 315:43−54 R Development Core Team (2014) R: a language and
envi-ronment for statistical computing. R Foundation for Sta-tistical Computing, Vienna
Raimbault P, Durrieu de Madron X (2003) Research activi-ties in the Gulf of Lion (NW Mediterranean) within the 1997−2001 PNEC project. Oceanol Acta 26:291−298 Riandey V (2005) Etude de la structure de taille des popu
-lations zooplanctoniques dans différents écosystèmes marins. Apports des nouveaux appareils automatisés d’observation. PhD thesis, Université de la Méditerra-née, Marseille
Rubio A, Taillandier V, Garreau P (2009) Reconstruction of the Mediterranean northern current variability and asso-ciated cross-shelf transport in the Gulf of Lions from satellite-tracked drifters and model outputs. J Mar Syst 78(Suppl):S63−S78
Salas-Berrios F, Valdés-Aguilera J, Landaeta M, Bustos C, Pérez-Vargas A, Balbontín F (2013) Feeding habits and diet overlap of marine fish larvae from the peri-Antarctic Magellan region. Polar Biol 36:1401−1414
Sano M, Maki K, Nishibe Y, Nagata T, Nishida S (2013) Feeding habits of mesopelagic copepods in Sagami Bay: insights from integrative analysis. Prog Oceanogr 110: 11−26
Schlitzer R (2014) Ocean Data View 4. Available at http:// odv.awi.de
Schultes S, Lopes RM (2009) Laser optical plankton counter and Zooscan intercomparison in tropical and subtropical marine ecosystems. Limnol Oceanogr Methods 7:771− 784
Schultes S, Sourisseau M, Le Masson E, Lunven M, Marié L (2013) Influence of physical forcing on mesozooplankton communities at the Ushant tidal front. J Mar Syst 109− 110 (Suppl):S191−S202
Schulz J, Peck MA, Barz K, Schmidt JO and others (2012) Spatial and temporal habitat partitioning by zooplankton in the Bornholm Basin (central Baltic Sea). Prog Oceanogr 107:3−30
Simpson JH (1997) Physical processes in the ROFI regime. J Mar Syst 12:3−15
Sourisseau M, Carlotti F (2006) Spatial distribution of zoo-plankton size spectra on the French continental shelf of the Bay of Biscay during spring 2000 and 2001. J Geo-phys Res 111:C05S09, doi: 10.1029/2005JC003063 Tarling GA, Stowasser G, Ward P, Poulton AJ and others
(2012) Seasonal trophic structure of the Scotia Sea pelagic ecosystem considered through biomass spectra and stable isotope analysis. Deep-Sea Res II 59−60: 222−236
Troupin C, Barth A, Sirjacobs D, Ouberdous M and others (2012) Generation of analysis and consistent error fields using the data interpolating variational analysis (DIVA). Ocean Model Online 52−53:90−101
Tugores MP, Giannoulaki M, Iglesias M, Bonanno A and others (2011) Habitat suitability modelling for sardine
Sardina pilchardus in a highly diverse ecosystem: the
Mediterranean Sea. Mar Ecol Prog Ser 443:181−205 Williams R, Conway DVP, Hunt HG (1994) The role of
cope-pods in the planktonic ecosystems of mixed and stratified waters of the European shelf seas. Hydrobiologia 292– 293:521−530
Yanagi T (2000) Coastal oceanography, Kluwer Publishers, Dordrecht
Zarauz L, Irigoien X, Urtizberea A, Gonzalez M (2007) Map-ping plankton distribution in the Bay of Biscay during three consecutive spring surveys. Mar Ecol Prog Ser 345:27−39
Zhou M (2006) What determines the slope of a plankton bio-mass spectrum? J Plankton Res 28:437−448
Zhou M, Tande KS, Zhu Y, Basedow S (2009) Productivity, trophic levels and size spectra of zooplankton in northern Norwegian shelf regions. Deep-Sea Res II 56:1934−1944
Editorial responsibility: Antonio Bode, A Coruña, Spain
Submitted: October 25, 2013; Accepted: March 27, 2014 Proofs received from author(s): June 3, 2014

![Fig. 3. COSTEAU 6 (23 to 27 January 2011): (a) Spatial distributions of sea surface temperature (SST), sea surface salinity (SSS), chlorophyll a (chl a) concentration, and particle concentration (laser optical particle counter [LOPC] counts, 0.1−35 mm equi](https://thumb-eu.123doks.com/thumbv2/123doknet/13695321.432794/7.918.132.783.120.1023/costeau-january-spatial-distributions-temperature-chlorophyll-concentration-concentration.webp)
![Fig. 4. COSTEAU 4 (27 April to 2 May 2010): (a) Spatial distributions of sea surface temperature (SST), sea surface salinity (SSS), chlorophyll a (chl a) concentration, and particle concentration (laser optical particle counter [LOPC] counts, 0.1−35 mm equ](https://thumb-eu.123doks.com/thumbv2/123doknet/13695321.432794/9.918.126.792.115.1026/costeau-spatial-distributions-temperature-salinity-chlorophyll-concentration-concentration.webp)