HAL Id: hal-01166843
https://hal.archives-ouvertes.fr/hal-01166843
Submitted on 23 Jun 2015
HAL is a multi-disciplinary open access archive for the deposit and dissemination of sci-entific research documents, whether they are pub-lished or not. The documents may come from teaching and research institutions in France or abroad, or from public or private research centers.
L’archive ouverte pluridisciplinaire HAL, est destinée au dépôt et à la diffusion de documents scientifiques de niveau recherche, publiés ou non, émanant des établissements d’enseignement et de recherche français ou étrangers, des laboratoires publics ou privés.
harmonic emission from thin overdense plasmas
H George, F Quéré, Cédric Thaury, G Bonnaud, Ph Martin
To cite this version:
H George, F Quéré, Cédric Thaury, G Bonnaud, Ph Martin. New Journal of Physics Mechanisms of forward laser harmonic emission from thin overdense plasmas. New Journal of Physics, Institute of Physics: Open Access Journals, 2009, 11, pp.113028. �10.1088/1367-2630/11/11/113028�. �hal-01166843�
T h e o p e n – a c c e s s j o u r n a l f o r p h y s i c s
New Journal of Physics
Mechanisms of forward laser harmonic emission
from thin overdense plasmas
H George, F Quéré, C Thaury, G Bonnaud and Ph Martin
CEA, IRAMIS, Service des Photons Atomes et Molécules, F-91191 Gif-sur-Yvette, France
E-mail:fabien.quere@cea.fr
New Journal of Physics11 (2009) 113028 (13pp)
Received 1 July 2009
Published 13 November 2009 Online athttp://www.njp.org/
doi:10.1088/1367-2630/11/11/113028
Abstract. As a intensity laser pulse impinges a thin solid foil, high-order harmonics of the incident frequency can be observed at the rear (non-illuminated) side of this foil. Using numerical simulations, we show that these harmonics can be generated either at the front or at the rear side of the target. We analyze the mechanisms responsible for these two types of emission, and discuss their connection with those involved in the generation of harmonics detected on the front side. The combined measurements of spectra on both sides of the target constitute a powerful, but often nontrivial, probe of the ultrafast plasma dynamics.
Contents
1. Introduction 2
2. Two regimes of forward harmonic generation 2
3. Rear-side forward harmonic emission 4
4. Relativistic forward harmonic emission 8
5. Conclusion 12
Acknowledgments 12
References 12
1. Introduction
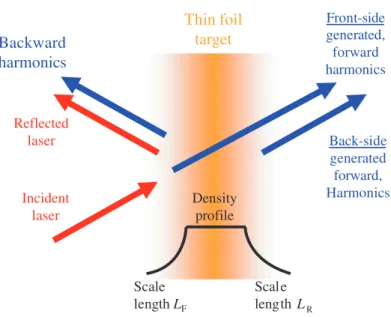
Two main motivations drive the study of high-order harmonic generation (HHG) of laser pulses on dense plasmas. Firstly, it is anticipated to be a source of attosecond pulses that would be shorter and more intense than those produced so far by HHG in gases [1]. Secondly, it constitutes a powerful and unique in situ diagnostic of the dynamics of plasmas driven by intense laser fields [2]. In this respect, forward harmonic emission on thin foils—i.e. harmonics detected at the rear side of the target (figure1)—has been highlighted as a particularly simple way to probe the generating plasma [3]–[8].
The basic idea underlying the first studies assumed that these harmonics can only be generated at the front (laser-illuminated) side of the foil, i.e. within the skin depth δ, where the laser field directly couples to the plasma and is reflected. To be collected at the rear side of a thin target, these harmonics then have to propagate through the foil. Only harmonics above the maximum plasma frequency ωmaxp found in the target can do so, leading to a low-frequency cut-off in the spectrum, which can be used to determine the maximum plasma density
nmaxe ∝ (ωmaxp )2during the interaction [3,4,6].
In the recent years though, experiments have suggested a much more complicated scenario, which has not yet been fully analyzed. While Hässner et al [5] reported the experimental observation of a low-frequency cutoff aroundωmax
p , a subsequent work [7] in a similar interaction
regime yielded the opposite result, i.e. a harmonic signal up toωmax
p , and no signal beyond this
high-frequency cutoff. Finally, a recent experiment at higher intensities [8] again tended to support a low frequency cutoff, and suggested a new way to exploit forward harmonic emission to probe the plasma: compared with backward harmonics (i.e. detected in the reflected beam; see figure 1), a spectral broadening of individual forward harmonics was observed, and was attributed to a phase modulation induced by the evolving plasma, as these harmonics propagate across the ionized foil. This effect was used to get information on the plasma heating by the laser pulse, which affects the plasma refractive index and thus contributes to this phase modulation.
In this paper, we propose a general perspective by presenting a numerical analysis of forward harmonic emission on thin foils, in conditions relevant to these experiments (foil thickness e> δ, a0= (I λ20/1.32 × 1018W cm−2µm2)1/2. 10, where I is the laser intensity and
λ0 the laser wavelength). Our goal is however not to provide thorough interpretations of these
experiments, as this would require detailed knowledge of the experimental conditions (such as the laser pulse contrast), but rather to reveal the most important physical effects which are involved. To this end, this paper focuses on particular choices of physical conditions that enable us to clearly isolate the relevant physical processes.
We thus show that forward harmonics can be generated either at the front or at the rear side, by two very different mechanisms: while front-side generation is due to a Doppler effect, rear-side generation corresponds to a particular configuration of coherent wake emission (CWE) [7,9]. Our study reveals some of the effects that have to be taken into account when attempting to exploit forward HHG spectra to gather information on the generating plasma, and more generally provides new insight into the mechanisms of HHG in overdense plasmas.
2. Two regimes of forward harmonic generation
To investigate the origin of forward harmonic generation, numerical simulations were performed using the one-dimensional (1D) 1/2 relativistic particle-in-cell (PIC) code EUTERPE [10]. This
Thin foil target Incident laser Reflected laser Backward harmonics Back-side generated forward, Harmonics Front-side generated, forward harmonics Density profile Scale length LF Scale length LR
Figure 1. Schematic of backward and forward harmonic generation in the interaction of an intense laser field with a thin foil.
code exploits a Lorentz transformation to a boosted frame along the target surface (the y-axis), to simulate the oblique incidence in the x–y plane of a p-polarized laser onto a plasma of density
n nc, where ncrefers to the critical density for the incident laser wavelength. Unless otherwise
stated, the laser pulse has an intensity envelop of sin2 shape, with a full temporal width of 20 optical periods (≈ 50 fs for an 800 nm laser field) and is p-polarized at 45◦ incidence.
Figure 2 shows spatially resolved HHG spectra generated on thin foils by an intense laser field, in different physical conditions, calculated with this code. These spectra have been obtained by a temporal Fourier transformation of the magnetic field Bz(x, t) normal to the
incidence plane, for each position x along the target normal. They correspond to two different laser intensities, and four sets of exponential density gradients at the front and back sides of the foil (respective scale lengths LF and LR, see figure 1). Again, these parameters have been
chosen in order to clearly observe the different emission mechanisms independently.
Experimentally, these various conditions might be achieved in a certain time range during the interaction, depending on the laser parameters (e.g. laser pulse duration or contrast) and the target foils (e.g. constituting material, thickness) that are used. To isolate the effect of the density gradients, ions are assumed to be immobile in all cases. The foil is considered to be homogeneously ionized due to its small thickness and/or to the high laser intensity [7]. The foil thickness has been increased from e = 0.1λ for the lower laser intensity figures2(a) and (b) to
e = 0.4λ in figures2(c) and (d), to avoid the target being totally blown out during the interaction at the higher intensity.
Four main points emerge from this figure:
1. Generation area: Forward harmonics can be generated either at the rear side (figure 2(a)) or at the front side (figure2(c)).
2. Influence of the gradient scale lengths: The gradient scale lengths LF and LR have a
dramatic influence on forward HHG: while LR6= 0 is required to generate high harmonic
orders (& 3) from the rear side (figures2(a) and (b)), forward front-side emission strongly decreases with LF(figures2(c) and (d)).
(a
(b)
(a)
Position x (in λ0) −0.4 0.0 0.4 −0.4 0.0 0.4 0 10 20 30 Position x (in λ0) ω (i n ω 0 ) ωp/cosθ ωp 0 10 20 30 −0.1 0.0 0.1 −0.1 0.0 0.1 Frequency Frequency ω (i n ω 0 ) ωp (a) (b) (c) (d)Figure 2.Spatially resolved harmonic spectra generated on thin foils by a laser pulse, in different physical conditions. (a, b) e = 0.1λ0, a0= 0.5, ne= 110nc.
In (a) LF= 0.02λ0 and LR= 0.01λ0, while in (b) LF= 0.02λ0 and LR= 0.
(c, d) e = 0.4λ0, a0= 9, density 80nc. In (c) LF= 0.01λ0 and LR= 0, while
in (d) LF= 0.06λ0 and LR= 0. The vertical dotted lines show the limits of the
homogeneous plasma. A smooth spectral correction has been used in all cases (same for backward and forward spectra, and for (a, b) and (c, d)) to balance the harmonic amplitudes and make them all clearly visible simultaneously on a linear scale.
3. Role of the plasma frequency ωmaxp : In the parameter range considered here, harmonics emitted directly from the rear side are always observed to have a frequency ω 6 ωmaxp (figure2(a)); harmonics emitted at the front side do not necessarily propagate inward, even when their frequency is higher thanωmax
p (figure2(d)).
4. Comparison of forward and backward harmonic spectra: There is no comprehensive and simple relationship between the harmonic spectra detected in the forward and backward directions, even when these two emissions both originate from the front side (figures 2(c) and (d)).
To understand these four points, we now discuss the two involved generation mechanisms in detail, starting with the one occurring at the rear side.
3. Rear-side forward harmonic emission
In the case of backward emission, a model of harmonic generation based on light emission by electron plasma oscillations (EPO), called CWE, has been proposed to interpret harmonics with
1.5 1.0 0.5 0.0 0.0 Position x (in λ0) T ime t (in T 0 ) Position x (in λ0) 0.2 0.2 1.5 1.0 0.5 0.0 0.0
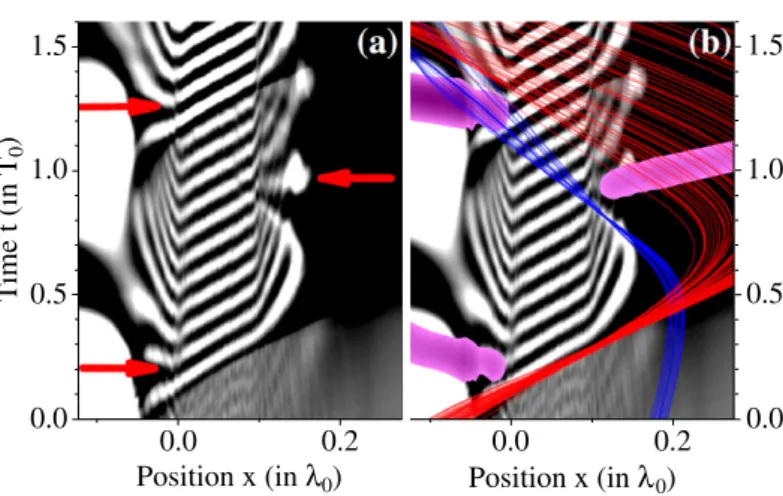
Figure 3. (a) Wavefronts of the electric field Ex during the first 1.6 cycle of a
square laser pulse, for a0= 0.5, n = 110nc, LF= LR= 0.02λ0 and e = 0.1λ0.
The red arrows indicate the points where these wavefronts are perpendicular to the target surface (kx = 0). In (b), the intensity of the frequency-filtered
(harmonics 4 to 10) magnetic field, in purple, and the trajectories of two selected sets of electrons (see text), in red and blue, are superimposed to this map. frequenciesω 6 ωmaxp [9]. These EPO are excited once every laser optical cycle, by attosecond bunches of electrons dragged in vacuum by the laser electric field component parallel to the target normal, and returning into the target via the front-side density gradient (so-called Brunel electrons [11]). In an inhomogeneous plasma, such as the expanding ionized foils considered here, these EPO can then emit light through linear mode conversion. This emission occurs in the form of one attosecond pulse of light, composed of frequencies ω 6 ωmax
p , emitted once every
optical cycle in the front-side density gradient.
In the case of forward harmonic emission, a somewhat similar but less analyzed process, based on EPO triggered by energetic electrons in the rear-side density gradient, has been proposed in [7]. We now describe how the CWE model can also precisely account for the rear-side forward emission.
Figures3(a) and (b) show a (x, t) map of the total electric field Ex along the foil normal,
over 1.6 laser optical period, in the case where harmonic emission is exclusively due to EPO on both sides of the foil (the case of figure 2(a)). To avoid perturbations in the plasma due to previous laser optical cycles, a square laser pulse is used in this particular simulation, and we consider the first cycle of this pulse. The wavefronts of the excited EPO are thus easily identified on this map. Note that the back-side gradient scale length LR is twice as large as in figure2(a)
simply to make the EPO more clearly visible.
In figure 3(b), the intensity of the magnetic field BH4−10
z (x, t) corresponding to the
superposition of harmonics 4 to 10 has been superimposed to the field map of figure3(a). This shows that harmonic generation is associated with the emission of attosecond pulses on both sides of the foil. In addition, figure 3(b) also shows the trajectories of two different carefully chosen sets of electrons. These electrons have been selected at a given time in specific areas of the x − px electron phase space of the plasma. These areas are respectively delimited by the
red and blue boxes of the phase-space movie 1 (stacks.iop.org/NJP/11/113028/mmedia). The red set of trajectories corresponds to electrons that travel across the foil, after they have been accelerated at the front side by the Brunel effect. These Brunel electrons excite EPO in their
wake all along the foil. However, in striking contrast the basic CWE process observed on the front side [9], no light emission directly follows this excitation at the rear side. Later on, a second bunch of electrons (shown in blue), the origin of which will be discussed later, penetrates the rear-side density gradient from vacuum, and excites a new set of EPO. It is only this second set of EPO that emits an attosecond light pulse, delayed from the one emitted at the front side by almost one laser optical cycle.
The CWE model can account for this intriguing observation. In this process, efficient light emission only occurs when a transient phase matching occurs between EPO and electro-magnetic modes in the plasma density gradient. The wave vector of an electroelectro-magnetic wave of frequency ω, emerging from the density gradient with an angle θ, is k(x) = (0, ω sin θ/c) around the generation point x such thatωp(x) = ω [9,12]. Phase matching thus requires kx = 0,
i.e. plasma-wake oscillation wavefronts that are perpendicular to the target surface.
As a first approximation, the phase φ(x, t) of the plasma-wake oscillations triggered, within one laser-optical cycle, by an electron bunch (assumed to be a Dirac delta function) traveling in the plasma and reaching point x at time t0(x) is given by [9,12]
φ(x, t) = 0, for t < t0(x),
φ(x, t) = ωp(x)[t − t0(x)], for t > t0(x),
(1) whereωp(x) ∝
√
ne(x) is the local plasma frequency in the density gradient. The wave vector k = −∇φ of the plasma oscillations is thus a function of time and space. Fulfilling the condition
kx = ∂φ/∂ x = (dωp/dx)(t − t0) − ωp(dt0/dx) = 0 for some t > t0requires thatωp(x) and t0(x)
vary in the same way, i.e. both decrease or increase with x. In other words, phase matching only occurs when plasma oscillations of higher frequencies are excited at later times, i.e. when the exciting electron bunch travels toward areas of increasing densities as it crosses the plasma–vacuum interface.
This simple analytical prediction is clearly confirmed by figure 3. The wavefronts of the front-side EPO triggered by ingoing Brunel electrons bend gradually, allowing for light emission when they become perpendicular to the target surface [9]. In contrast, EPO excited at the rear side by outgoing Brunel electrons do not emit light, because t0(x) and ωp(x) then vary in
opposite ways, and the condition kx = 0 is thus never fulfilled in this case. CWE at the rear
side only occurs when the plasma oscillations are triggered by an ingoing electron bunch, as also observed in figure3.
Now we have to discuss how such ingoing electron bunches (blue curves in figure 3) are formed at the rear side. Once they exit the foil, most Brunel electrons are brought back to the target by the electric space charge field. These electrons however come back at various times (figure 3 and movie 1,stacks.iop.org/NJP/11/113028/mmedia), and thus do not gather into the short bunch required to efficiently excite high-frequency EPO. Nonetheless, when they escape the foil at the rear side, Brunel electrons create an electric field Ex,
that accelerates inward the thermal electrons located at the bottom of the rear-side density gradient. The blue set of trajectories shown in figure 3 corresponds to a selected group of such electrons. As they penetrate the plasma, the fastest of these electrons overtake the slowest ones (movie 1,stacks.iop.org/NJP/11/113028/mmedia), creating a short charge bunch (figure3), which efficiently excites EPO and thus triggers CWE.
This scenario has been tested and confirmed even more clearly, by simulating a thin target, with no laser irradiation, in which we have injected a single monoenergetic electron bunch from the front side. This bunch is initially launched in vacuum, with px = 0.5mc (toward the target
Figure 4.Comparison of the CWE harmonic spectra emitted in the forward and backward directions. The backward spectrum has been normalized so that the fundamental spectrum of the laser peaks at 1, and the forward spectrum has been divided by the same factor. The physical conditions are exactly the same as in figure2(a).
foil), and then travels all across the foil up to the rear side. The temporal evolution of the x − px
electron phase space in this case is shown in movie 2 (stacks.iop.org/NJP/11/113028/mmedia). As is clear from this movie, the initial bunch (highlighted by the red circle at t = 0 in movie 2,
stacks.iop.org/NJP/11/113028/mmedia) disperses longitudinally as it crosses the foil. As it emerges into vacuum at the rear side of the foil, it exchanges energy with cold electrons in the rear-side density gradient. These accelerated electrons then form a bunch of cold returning electrons, highlighted by the blue box in movie 2 (stacks.iop.org/NJP/11/113028/mmedia).
The generation efficiency of rear-side CWE depends on the foil thickness. Indeed, the thicker the target, the stronger the longitudinal dispersion of ingoing Brunel bunches on their way to the back side of the plasma. Consequently, the amplitude of the electric field created by the outgoing electron, as well as the harmonic signal, eventually decreases with foil thickness, as observed for instance in [7]. Backward and forward CWE emission are also respectively influenced by the lengths and the shapes of the front and back density gradients.
A detailed quantitative study of these effects would require taking into account the exact density profile of the inhomogeneous plasma created by the laser as it impinges and ionizes the initially solid foil. Such a study is clearly beyond the scope of this paper. However, whatever the exact interaction conditions, the electron bunches triggered at the back side of the target (blue set of trajectories in figure 3) are systematically less dense than the Brunel bunches at the front side. Rear-side emission is thus, in general, less efficient than front side emission, as illustrated in figure4.
Finally, we emphasize that CWE is only possible in the presence of a gentle (i.e. not step-like) density gradient. This explains the suppression of this emission when LR= 0
(figure 2(b)). The low harmonic orders (n . 3) still observed in figure 2(b) can be attributed to Coherent Transition Radiation (CTR) [13] induced by outgoing Brunel electrons, which becomes dominant for a step-like plasma–vacuum interface.
This last point raises the interesting issue of the difference between CWE and CTR. There is an overall conceptual similarity between these two mechanisms: in both cases, light is emitted by the currents induced in a medium by charges crossing an interface. However, there are clear differences in the property of the emission, which enable us to distinguish these two mechanisms
Figure 5.Comparison of the relativistic harmonic spectra emitted in the forward and backward directions. The backward spectrum has been normalized so that the fundamental spectrum of the laser peaks at 1, and the forward spectrum has been divided by the same factor. The physical conditons are exactly the same as in figure2(c). As expected, only the harmonics above ωmaxp /cos θ ≈ 12.6 can be observed in the forward direction after propagation through the ionized foil. The spectrum power law n−8/3, where n is the harmonic order, predicted by the
‘gamma spike’ model of Baeva et al [16] is also represented for comparison. in simulations, in particular:
• CWE involves currents induced in the inhomogeneous part of the plasma, and thus only works for gradient of finite lengths. In contrast, CTR also works for a step-like interface, in which case it involves currents in the bulk of the plasma.
• While the spectral cutoff of the CWE emission depends only on the maximum plasma frequency at the rear side of the target, this cutoff is determined by the particle velocity in the case of CTR [13]. This velocity plays little role in CWE, while CTR becomes really efficient for relativistic particles.
• The CTR emission is expected to occur around the time when the particles cross the interface. In contrast, in rear-side CWE, this emission is delayed by more than 1 fs (see figure3(b)).
• CTR occurs for charges that cross the plasma vacuum in either direction, while we have just shown that CWE requires charges that move toward areas of increasing densities.
4. Relativistic forward harmonic emission
As the intensity is increased well beyond the relativistic limit (i.e. a0 1), we observe
that front-side emission can become the dominant source of forward harmonic emission (figure 2(c)). As expected, propagation through the ionized foil then induces a low-frequency cutoff in the forward HHG spectrum as it can be seen in figure 5. Simulations with different plasma densities and incidence angles θ, however, show that it is not located at ω = ωp, as
assumed in some early papers [4, 5], but rather at ωmaxp /cos θ [3], which, not surprisingly, corresponds to the critical frequency for electromagnetic waves penetrating the plasma slab from vacuum with an incidence angleθ [14].
3.8 4.0 4.2 4.4 4.6 12 13 14
t
1t
0x
1Position x (in laser wavelength)
Time
t
(i
n
las
e
r
periods
)
x
0 Plasma foilFigure 6. Illustration of the retarded time integrands of equations (2) and (3). The color map sketches a current distribution Jy(x, t) induced in a plasma foil
by an intense laser field in normal incidence. The upper and lower black oblique lines show the paths along which Jy(x, t) has to be integrated to calculate the
field Ey(x, t) radiated by the plasma, respectively in front of the foil at time
t0, and behind the foil at time t1. As time evolves, these integration paths for
the calculation of Ey(x, t) translate along the time axis, as indicated by the red
arrows.
We now analyze the mechanism responsible for this forward emission at the front surface. At such intensities, it is well known that backward harmonics are generated in the reflected beam, through a periodic distortion of the reflected waveform, induced by the Doppler effect associated with the laser-driven relativistic oscillation of the plasma surface [15]. This process is generally described qualitatively by the ‘relativistic oscillating mirror’ (ROM) picture.
A better insight into this process is possible by using the so-called boosted reference frame (see e.g. [15]), which moves along the target surface (the y-axis) at velocity c sinθ. In this frame, the interaction is 1D, and the transverse- or radiation-electric field Ey(x0, t) at point
x0 in vacuum in front of the foil, emitted by the laser-induced transverse current distribution
Jy(x, t) in the plasma, is simply given by
Ey(x0, t) = µ0
Z +∞
x0
dx Jy[x, t − (x − x0)/c] , (2)
while the transverse field emitted in vacuum at point x1behind the foilis given by
Ey(x1, t) = µ0
Z −∞
x1
dx Jy[x, t − (x1− x)/c] , (3)
These integrands in the (x, t) space are sketched in figure 6. This figure clearly shows that any part of the Jy(x, t) distribution moving at a velocity close to c toward the observation
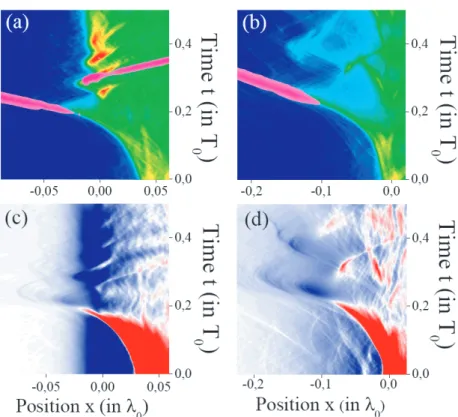
Figure 7.Plasma electron density in linear scale (blue to red scale) and intensity of attosecond pulses (purple scale) as a function of time and space, for e = 0.45λ0, ne= 80nc, a0= 9. Ions are fixed, and LF= 0.01λ0 in (a), while LF=
0.06λ0 in (b). Graphs (c) and (d) show the corresponding transverse current
distributions ( Jy(x, t) in the boosted frame) in these two cases.
high frequencies in the light spectrum: this effect thus corresponds to the usual Doppler upshift induced by a relativistic motion of the radiation source toward the observation point.
Figure 6 reveals an obvious, yet essential, feature of the Doppler effect, namely that it leads to an electromagnetic field that strongly depends on the observation direction: when the current distribution at the plasma surface moves toward vacuum, a frequency upshift occurs in the direction of the reflected beam, but not in the opposite direction. A similar process might however lead to forward attosecond pulse emission when the current distribution moves toward
the target, i.e. at a different instant of the surface oscillation.
This effect is indeed observed on figure 7(a), which shows the intensity of the frequency-filtered magnetic field BzH20−120, together with the plasma electron density, in the case of a relativistic laser intensity (case of figure 2(c)). The superposition of harmonics results in two attosecond pulses, one going in the backward direction and the other in the forward direction. These two pulses are generated at two different instants of the dynamics of the plasma, respectively at times where the plasma ‘surface’ moves outward and inward. This qualitatively confirms that these new frequencies are due to a Doppler effect.
According to equation (2), HHG depends on the exact current distribution within the skin depth, and at these intensities, this distribution can be very complex. Figure 7(b) illustrates this point: compared with figure 7(a), a longer—but still very sharp—density gradient at the
Figure 8.Plasma electron density in linear scale (blue to red scale) and amplitude of attosecond pulses (purple scale) as a function of time and space, for e = 0.45λ0, ne= 80nc and a0= 9. Ions are mobile, and the density gradient is
initially step-like. A square laser pulse is used in this case, to avoid any temporal variation other than that of the density profile. The two side panels show the temporal amplitude profiles in vacuum of the attosecond pulse trains (filtering of harmonics 20 to 120) generated on both sides of the target.
front surface strongly modifies the plasma dynamic [17] within the skin depth, and quenches harmonic emission in the forward direction only. This explains the effect of LF observed in
figure1(d). The physical effect leading to HHG—i.e. the motion of a fraction of Jy(x, t) at
a velocity close to c toward the observation point—is fundamentally the same in both the backward and forward directions. However, it is the influence of the density gradient scale length LF that is different for the outgoing and ingoing parts of Jy(x, t), leading to different
effects on the backward and forward HHG. The current distributions corresponding to the cases of figures7(a) and (b) are respectively shown in figures7(c) and (d).
The trains of attosecond pulses emitted from the front target side in the forward and backward directions are thus associated with different parts of the current distributions Jy(x, t)
and different instants of the plasma dynamics. This has two important consequences when it comes to using the corresponding spectra to gather information on the plasma dynamic.
1. There is no reason why individual attosecond pulses in these trains should be identical: even above the ωpmax/cos θ cutoff, the envelopes of the backward and forward harmonic spectra may therefore be different. This is clearly observed in figure5, where the forward and backward harmonic spectra differ even above the cutoff (dip in backward spectrum around order 17, lower efficiency in forward than backward emission for orders higher than 20).
2. The properties of the two trains may also be different. Such a situation is illustrated in the simulation of figure8, where the motion of ions is now allowed. While attosecond pulses are initially emitted in both directions with similar amplitudes when the gradient is steep, as the plasma expands, only backward emission remains, as expected from figures2(c) and (d) and figure 7. The trains of attosecond pulses generated in the two directions thus have different durations (side panels in figure8), and harmonics observed on the two sides might therefore have different spectral widths.
Finally, we note that in the physical conditions of our simulations (oblique incidence, moderately relativistic laser intensity), the HHG spectra provided by PIC simulations do not correspond to the predictions of the ‘gamma spikes’ model of Baeva et al [16], neither in the backward nor in the forward directions. This mismatch between the numerical spectra and the
n−8/3 power law proposed in [16], is clearly visible in figure5and indicates that this model is not relevant to the present discussion.
5. Conclusion
We have demonstrated numerically that two processes can contribute to forward harmonic generation: rear-side CWE, and front-side forward Doppler effect. They have both been investigated in conditions relevant to experiments. The CWE mechanism has been studied for a normalized laser amplitude a0= 0.5, comparable with the experimental conditions of [7]
(a0≈ 0.4−0.8), and provides a consistent interpretation of this experiment. The relativistic
mechanism has been analyzed for an intensity of the same order as the one used in [8] (a0= 9
compared with a0≈ 8 in the experiment), and support the assumption made in this paper that
harmonics originate from the a Doppler effect at the front side in this regime.
However, most of this study has been performed for non-realistic fixed density gradients. In a real experiment, the gradient scale lengths on both sides of the target evolve during the interaction, complicating the interpretation of the results, as illustrated by figure 8. Moreover, for intermediate intensities, the two mechanisms can simultaneously contribute to forward emission, potentially making the analysis of spectra detected at the rear side of foils even more difficult.
In conclusion, although the combination of forward and backward HHG definitely constitutes a promising probe of the plasma dynamics, down to the sub-laser cycle time scale, exploiting this probe is in general highly nontrivial. For instance, differences between backward and forward harmonic spectra in general cannot be attributed to the sole effect of propagation through the foil, even when only front-side emission occurs, as opposed to what was assumed in [8] to interpret the observed spectral broadening of forward harmonics.
As far as the production of attosecond pulses is concerned, forward HHG on thin foil has several important practical advantages over backward HHG on bulk targets. First of all, there is no need to frequency-filter the emitted radiation after the interaction to obtain these pulses, since this is already achieved by the target itself [18]. Large energy losses can thus be avoided. Secondly, the requirements on the target flatness to obtain light beams of good spatial quality at short-wavelengths (down to the x-ray range) are likely to be much less stringent in this configuration, since the position of the generation point has a much smaller influence on the harmonic phase in transmission than in reflection.
Acknowledgments
We gratefully acknowledge stimulating and fruitful discussions with J-P Geindre.
References
[1] Tsakiris G, Eidmann K, Meyer-ter-Vehn J and Krausz F 2006 New J. Phys.8 19
[3] Lichters R and Meyer-ter-Vehn J 1996 Proc. ICOMP 1996 (IOP Conf. Ser. No 154) ed P Lambropoulos (Bristol: IOP Publishing) pp 221–30
[4] Gibbon P et al 1997 Phys. Rev. E55 R6352–5
[5] Hässner R et al 1997 Opt. Lett.22 1491–3
[6] Jarque E C and Plaja L 1998 Phys. Rev. E58 7864
[7] Teubner U et al 2004 Phys. Rev. Lett.92 185001
Eidmann K et al 2005 Phys. Rev. E72 036413
[8] Krushelnick K et al 2008 Phys. Rev. Lett.100 125005
[9] Quéré F et al 2006 Phys. Rev. Lett.96 125004
[10] Bonnaud G and Reisse C 1986 Nucl. Fusion 26 633 [11] Brunel F 1987 Phys. Rev. Lett.59 52
[12] Sheng Z-M, Mima K, Zhang J and Sanuki H 2005 Phys. Rev. Lett.94 095003
Sheng Z-M, Mima K and Zhang J 2005 Phys. Plasmas12 123103
[13] Jackson J 1998 Classical Electrodynamics (New York: Wiley)
[14] Kruer W L 1988 The Physics of Laser Plasma Interactions (Reading, MA: Addison-Wesley) [15] Lichters R, Meyer-ter-Vehn J and Pukhov A 1996 Phys. Plasmas3 3425
[16] Baeva T, Gordienko S and Pukhov A 2006 Phys. Rev. E74 046404
[17] Geindre J P, Audebert P and Marjoribanks R S 2006 Phys. Rev. Lett.97 085001