HAL Id: hal-01950144
https://hal.archives-ouvertes.fr/hal-01950144
Submitted on 10 Dec 2018
HAL is a multi-disciplinary open access archive for the deposit and dissemination of sci-entific research documents, whether they are pub-lished or not. The documents may come from teaching and research institutions in France or abroad, or from public or private research centers.
L’archive ouverte pluridisciplinaire HAL, est destinée au dépôt et à la diffusion de documents scientifiques de niveau recherche, publiés ou non, émanant des établissements d’enseignement et de recherche français ou étrangers, des laboratoires publics ou privés.
Male Violence and Sexual Intimidation in a Wild
Primate Society
Alice Baniel, Guy Cowlishaw, Elise Huchard
To cite this version:
Alice Baniel, Guy Cowlishaw, Elise Huchard. Male Violence and Sexual Intimidation in a Wild Primate Society. Current Biology - CB, Elsevier, 2017, 27 (14), pp.2163-2168.e3. �10.1016/j.cub.2017.06.013�. �hal-01950144�
1
Published in final edited form as:
1
Current Biology 27.14 (2017): 2163-2168. doi: 10.1016/j.cub.2017.06.013
2
3
Male violence and sexual intimidation in a wild primate society
4
Alice Baniel1,2,3,§, Guy Cowlishaw3, Elise Huchard2
5
6
AUTHORS AFFILIATIONS
7
1 Institute for Advanced Study in Toulouse, 21 allée de Brienne, 31015 Cedex 6, Toulouse,
8
France.
9
2 Institut des Sciences de l’Evolution de Montpellier, Université de Montpellier, Place Eugène
10
Bataillon, CC 065, 34095 Montpellier Cedex 5, France.
11
3 Institute of Zoology, Zoological Society of London, Regent’s Park, London NW1 4RY, UK.
12
13
§Corresponding author: Alice Baniel, Institute for Advanced Study in Toulouse, 21 allée de
14
Brienne, 31015 Cedex 6, Toulouse, France, telephone: +33567732966, email address:
15 alice.baniel@gmail.com 16 17 18 19 20 21 22 23
2
SUMMARY
24
Sexual violence occurring in the context of long-term heterosexual relationships, such as
25
sexual intimidation, is widespread across human populations [1–3]. However, its evolutionary
26
origins remain speculative because few studies have investigated the existence of comparable
27
forms of sexual coercion in animals [4,5], where repeated male aggression towards a female
28
provides the aggressor with delayed mating benefits [6]. Here, we test whether male
29
aggression towards females functions as sexual coercion in wild chacma baboons (Papio
30
ursinus). We found support for all three main predictions of the sexual coercion hypothesis
31
[7]: male aggression (1) is greatest against cycling females, (2) is costly and represents the
32
main source of injuries for cycling females, and (3) increases male mating success with their
33
victims in the future. Detailed analysis of chronological sequences between aggression and
34
matings ruled out other coercive mechanisms, such as short-term harassment and punishment,
35
by showing that aggression and matings are temporally decoupled. This decoupling may
36
explain why some forms of sexual violence have been largely overlooked in well-studied
37
animal populations despite their likely impact on the fitness of both sexes. Finally, we found
38
no support for alternative hypotheses such as a female preference for aggressive males [8,9].
39
This new, detailed study of the forms and intensity of sexual intimidation in a wild primate
40
suggests that it may be widespread across mammalian societies, with important implications
41
for understanding the evolution of mate choice and sexual conflict in mammals, as well as the
42
origins of human sexual violence.
43
44
KEYWORDS: sexual conflict, sexual coercion, intersexual aggression, coercive
mate-45
guarding, intimidation, promiscuous mating, injury.
46
3
RESULTS
48
Animal studies of sexual conflict have focused on its more conspicuous forms, including
49
infanticide [10,11], forced copulations [12,13], and sexual harassment [14–16]. Pioneering
50
studies exploring more discreet forms of sexual coercion, such as sexual intimidation in
51
chimpanzees (Pan troglodytes), have reported that males who direct repeated aggression
52
towards cycling females are more likely to mate with them around ovulation [17–20]. Besides
53
this work and some anecdotal reports [7,21,22], the prevalence and evolutionary importance
54
of sexual intimidation in wild primates remain largely unknown. Here, we investigate the
55
occurrence and forms of sexual coercion in wild chacma baboons (Papio ursinus). Chacma
56
baboons live in stable multimale-multifemale groups, where females are philopatric while
57
males disperse and compete for reproductive opportunities [23]. Females develop perineal
58
swellings during their oestrus cycle and mate with multiple males [24], but are often
mate-59
guarded by a dominant male when approaching ovulation [25], which increases their
60
likelihood of paternity [26,27]. First, we tested the three main predictions of the sexual
61
coercion hypothesis [7]: (1) cycling females face higher rates of aggression from males than
62
non-cycling females (‘cycling’ refers to all cycling females, with and without swellings), (2)
63
aggression directed by males to cycling females translates into a higher rate of injury, and (3)
64
males achieve higher mating success with those females toward whom they are more
65
aggressive. Second, we characterized the forms of coercion by investigating chronological
66
associations between aggression and matings, in order to differentiate between short-term
67
sexual harassment (where mating immediately follows aggression), punishment (where
68
mating with a rival is immediately followed by aggression), and sexual intimidation (where
69
matings and aggression are temporally decoupled). Finally, we also tested an alternative
70
hypothesis to sexual coercion, postulating that the association between male aggression and
71
mating is driven by a female preference for aggressive males, which may provide direct or
72
indirect fitness benefits to females [8,9].
4 74
1. Does male aggression target cycling females?
75
We investigated whether the reproductive state of females, defined as swollen (sexually
76
receptive), non-swollen (non-sexually receptive, the non-fertile phase of the cycle), pregnant,
77
or lactating, influenced their chances of receiving aggression from males using a generalized
78
linear mixed model (‘GLMM’, see Experimental Procedures and Table S1). We found that
79
males preferentially targeted cycling females [swollen: mean±standard deviation: 0.13±0.19
80
time per hour, i.e., once every 8h; non-swollen: 0.12±0.19, 1/9h] and directed much less
81
aggression towards non-cycling females [pregnant: 0.03±0.08, 1/32h; lactating: 0.03±0.08,
82
1/32h] (Table S2, Figure 1a). Cycling females could also attract male aggression if they
83
generate frequent conflicts because males regularly intervene in conflicts [5,28]. However,
84
cycling females do not initiate more aggression towards other group members than
non-85
cycling females (Appendix 1 and Table S3).
86
87
2. Are cycling females likely to be injured by male aggression?
88
Of the few female injuries with an observed cause, 78% were inflicted by adult males
89
(N=17/22). We tested whether the risk of injury is higher in cycling than non-cycling females
90
using a GLMM (see Experimental procedures and Table S1). Daily rates of female injury
91
varied across the reproductive cycle, and mirrored the rate of male aggression: swollen
92
females received most injuries (0.014±0.022 injuries per day, i.e., 1 injury every 73 days),
93
followed by non-swollen females (0.009±0.016, 1/115), lactating females (0.005±0.010,
94
1/191), and pregnant females (0.005±0.009, 1/208) (Table S4, Figure 1b). We also found that,
95
within a given cycle, females that faced higher rates of aggression from males suffered more
96
injuries (Table 1, Fig. 2a,b).
97
5
3. Does aggression by males increase their likelihood of mating with the recipient?
99
3a. Do males use short-term sexual harassment?
100
To test whether a male was more likely to copulate with a female within 5, 10, 15 or 20
101
minutes of assaulting her, we used a matched-control analysis [29]. We tested the difference
102
in the proportion of observations containing copulations with the aggressor in the
post-103
aggression (‘PA’) and matched-control (‘MC’) (no aggressive event) observations, using
104
McNemar's Chi-squared tests (see Appendix 2). We found no support for short-term sexual
105
harassment: the probability of copulation did not increase in the 5-20 minutes following male
106
aggression, for either unguarded (Table S5a) or mate-guarded females (Table S5b).
107
108
3b. Do males use punishment?
109
We used a similar approach to investigate whether the probability of females receiving male
110
aggression increased within 5, 10 or 15 minutes after copulating with a rival male. We tested
111
the difference in the proportion of aggression received from males who had not mated with
112
the focal female in the post-copulation (‘PC’) and MC (no copulation) observations (see
113
Appendix 3). We found no evidence for punishment either by non-mated males for
114
unguarded females (Table S5a) or by the consort male for guarded females (Table S5b).
115
116
3c. Do males use sexual intimidation?
117
We tested whether a male’s probability of mate-guarding a female at her peak fertility (i.e.,
118
during her peri-ovulatory period, called ‘POP’) increased as a function of the mean hourly
119
rate of aggression received by the female from this male prior to her POP, during the same
120
oestrus cycle (calculated using focal observation data). We found that a female who received
121
more aggression from a male throughout her cycle was more likely to be mate-guarded by
122
him during her ovulatory window at the end of that cycle (Table 2, Fig. 2c,d). Overall,
6
females received aggression through their cycle from their future male consort at a rate of
124
0.04±0.09 times/h compared to 0.01±0.05 times/h from other males. Similar results were
125
found when estimating the rate of male-female aggression using ad libitum data (Table S6).
126
127
4. Do females prefer aggressive males?
128
This last set of results could possibly result from a female preference for aggressive males,
129
rather than from sexual coercion [8,9]. Under this scenario, we would expect some males to
130
express aggressive phenotypes, and females to express a preference for these aggressive
131
phenotypes. To test this alternative hypothesis, we included an additional fixed effect in the
132
GLMM described above, a proxy of male general propensity to aggression, estimated as the
133
ad libitum daily rate of male aggression initiated toward any individual of the group per year.
134
In contrast to the dyadic rate of aggression received by a female from a male during an
135
oestrus cycle, a male’s general rate of aggression was not found to influence his probability
136
of mate-guarding that female (Table 2, Table S6) .
137
138
DISCUSSION
139
Our study extends previous work on sexual coercion in mammals in three ways. First, our
140
results present new evidence supporting the use of sexual intimidation by wild chacma
141
baboons. Such behaviour, previously reported only in chimpanzees [17–20], may therefore
142
occur in a wider range of primates and strengthens the case for an evolutionary origin of
143
human sexual intimidation [2,3]. Earlier work in baboons has underlined the importance of
144
conditioning aggression by male hamadryas baboons, typically expressed when females leave
145
their spatial proximity [30–32], and has also reported higher rates of male aggression against
146
cycling (versus non-cycling) females in chacma baboons [33–36]. Our results further link
147
male-female aggression to mating rates, in support of a core prediction of the sexual coercion
7
hypothesis. By attacking females repeatedly in the weeks preceding ovulation, males appear
149
to increase their chances of monopolizing sexual access to females around ovulation, which
150
in turn increases their probability of successful reproduction [26,27]. Although we cannot
151
demonstrate the causality of this link using correlative data, our analyses rule out several
152
alternative hypotheses, including the proposal that cycling females receive more male
153
aggression than non-cycling females because they are more aggressive, and the proposal that
154
females prefer to mate with aggressive males.
155
Second, we conducted a detailed characterization of the mechanisms of sexual
156
coercion through an analysis of behavioural sequences that reveals the temporal decoupling
157
between aggression and matings. Our results suggest that direct coercion is more important
158
than indirect coercion (i.e., males attempt to increase their own mating rates rather than to
159
decrease those of others), by showing that males rarely punish females who mate with rivals,
160
although it may not be possible to fully disentangle these effects because one aggressive act
161
may simultaneously encourage a female to mate and discourage her to leave.
162
Third, our study points to important fitness costs of sexual intimidation for females.
163
Previous evidence has been limited to the finding that fertile female chimpanzees experience
164
higher stress levels than non-fertile females [17]. Here we show that sexual violence is an
165
important source of injuries for fertile females, which can compromise their survival (Fig 2b).
166
Our study may therefore offer an evolutionary explanation for the co-variation between
167
female injury rates and fertility cycles that has been reported from a range of mammals [37–
168
42], including baboons [43,44].
169
Several factors may favour the use of sexual intimidation in baboons and
170
chimpanzees, including the coexistence of males and females in large groups for long periods
171
of time, their sexual dimorphism in body size and armaments, and long-term memory of
172
previous interactions [45,46]. Sexual intimidation may occur in other mammals sharing these
8
traits, but could have easily gone undocumented due to the temporal decoupling between
174
aggression and matings [6]. Recognizing the importance of discreet forms of sexual coercion,
175
by examining their taxonomic distribution and fitness consequences, should become an
176
important focus for future research. The widespread use of sexual intimidation by males may
177
help to explain core aspects of reproductive strategies with consequences for the evolution of
178
mate choice, social structure and sexual dimorphism [47,48].
179
180
EXPERIMENTAL PROCEDURES
181
(a) Study site and population
182
We studied wild chacma baboons at Tsaobis Nature Park, a semi-arid environment in
183
Namibia [49]. We collected data on two habituated groups. Group composition and periods of
184
data collection are given in Table S7. Only adults were included in the study (see Table S7 for
185
definition), and all were recognizable. Dominance ranks were based on both focal and ad
186
libitum observations of approach-avoid and agonistic interactions (see Appendix 4).
187
188
(b) Female reproductive state & mate-guarding patterns
189
Female reproductive state was recorded daily as pregnant (determined a posteriori) if a
190
female gave birth within six months after the day of observation, lactating if she had a
191
dependant infant and had not yet resumed cycling, swollen if she was sexually receptive with
192
a perineal swelling, and non-swollen otherwise. For each cycle, we defined the POP as the
5-193
day period preceding the day of swelling detumescence, during which ovulation generally
194
occurs [50,51]. Mate-guarding episodes were monitored ad libitum.
195
196
(c) Behavioural data
9
We conducted one-hour focal animal samples on all adults. We conducted 3439 focal
198
observations on 53 females distributed across reproductive states (Table S8) during which we
199
recorded 222 chases or attacks led by males. Supplants, displacements, and threats were
200
excluded because they are likely to be less stressful for females. We also recorded 520 focal
201
observations of 25 adult males, with 79 chases or attacks towards adult females. In addition,
202
we recorded ad libitum agonistic interactions, with 1579 chases or attacks involving an
203
identified adult male/female.
204
205
(d) Observations of injuries
206
From 2013 onwards, injuries were recorded daily, including the date, type of wound (open
207
cuts, punctures of the skin, abnormal skin swelling, limps), freshness (presence of wet/dry
208
blood), and likely cause when known. We recorded 101 injuries on 31 adult females. For
209
analyses, we omitted injuries inflicted by adult females and juveniles where known (N=5/22).
210
211
(e) Statistical analysis
212
We ran a combination of GLMMs (summarized in Table S1), described below, and
matched-213
control analyses (described in Appendix 2 and 3). For technical details on GLMM
214
procedures, see Appendix 5.
215
216
Male aggression and female reproductive state
217
A binomial GLMM with a logit link function was run, using the probability that a female
218
receives male aggression during a one-hour focal observation (yes/no) as the response
219
variable. Reproductive state was fitted as a fixed factor together with the following control
220
variables: female dominance rank, female parity (nulliparous or parous), group sex ratio (the
221
number of adult females divided by the number of adult males, in case females receive more
10
male aggression when the sex ratio is more male-biased), year, and group identity. Random
223
factors comprised female identity and the date of focal sampling.
224
225
Male aggression and rate of injury
226
The number of injuries received by a female in a given reproductive state was modelled as a
227
GLMM with a Poisson error structure. The number of days spent in each reproductive state
228
was log-transformed and included as an offset variable. Fixed effects comprised: female
229
reproductive state, dominance rank, parity, group sex ratio, year, and group identity. Female
230
identity was included as a random effect.
231
To test whether females who experience more male aggression during their oestrus
232
cycle suffer more injuries, we ran a second GLMM with a Poisson error structure using the
233
number of injuries received in a given cycle as the response variable. The log-transformed
234
number of days spent in each cycle was fitted as an offset variable. The mean rate (number
235
per hour) of aggressive acts received from any adult male by the female throughout her cycle
236
(calculated using female focal observations) was fitted as a fixed effect. Other fixed and
237
random effects were similar to the previous model, except that the operational sex ratio (the
238
number of cycling females divided by the number of adult males) was fitted instead of the
239
group sex ratio. We included a cycle only if we had >5 focal observations for a female in that
240
cycle.
241
242
Sexual intimidation and male mating success
243
We ran a binomial GLMM using the probability that each resident male mate-guards the
244
female during her POP (yes/no) as the response variable. Fixed factors comprised the mean
245
rate of aggression received by the female from the male during the entire cycle, but prior to
246
her POP, calculated as the total number of aggressive acts received during focal observations
11
divided by the number of observation hours, prior to her POP; female dominance rank and
248
parity; male dominance rank (to control for increased access of dominant males to receptive
249
females); operational sex ratio; year; and group identity. To test the alternative hypothesis of
250
female preference for aggressive male phenotypes, we included an additional fixed effect: the
251
rate of male aggression toward any individual of the group (total number of ad libitum
252
aggressive acts initiated by a male per year divided by the time spent in the group that year
253
and by the number of individuals in the group to control for differences in group size).
254
Random effects comprised the female and male identities, and cycle identity. Only cycles for
255
which we had >5 focal observations of a given female were included.
256
This analysis was replicated using ad libitum records of male-female aggression to
257
ensure our estimated rates of aggression reliably captured variation across dyads. We ran the
258
same model as above but calculating the mean daily rate of aggression received by the female
259
from the male during her entire cycle, but prior to her POP, as the total number of ad libitum
260
aggressive acts received divided by the number of days observed in the cycle. We only
261
included cycles for which >10 days of group observations were available.
262
263
AUTHOR CONTRIBUTIONS
264
A.B. and E.H. collected the data and designed the study, A.B ran the analyses, and all authors
265
contributed to draft the manuscript.
266
267
ACKNOWLEDGMENTS
268
We are grateful to the Tsaobis Baboon Project volunteers in 2005-6 and 2013-14 for help in
269
the field, and three anonymous reviewers for comments on the manuscript. Permission to
270
work at Tsaobis Nature Park was granted by the Ministry of Lands and Resettlement and the
271
Tsaobis beneficiaries. Thanks also to the Gobabeb Research and Training Centre for
12
affiliation, and the Ministry of Environment and Tourism for research permits, as well as to
273
the Snyman and Wittreich families for permission to work on their land. A.B. benefitted from
274
a financial support from the ANR Labex IAST, the ‘Ministère de l’Education Nationale, de
275
l’Enseignement Supérieur et de la Recherche’, and the Primate Society of Great Britain. The
276
authors declare that they have no conflict of interest.
277
278
REFERENCES
279
1. WHO (2013). Global and regional estimates of violence against women: prevalence and
280
health effects of intimate partner violence and non-partner sexual violence (World Health
281
Organization).
282
2. Smuts, B. (1992). Male aggression against women. Hum. Nat. 3, 1–44.
283
3. Wilson, M., and Daly, M. (2009). Coercive violence by human males against their
284
female partners. In Sexual coercion in primates and humans: an evolutionary perspective
285
on male aggression against females, M. N. Muller and R. W. Wrangham, eds.
286
(Cambridge: Harvard University Press), pp. 271–291.
287
4. Wrangham, R.W., and Muller, M.N. (2009). Sexual coercion in humans and other
288
primates: the road ahead. In Sexual coercion in primates and humans: an evolutionary
289
perspective on male aggression against females, M. N. Muller and R. W. Wrangham,
290
eds. (Cambridge, Mass.: Harvard University Press), pp. 451–468.
291
5. Muller, M.N., Kahlenberg, S.M., and Wrangham, R.W. (2009). Male aggression and
292
sexual coercion of females in primates. In Sexual coercion in primates and humans: an
293
evolutionary perspective on male aggression against females, M. N. Muller and R. W.
294
Wrangham, eds. (Cambridge, Massachusetts: Harvard University Press), pp. 3–22.
295
6. Clutton-Brock, T.H., and Parker, G.A. (1995). Sexual coercion in animal societies.
296
Anim. Behav. 49, 1345–1365.
13
7. Smuts, B.B., and Smuts, R.W. (1993). Male aggression and sexual coercion of females in
298
nonhuman primates and other mammals: evidence and theoretical implications. Adv.
299
Study Behav. 22, 1–63.
300
8. Cordero, C., and Eberhard, W.G. (2003). Female choice of sexually antagonistic male
301
adaptations: a critical review of some current research. J. Evol. Biol. 16, 1–6.
302
9. Pizzari, T., and Snook, R.R. (2003). Perspective: sexual conflict and sexual selection:
303
chasing away paradigm shifts. Evolution 57, 1223–1236.
304
10. van Schaik, C.P., Pradhan, G.R., and van Noordwijk, M.A. (2004). Mating conflict in
305
primates: infanticide, sexual harassment and female sexuality. In Sexual selection in
306
primates: new and comparative perspectives, P. M. Kappeler and C. P. van Schaik, eds.
307
(Cambridge: Cambridge University Press), pp. 131–150.
308
11. Lukas, D., and Huchard, E. (2014). The evolution of infanticide by males in mammalian
309
societies. Science 346, 841–844.
310
12. Emlen, S.T., and Wrege, P.H. (1986). Forced copulations and intra-specific parasitism:
311
two costs of living in the white fronted bee-eater. Ethology 71, 2–29.
312
13. Knott, C.D., and Kahlenberg, S. (2007). Orangutans in perspective: forced copulations
313
and female mating resistance. In Primates in perspective, S. Bearder, C. J. Campbell, A.
314
Fuentes, K. C. MacKinnon, and M. Panger, eds. (Oxford, G. B.: Oxford University
315
Press), pp. 290–305.
316
14. Clutton-Brock, T.H., Price, O., and MacColl, A. (1992). Mate retention, harassment and
317
the evolution of ungulate leks. Behav. Ecol. 3, 234–242.
318
15. Connor, R.C., Richards, A.F., Smolker, R.A., and Mann, J. (1996). Patterns of female
319
attractiveness in Indian Ocean bottlenose dolphins. Behaviour 133, 37–69.
320
16. Cappozzo, H.L., Túnez, J.I., and Cassini, M.H. (2008). Sexual harassment and female
321
gregariousness in the South American sea lion, Otaria flavescens. Naturwissenschaften
14
95, 625–630.
323
17. Muller, M.N., Kahlenberg, S.M., Emery Thompson, M., and Wrangham, R.W. (2007).
324
Male coercion and the costs of promiscuous mating for female chimpanzees. Proc. R.
325
Soc. B 274, 1009–1014.
326
18. Muller, M.N., Emery Thompson, M., Kahlenberg, S., and Wrangham, R. (2011). Sexual
327
coercion by male chimpanzees shows that female choice may be more apparent than real.
328
Behav. Ecol. Sociobiol. 65, 921–933.
329
19. Feldblum, J.T., Wroblewski, E.E., Rudicell, R.S., Hahn, B.H., Paiva, T.,
Cetinkaya-330
Rundel, M., Pusey, A.E., and Gilby, I.C. (2014). Sexually coercive male chimpanzees
331
sire more offspring. Curr. Biol. 24, 2855–2860.
332
20. Kaburu, S.S.K., and Newton-Fisher, N.E. (2015). Trading or coercion? Variation in male
333
mating strategies between two communities of East African chimpanzees. Behav. Ecol.
334
Sociobiol. 69, 1039–1052.
335
21. Enomoto, T. (1981). Male aggression and the sexual behavior of Japanese monkeys.
336
Primates 22, 15–23.
337
22. Goodall, J. (1986). The chimpanzees of Gombe: patterns of behaviour (Cambridge:
338
Harvard University Press).
339
23. Bulger, J.B. (1993). Dominance rank and access to estrous females in male savanna
340
baboons. Behaviour 127, 67–103.
341
24. Huchard, E., Courtiol, A., Benavides, J.A., Knapp, L.A., Raymond, M., and Cowlishaw,
342
G. (2009). Can fertility signals lead to quality signals? Insights from the evolution of
343
primate sexual swellings. Proc. R. Soc. B. 276, 1889–1897.
344
25. Weingrill, T., Lycett, J.E., Barrett, L., Hill, R.A., and Henzi, S.P. (2003). Male
345
consortship behaviour in chacma baboons: the role of demographic factors and female
346
conceptive probabilities. Behaviour 140, 405–427.
15
26. Alberts, S.C., Watts, H.E., and Altmann, J. (2003). Queuing and queue-jumping:
long-348
term patterns of reproductive skew in male savannah baboons, Papio cynocephalus.
349
Anim. Behav. 65, 821–840.
350
27. Alberts, S.C., Buchan, J.C., and Altmann, J. (2006). Sexual selection in wild baboons:
351
from mating opportunities to paternity success. Anim. Behav. 72, 1177–1196.
352
28. Smuts, B.B. (1985). Sex and friendship in baboons (New york: Aldine).
353
29. De Waal, F., and Yoshihara, D. (1983). Reconciliation and redirected affection in rhesus
354
monkeys. Behaviour 85, 224–241.
355
30. Kummer, H. (1968). Social organization of hamadryas baboons: a field study (Chicago
356
University Press).
357
31. Swedell, L., and Schreier, A. (2009). Male aggression toward females in hamadryas
358
baboons: conditioning, coercion, and control. In Sexual coercion in primates and
359
humans: an evolutionary perspective on male aggression against females, M. N. Muller
360
and R. W. Wrangham, eds. (Cambridge, Massachusetts: Harvard University Press), pp.
361
244–268.
362
32. Polo, P., and Colmenares, F. (2012). Behavioural processes in social context: female
363
abductions, male herding and female grooming in hamadryas baboons. Behav. Processes
364
90, 238–245.
365
33. Cheney, D.L., and Seyfarth, R.M. (1977). Behavior of adult and immature male baboons
366
during intergroup encounters. Nature 269, 404–406.
367
34. Cowlishaw, G. (1995). Behavioural patterns in baboon group encounters: the role of
368
resource competition and male reproductive strategies. Behaviour 132, 75–86.
369
35. Kitchen, D.M., Cheney, D.L., and Seyfarth, R.M. (2005). Contextual factors meditating
370
contests between male chacma baboons in Botswana: effects of food, friends and
371
females. Int. J. Primatol. 26, 105–125.
16
36. Kitchen, D.M., Beehner, J.C., Bergman, T.J., Cheney, D.L., Crockford, C., Engh, A.L.,
373
Fischer, J., Seyfarth, R.M., and Wittig, R.M. (2009). The causes and consequences of
374
male aggression directed at female chacma baboons. In Sexual coercion in primates and
375
humans: an evolutionary perspective on male aggression against females, M. N. Muller
376
and R. W. Wrangham, eds. (Cambridge, Massachusetts: Harvard University Press), pp.
377
128–156.
378
37. Le Boeuf, B.J., and Mesnick, S. (1991). Sexual behaviour of male northern elephant
379
seals: I. Lethal injuries to adult females. Behaviour 116, 143–162.
380
38. Szykman, M., Engh, A.L., Van Horn, R.C., Boydston, E.E., Scribner, K.T., and
381
Holekamp, K.E. (2003). Rare male aggression directed toward females in a
female-382
dominated society: baiting behavior in the spotted hyena. Aggress. Behav. 29, 457–474.
383
39. Linklater, W.L., Cameron, E.Z., Minot, E.O., and Stafford, J., K. (1999). Stallion
384
harassment and the mating system of horses. Anim. Behav. 58, 295–306.
385
40. Hohmann, G., and Fruth, B. (2003). Intra- and inter-sexual aggression by bonobos in the
386
context of mating. Behaviour 140, 1389–1413.
387
41. Manson, J.H. (1994). Male aggression: a cost of female mate choice in Cayo Santiago
388
rhesus macaques. Anim. Behav. 48, 473–475.
389
42. Réale, D., Boussès, P., and Chapuis, J.-L. (1996). Female-biased mortality induced by
390
male sexual harassment in a feral sheep population. Can. J. Zool. 74, 1812–1818.
391
43. Archie, E.A., Altmann, J., and Alberts, S.C. (2014). Costs of reproduction in a long-lived
392
female primate: injury risk and wound healing. Behav. Ecol. Sociobiol. 68, 1183–1193.
393
44. MacCormick, H.A., MacNulty, D.R., Bosacker, A.L., Lehman, C., Bailey, A., Anthony
394
Collins, D., and Packer, C. (2012). Male and female aggression: lessons from sex, rank,
395
age, and injury in olive baboons. Behav. Ecol. 23, 684–691.
396
45. Cheney, D.L., and Seyfarth, R.M. (2007). Baboon metaphysics - The evolution of a
17
social mind (Chicago: The University of Chicago Press).
398
46. Stumpf, R.M., Martinez-Mota, R., Milich, K.M., Righini, N., and Shattuck, M.R. (2011).
399
Sexual conflict in primates. Evol. Anthropol. Issues, News, Rev. 20, 62–75.
400
47. Caizergues, A., and Lambrechts, M.M. (1999). Male “macho” mammals exploiting
401
females versus male “Don Juan” birds exploited by females: the opposite-sex
402
exploitation (OSEX) theory. Ecol. Lett. 2, 204–206.
403
48. Pradhan, G.R., and van Schaik, C.P. (2009). Why do females find ornaments attractive?
404
The coercion-avoidance hypothesis. Biol. J. Linn. Soc. 96, 372–382.
405
49. Cowlishaw, G. (1997). Refuge use and predation risk in a desert baboon population.
406
Anim. Behav. 54, 241–53.
407
50. Higham, J.P., Heistermann, M., Ross, C., Semple, S., and MacLarnon, A. (2008). The
408
timing of ovulation with respect to sexual swelling detumescence in wild olive baboons.
409
Primates 49, 295–299.
410
51. Daspre, A., Heistermann, M., Hodges, J.K., Lee, P.C., and Rosetta, L. (2009). Signals of
411
female reproductive quality and fertility in colony-living baboons (Papio h. anubis) in
412
relation to ensuring paternal investment. Am. J. Primatol. 71, 529–538.
18
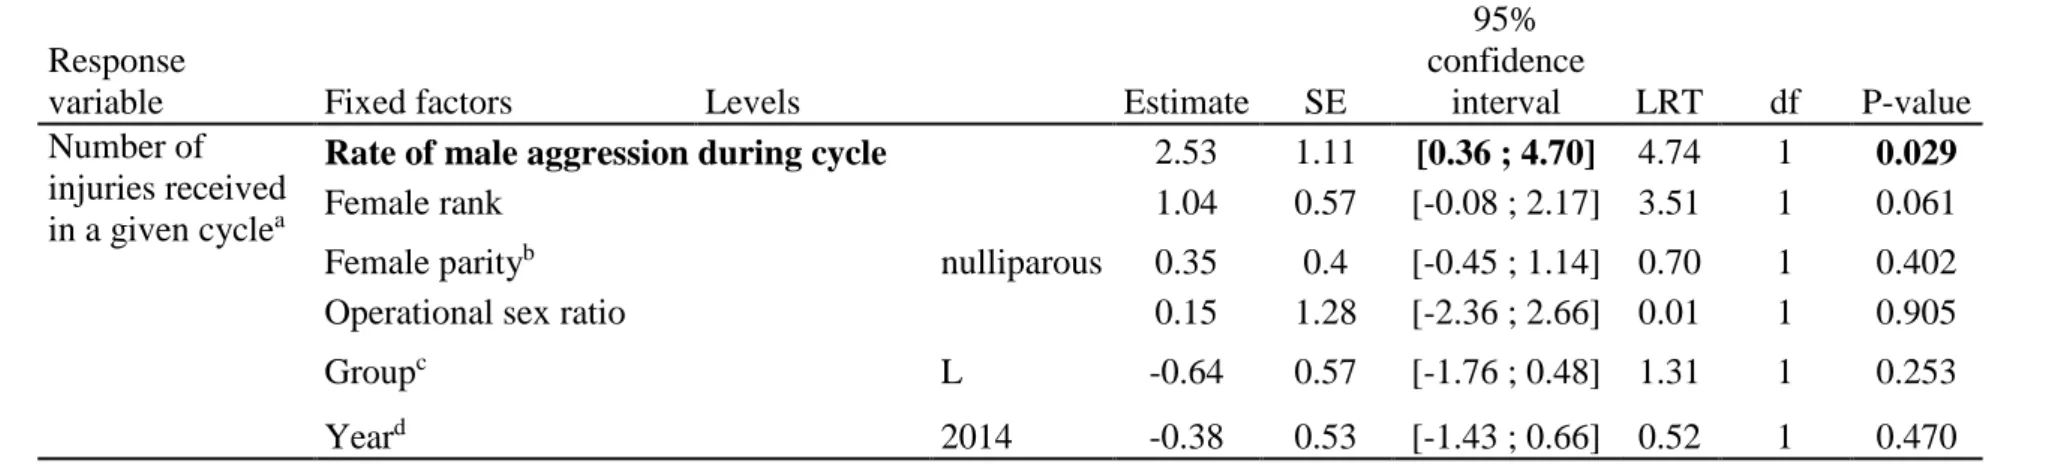
Table 1. Influence of the mean hourly rate of male aggression received by females (calculated from focal observations) on their daily rate of
414
injury. Parameters and tests are based on the observation of 30 injuries and 119 aggressive acts, distributed among 64 cycles of 30 different
415
females (number of focals per cycle: mean±sd:11.2±5.0). Significant variables appear in bold. SE: Standard Error, LRT: statistic of a likelihood
416
ratio test, df: degrees of freedom.
417 418
Response
variable Fixed factors Levels Estimate SE
95% confidence interval LRT df P-value Number of injuries received in a given cyclea
Rate of male aggression during cycle 2.53 1.11 [0.36 ; 4.70] 4.74 1 0.029
Female rank 1.04 0.57 [-0.08 ; 2.17] 3.51 1 0.061
Female parityb nulliparous 0.35 0.4 [-0.45 ; 1.14] 0.70 1 0.402 Operational sex ratio 0.15 1.28 [-2.36 ; 2.66] 0.01 1 0.905
Groupc L -0.64 0.57 [-1.76 ; 0.48] 1.31 1 0.253
Yeard 2014 -0.38 0.53 [-1.43 ; 0.66] 0.52 1 0.470
a The number of days of the cycle observed fitted as an offset fixed factor, which modelize a daily rate of injury
419
b Reference category: parous
420
c Reference category: J group
421
d Reference category: 2013. Injuries were only collected in 2013 and 2014.
19
Table 2. Influence of the mean hourly rate of aggression received from a male by an unguarded female throughout her oestrus cycle but prior to
423
peri-ovulatory period (POP) (calculated from focal observations) on the same male's probability of mate-guarding her during her subsequent
424
POP. Parameters and tests are based on 58 cycles and 74 male-female aggressive acts, distributed among 30 females (number of focal
425
observations per cycle: mean±sd:16.07±12.00, number of mate-guarding males per cycle: 1.20±0.72, range: [0-4]), and 39 males, and analysed
426
using a GLMM. Significant variables appear in bold. SE: Standard Error, LRT: statistic of a likelihood ratio test, df: degrees of freedom. LRT
427
tests are used to test for the significance of each variable, while the confidence intervals are used to test for the significance of each level of the
428
qualitative variables.
429 430
Response
variable Fixed factors Levels Estimate SE
95% confidence
interval LRT df P-value Probability that
a male mate-guards a female during her POP (0/1)
Rate of male-female aggression during cycle 5.22 2.03 [1.24 ; 9.19] 7.47 1 0.006
Rate of male aggression toward all individuals 47.44 50.35 [-51.25 ; 146.13] 0.85 1 0.356
Female rank -0.87 0.48 [-1.81 ; 0.06] 3.37 1 0.066
Female paritya nulliparous -0.96 0.43 [-1.80 ; -0.12] 5.82 1 0.016
Male rank 2.30 0.63 [1.06 ; 3.54] 12.01 1 0.001
Operational sex ratio 0.89 0.99 [-1.05 ; 2.84] 0.83 1 0.364
Groupb L 0.24 0.38 [-0.50 ; 0.98] 0.39 1 0.533
Yearc 2006 0.61 0.61 [-0.57 ; 1.80] 8.41 3 0.038
2013 -1.10 0.78 [-2.63 ; 0.43]
2014 -0.80 0.75 [-2.26 ; 0.66]
a Reference category: parous
431
b Reference category: J group
432
c Reference category: 2005. LRT tests are used to test for significance of the whole variable “Year”, while the confidence intervals are used
433
to test for significance of each level of the variable.
20
FIGURES LEGENDS
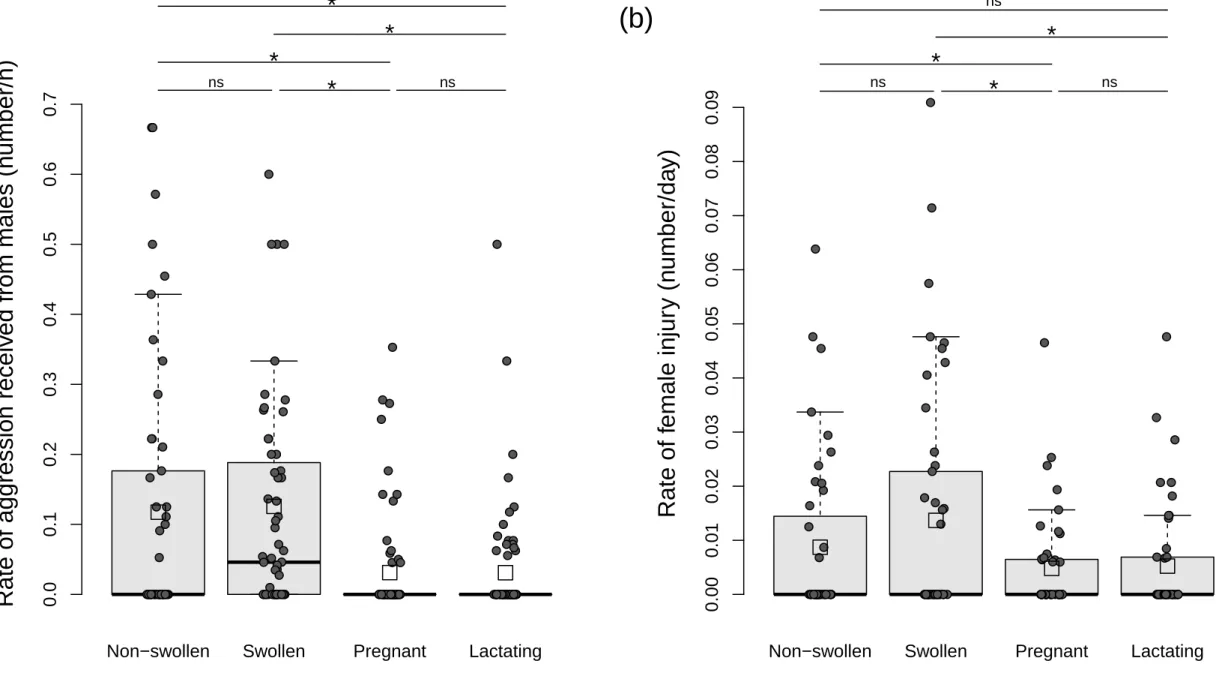
Figure 1. Cycling females receive more aggression from males and more injuries than non-cycling females.
Distribution of the (a) mean rate of male aggression against females (related to Table S2) and (b) mean rate of female injuries (related to Table S4) across female reproductive states. Boxplots are drawn from the raw individual means per year (represented by black dots). The bottom and top of the box respectively represent the 25th and 75th quartiles, and the bold horizontal line the median. Whiskers include the interquartile range. Open squares represent the mean of the distribution. Note that the boxes representing the rate of aggression received by pregnant and lactating females are not visible because the median, the 25th and 75th quartiles are equal to zero. Comparisons are denoted by "*" if significant and by “ns” otherwise.
Figure 2. Male-female aggression predicts future mating success for males and risk of injury for females.
(a) Partial residual plot of the number of injuries incurred by cycling females during a cycle in relation to the mean rate of male aggression
received during the same cycle (calculated from focal observations). Black dots represent partial residuals of the GLMM, the black line is the model prediction, and the grey area the confidence intervals. The prediction line is drawn holding all other fixed effects constant, using the median for numeric variables and most common category for factors (i.e., for a multiparous female, of rank 0.6, cycling over 38 days, in L group, when there were 9 adult males present, in 2014). Related to Table 1. (b) A female injured three times by her mate-guarding male on the head, who died for unknown reasons 6 months later. (c) Partial residual plot of the probability of establishing a mate-guarding episode with a male in the POP of a cycle in relation to the mean rate of aggression received from him throughout the cycle (calculated from focal observations). The prediction line is drawn for a multiparous female, of rank 0.5, a male of rank 0.5 and an overall rate of aggression of 0.005 time/day, in L group, in 2014. Related to Table 2. (d) A male directs aggression towards a female. Photo credit: Alecia Carter.
Rate of aggression receiv
ed from males (n
umber/h)
● ● ● ● ●●●● ● ● ● ● ● ● ● ● ● ● ● ● ● ● ●● ● ● ● ● ● ● ● ● ●● ● ● ●●● ● ● ● ● ● ● ● ● ● ● ● ● ● ● ● ● ● ● ● ● ● ● ● ● ● ● ●● ● ● ● ● ● ● ● ● ● ● ● ● ● ●● ●● ● ● ● ●● ● ● ● ● ●●●● ● ● ● ● ● ● ● ● ● ● ● ● ●●●● ● ●●●●●●●● ● ● ● ● ● ●● ● ●● ● ● ● ● ● ● ●●● ● ● ● ●● ● ● ● ● ●● ● ● ● ● ●●● ●●●● ● ● ● ● ● ● ● ● ● ●●● ● ● ● ● ● ● ●● ● ● ● ● ● ●●●●● ●● ●●●●●● ● ● ●● ●● ● ●● ●● ● ● ● ● ● ●●●●● ● ● ● ●● ● ●● ●●●●●●●● ● ● ● ● ● ● ● ●Non−swollen Swollen Pregnant Lactating
0.0 0.1 0.2 0.3 0.4 0.5 0.6 0.7
Female reproductive state
ns
*
ns*
*
*
Rate of f
emale injur
y (n
umber/da
y)
●●●●● ● ●● ● ● ● ● ●● ● ● ● ●● ● ●● ● ●● ● ● ● ●● ● ● ● ● ● ● ● ● ●● ● ● ● ●● ● ● ● ● ● ● ● ● ● ● ● ● ● ●●● ● ● ● ● ● ● ● ● ●● ● ● ● ● ●●● ● ● ● ● ● ● ● ● ●●● ●● ●●●●●● ● ● ● ● ● ● ● ● ● ● ● ● ●● ● ●●● ● ● ● ● ● ●● ● ● ● ● ● ● ● ● ● ● ● ● ●● ●● ●●● ● ● ● ● ● ● ● ● ● ● ● ● ● ● ●●● ● ● ●●●● ●● ● ●● ●● ● ● ● ● ● ● ● ●Non−swollen Swollen Pregnant Lactating
0.00 0.01 0.02 0.03 0.04 0.05 0.06 0.07 0.08 0.09
Female reproductive state
ns
*
ns*
*
ns(a)
(b)
Figure 2.
Supplemental Tables
1 2
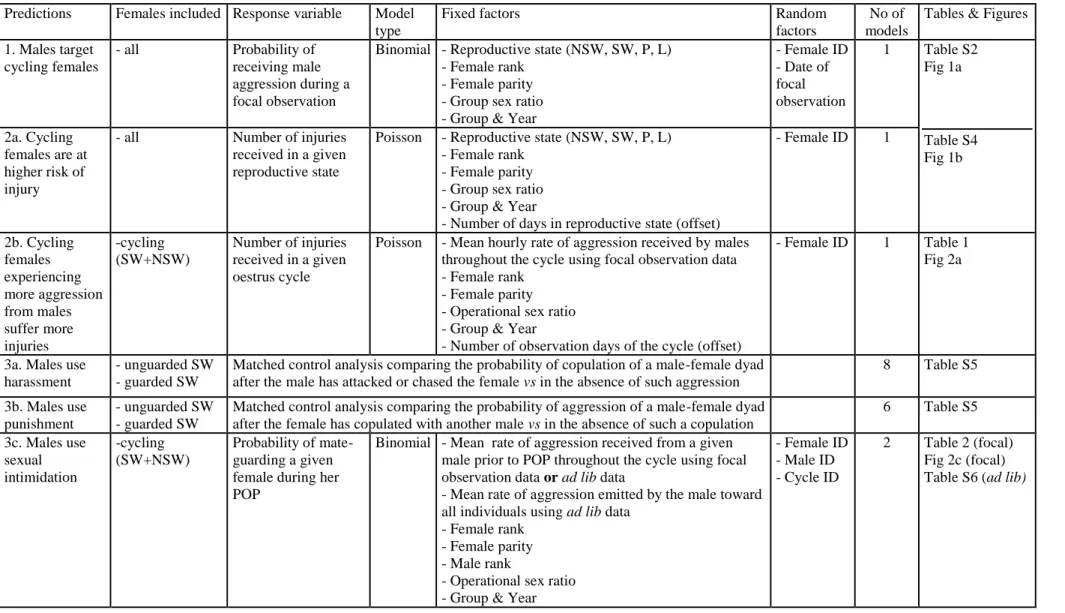
Table S1. Summary of the statistical analyses explained in the Experimental Procedures. SW: swollen, NSW: non-swollen, P: pregnant, L: lactating
3 4
Predictions Females included Response variable Model type
Fixed factors Random
factors
No of models
Tables & Figures
1. Males target cycling females - all Probability of receiving male aggression during a focal observation
Binomial - Reproductive state (NSW, SW, P, L) - Female rank
- Female parity - Group sex ratio - Group & Year
- Female ID - Date of focal observation 1 Table S2 Fig 1a 2a. Cycling females are at higher risk of injury
- all Number of injuries received in a given reproductive state
Poisson - Reproductive state (NSW, SW, P, L) - Female rank
- Female parity - Group sex ratio - Group & Year
- Number of days in reproductive state (offset)
- Female ID 1 Table S4 Fig 1b 2b. Cycling females experiencing more aggression from males suffer more injuries -cycling (SW+NSW) Number of injuries received in a given oestrus cycle
Poisson - Mean hourly rate of aggression received by males throughout the cycle using focal observation data - Female rank
- Female parity - Operational sex ratio - Group & Year
- Number of observation days of the cycle (offset)
- Female ID 1 Table 1 Fig 2a
3a. Males use harassment
- unguarded SW - guarded SW
Matched control analysis comparing the probability of copulation of a male-female dyad after the male has attacked or chased the female vs in the absence of such aggression
8 Table S5
3b. Males use punishment
- unguarded SW - guarded SW
Matched control analysis comparing the probability of aggression of a male-female dyad after the female has copulated with another male vs in the absence of such a copulation
6 Table S5 3c. Males use sexual intimidation -cycling (SW+NSW) Probability of mate-guarding a given female during her POP
Binomial - Mean rate of aggression received from a given male prior to POP throughout the cycle using focal observation data or ad lib data
- Mean rate of aggression emitted by the male toward all individuals using ad lib data
- Female rank - Female parity - Male rank
- Operational sex ratio - Group & Year
- Female ID - Male ID - Cycle ID 2 Table 2 (focal) Fig 2c (focal) Table S6 (ad lib)
Table S2. Influence of female reproductive state on the probability that she receives male aggression during a one-hour focal observation. Parameters and tests are based on
5
3439 focal observations (including 172 observations with aggression) distributed among 53 females. Significant variables appear in bold. SE: Standard Error, LRT: statistic of
6
a likelihood ratio test, df: degrees of freedom. LRT tests are used to test for the significance of each variable, while the confidence intervals are used to test for the significance
7
of each level of the qualitative variables.Related to main-text results, section 1.
8 9 10
Response variable Fixed factors Levels Estimate SE
95% confidence interval LRT df P-value Probability of receiving aggression from males (0/1)
Reproductive state Swollen (ref: non-swollen) -0.14 0.21 [-0.55 ; 0.28] 32.53 3 <0.001 Pregnant (ref: non-swollen) -1.02 0.27 [-1.56 ; -0.48]
Lactating (ref: non-swollen) -1.26 0.31 [-1.86 ; -0.65] Swollen (ref: pregnant) 0.89 0.25 [0.41 ; 1.37] Swollen (ref: lactating) 1.12 0.28 [0.57 ; 1.67] Pregnant (ref: lactating) 0.23 0.32 [-0.39 ; 0.86]
Female rank 0.08 0.28 [-0.47 ; 0.63] 0.08 1 0.778 Female paritya nulliparous 0.13 0.21 [-0.28 ; 0.54] 0.37 1 0.541
Sex ratio -0.04 0.21 [-0.46 ; 0.38] 0.03 1 0.853 Groupb L -0.13 0.21 [-0.55 ; 0.29] 0.36 1 0.551
Yearc 2006 -0.42 0.35 [-1.10 ; 0.26] 74.41 3 <0.001
2013 -1.00 0.45 [-1.88 ; -0.12]
2014 1.14 0.29 [0.57 ; 1.71]
a Reference category: parous
11
b Reference category: J group
12
c Reference category: 2005
13 14
Table S3. Influence of female reproductive state on the probability of initiating aggression toward any individual of the group during a one-hour focal observation. Parameters
15
and tests are based on 3439 focal observations (including 843 observations with aggression) distributed among 53 females. Significant variables appear in bold. SE: Standard
16
Error, LRT: statistic of a likelihood ratio test, df: degrees of freedom. LRT tests are used to test for the significance of each variable, while the confidence intervals are used to
17
test for the significance of each level of the qualitative variables. Related to main-text results, section 1.
18 19 20 21
Response variable Fixed factors Levels Estimate SE 95% confidence
interval LRT df P-value Probability of
initiating an aggression toward any individual (0/1)
Reproductive state Swollen (ref: non-swollen) 0.03 0.14 [-0.25 ; 0.30] 7.39 3 0.060 Pregnant (ref: non-swollen) 0.33 0.15 [0.03 ; 0.62]
Lactating (ref: non-swollen) 0.09 0.15 [-0.22 ; 0.39] Swollen (ref: pregnant) -0.30 0.12 [-0.54 ; -0.06] Swollen (ref: lactating) -0.06 0.13 [-0.30 ; 0.19] Pregnant (ref: lactating) 0.24 0.13 [-0.02 ; 0.50]
Female rank 2.30 0.18 [1.95 ; 2.64] 70.10 1 <0.001 Female paritya nulliparous 0.19 0.13 [-0.06 ; 0.44] 2.13 1 0.145
No of individuals in group -0.02 0.01 [-0.04 ; -0.01] 9.05 1 0.003 Groupb L -0.15 0.13 [-0.40 ; 0.10] 1.31 1 0.252
Yearc 2006 0.46 0.18 [0.11 ; 0.81] 101.47 3 <0.001
2013 1.12 0.26 [0.61 ; 1.63]
2014 2.19 0.27 [1.67 ; 2.71]
a Reference category: parous
22
b Reference category: J group
23
c Reference category: 2005
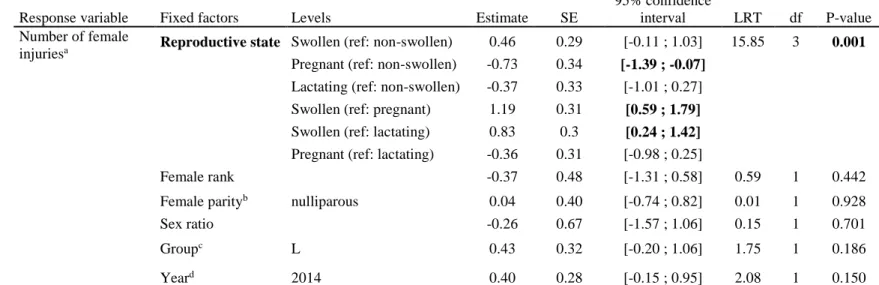
Table S4. Influence of female reproductive state on the daily rate of injury. Parameters and tests are based on the observation of 96 injuries distributed among 39 females.
25
Significant variables appear in bold. SE: Standard Error, LRT: statistic of a likelihood ratio test, df: degrees of freedom. LRT tests are used to test for the significance of each
26
variable, while the confidence intervals are used to test for the significance of each level of the qualitative variables. Related to main-text results, section 2.
27 28
Response variable Fixed factors Levels Estimate SE
95% confidence interval LRT df P-value Number of female injuriesa
Reproductive state Swollen (ref: non-swollen) 0.46 0.29 [-0.11 ; 1.03] 15.85 3 0.001 Pregnant (ref: non-swollen) -0.73 0.34 [-1.39 ; -0.07]
Lactating (ref: non-swollen) -0.37 0.33 [-1.01 ; 0.27] Swollen (ref: pregnant) 1.19 0.31 [0.59 ; 1.79] Swollen (ref: lactating) 0.83 0.3 [0.24 ; 1.42] Pregnant (ref: lactating) -0.36 0.31 [-0.98 ; 0.25]
Female rank -0.37 0.48 [-1.31 ; 0.58] 0.59 1 0.442 Female parityb nulliparous 0.04 0.40 [-0.74 ; 0.82] 0.01 1 0.928
Sex ratio -0.26 0.67 [-1.57 ; 1.06] 0.15 1 0.701 Groupc L 0.43 0.32 [-0.20 ; 1.06] 1.75 1 0.186
Yeard 2014 0.40 0.28 [-0.15 ; 0.95] 2.08 1 0.150 a The number of days spent in the reproductive state was fitted as an offset fixed factor, which modelize a daily rate of injury
29
b Reference category: parous
30
c Reference category: J group
31
d Reference category: 2013. Injuries were only collected in 2013 and 2014.
32 33
Table S5. Results of the matched-control analyses testing for sexual harassment and punishment from (a) any male for unguarded females and (b) male consorts for
mate-34
guarded females. For sexual harassment, we tested the difference between the proportion of copulations during post-aggression (PA) and matched-control (MC) observations
35
using McNemar's Chi-squared tests for 4 different time periods.For punishment, we tested the difference between the proportion of aggressive acts during post-copulation
36
(PC) and MC observations using McNemar's Chi-squared tests for 3 different time periods. Significant p-values are set at 0.007 due to Bonferroni correction. Related to
main-37
text results, section 3a&b.
38 39 40 41
(a) Unguarded females (b) Mate-guarded females
N. cop in PAa/ agg in PCb N. cop/agg in MCc Sample sized X2 df P-valuee Median time of observation N. cop in PAa/ agg in PCb N. cop/agg in MCc Sample sized X2 df P-valuee Median time of observation 05 min 1 3 52 0.25 1 0.617 5 9 3 45 3.13 1 0.077 5 Harassment 10 min 1 2 52 0.00 1 1.000 10 10 4 45 2.08 1 0.149 10 15 min 2 0 51 0.50 1 0.480 15 11 9 43 0.08 1 0.773 15 20 min 2 1 47 0.00 1 1.000 17 12 10 41 0.08 1 0.773 20 05 min 2 8 1334 2.50 1 0.114 5 1 0 31 0.00 1 1.000 5 Punishment 10 min 3 8 1062 1.78 1 0.182 10 1 0 31 0.00 1 1.000 10 15 min 4 14 771 5.06 1 0.024 13 1 0 31 0.00 1 1.000 15
a Number of PA observations including a copulation with the male aggressor (for harassment)
42
b Number of PC observations where aggression was received from a non-copulating male after a copulation (for punishment).
43
c Number of MC observations with a copulation (for harassment) or with an aggressive act (for punishment).
44
d Number or PA-MC or PC-MC pairs available for the test.
45
e McNemar's Chi-squared test.
46 47
Table S6. Influence of the mean daily rate of aggression received from a male by an unguarded female throughout her oestrus cycle but prior to her peri-ovulatory period
48
(POP) (calculated from ad libitum data) on the same male's probability of mate-guarding her during her subsequent POP. Parameters and tests are based on 78 cycles, 309
49
male-female aggressive acts, 2240 total aggressive acts from males, distributed among 34 females (number of days of observation per cycle: mean±sd:29.0±14.1, number of
50
mate-guarding males per cycle: 1.10±0.69, range: [0-4]),) and 39 males, and performed using a GLMM controlling for female identity, male identity and cycle identity (fitted
51
as random factors). Significant variables appear in bold. SE: Standard Error, LRT: statistic of a likelihood ratio test, df: degrees of freedom. LRT tests are used to test for the
52
significance of each variable, while the confidence intervals are used to test for the significance of each level of the qualitative variables. Related to main-text results, section
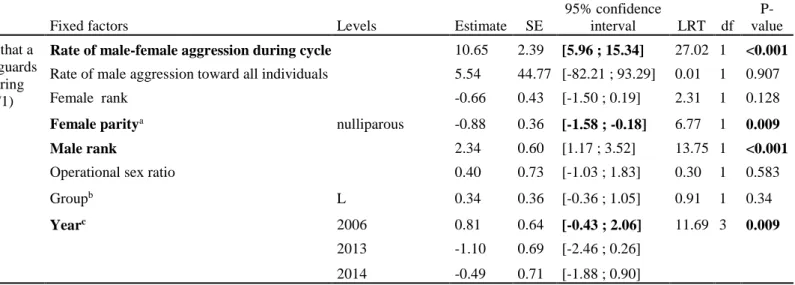
53 3c. 54 55 56 57 Response
variable Fixed factors Levels Estimate SE
95% confidence interval LRT df P-value Probability that a male mate-guards a female during her POP (0/1)
Rate of male-female aggression during cycle 10.65 2.39 [5.96 ; 15.34] 27.02 1 <0.001 Rate of male aggression toward all individuals 5.54 44.77 [-82.21 ; 93.29] 0.01 1 0.907 Female rank -0.66 0.43 [-1.50 ; 0.19] 2.31 1 0.128 Female paritya nulliparous -0.88 0.36 [-1.58 ; -0.18] 6.77 1 0.009
Male rank 2.34 0.60 [1.17 ; 3.52] 13.75 1 <0.001 Operational sex ratio 0.40 0.73 [-1.03 ; 1.83] 0.30 1 0.583 Groupb L 0.34 0.36 [-0.36 ; 1.05] 0.91 1 0.34
Yearc 2006 0.81 0.64 [-0.43 ; 2.06] 11.69 3 0.009
2013 -1.10 0.69 [-2.46 ; 0.26]
2014 -0.49 0.71 [-1.88 ; 0.90]
a Reference category: parous
58
b Reference category: J group
59
c Reference category: 2005
60 61
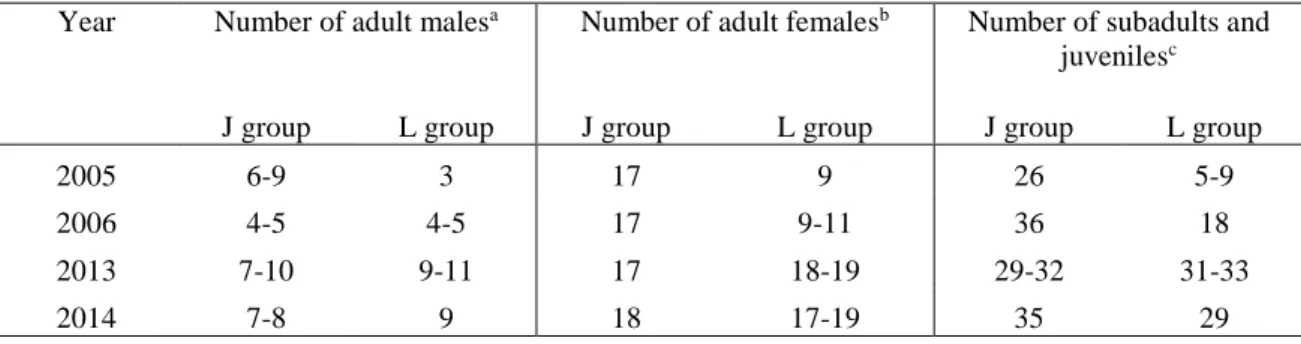
Table S7. Demography of J and L groups in the study periods: June-December 2005, May 2006-January 2007, June-October 2013 and May-November 2014. Demography
62
varies due to migrations, births, disappearances, and life-history transitions (i.e. from juvenile to adulthood). Age was estimated from a combination of known birth dates and
63
dental patterns of tooth eruption and wear, examined during prior captures [1]. Related to main-text Experimental Procedures.
64 65 66 67
Year Number of adult malesa Number of adult femalesb
Number of subadults and juvenilesc
J group L group J group L group J group L group
2005 6-9 3 17 9 26 5-9
2006 4-5 4-5 17 9-11 36 18
2013 7-10 9-11 17 18-19 29-32 31-33
2014 7-8 9 18 17-19 35 29
68
a Males are considered adult when they reach eight years of age [2].
69
b Females are considered adult when they reach menarche [3].
70
c Malesare consideredsubadult between 4 and 8 years old, and juveniles below 4 years old [2].
72
Table S8. Sample size of behavioural focal observations. Related to main-text, Experimental Procedures.
73 74 75 76
Reproductive state Number of focal observations
Number of individuals
Number of focal observations per individual
(mean±sd ; [min-max])
Adult females Lactating 884 45 19.6±10.5 ; [1-45] Pregnant 714 47 15.2±9.7 ; [1-46] Non-swollen 469 36 13.0±9.7 ; [1-40] Swollen mate-guarded 491 32 15.3±14.5 ; [1-53] Swollen unguarded 881 39 22.6±21.5 ; [1-81] Adult males 520 25 20.8±8.9 ; [4-37] 77
Supplemental Experimental Procedures
78 79 80
Appendix 1. Description of the analysis testing the influence of female reproductive state on the
81
probability that females initiate aggression toward any individual of the group
82
We investigated whether the reproductive state of females influenced their propensity to initiate aggression. A
83
binomial GLMM with a logit link function was run, using the probability that a female initiates aggression
84
towards any group member during a one-hour focal observation (yes/no) as the response variable. In this model,
85
we include any type of aggression (supplant, displacement, threat, chase and attack). Reproductive state
(non-86
swollen, swollen, pregnant, or lactating) was fitted as a fixed factor together with the following control variables:
87
female dominance rank, female age, the number of individuals in the group (since females may be more likely to
88
initiate aggression when more individuals are present), year, and group identity. Random factors comprised
89
female identity and the date of focal sampling. Results of this model are given in Table S3.
90 91 92
Appendix 2. Description of the matched-control analysis of sexual harassment
93
Using both male and female focal observations, we tested whether an adult male was more likely to copulate
94
with a female after he attacked her across 4 different time intervals (x=5, 10, 15 and 20 minutes). We did not
95
have enough matched-control observations to investigate longer time intervals. After each incidence of
male-96
female aggression during a focal follow, we selected the x following minutes of observation, hereafter the
post-97
aggression (PA) observation, and assessed whether a copulation occurred with the male aggressor (no: 0; yes: 1).
98
To each PA observation, we matched an observation of the same length of time for the same female, where no
99
male aggression occurred during the previous x minutes, hereafter the matched-control (MC) observation, and
100
assessed whether she copulated with the male aggressor of the PA observation. We compared the difference in
101
the proportions of observations including copulations between the post-aggression (PA) and matched-control
102
(MC) observations using McNemar's Chi-squared tests.
103
Matched control (MC) observations corresponding to a particular post-aggression (PA) observation
104
were chosen from 60-minutes focal observations of (1) the same female, who was (2) in the same consortship
105
status as in the PA observation (unguarded, or guarded by the same male), and (3) in the same cycle and located
106
less than 7 days apart from the PA observation. For PA observations that had several possible MC observations,
107
we paired MC and PA observations in a way that minimized the number of times each MC observation was
108
reused. For models investigating periods of x minutes post-aggression (x taking a range of values from 5 to 20,
109
with increments of 5), the first x minutes of each MC observation were discarded in case an event of
male-110
female aggression occurred immediately before the start of the focal. Within suitable 60-minutes MC
111
observations, the time period selected as an MC sample (which was less than the duration of the entire focal
112
observation) was chosen randomly. Some focal observations were used to draw more than one MC sample (for
113
example, minutes 15-20 and then minutes 45-50 of a 60-minutes focal observation). In such cases, we attempted
114
to sample non-overlapping time periods within the 60-minutes observation. When this was not possible (e.g. the
115
same 60-minutes observation was used to draw three MC samples for the dataset looking at intervals of 20
116
minutes), we randomly deleted some PA observations relying on this 60-minutes observation in order to keep
117
only independent PA/MC pairs. In the PA samples, when the x minutes were incomplete (e.g. when a second
118
incidence of male-female aggression occurred within the same time interval or when the focal observation
119
finished before the end of the time interval), we reduced the time interval of the matched MC sample accordingly
120
so that the matched PA and MC samples are of similar duration. However, we only kept aggressive acts that
121
were followed by at least 1 minute of observation (see Table S4 for the median observation time after aggressive
122
acts for each analysis). Note that across the 4 different datasets (i.e. 5, 10, 15, 20 min), the same PA-MC pairs
123
were kept but the random sampling of MC samples within 60-minutes observations was rerun for each dataset
124
(in order to optimize the sample size in each dataset).
125
We ran these analyses separately for unguarded and mate-guarded females, since we may expect
126
different coercion strategies from males not involved in mate-guarding or from male consorts (who already have
127
sexual access to females and may not benefit from harassment).
128 129 130
Appendix 3. Description of the matched-control analysis of punishment
131
We tested whether an adult male was more likely to attack a female after she has copulated with a rival using a
132
similar matched-control analysis across 3 different time intervals (x=5, 10, 15 minutes). We did not have enough
133
matched-control observations to investigate longer time intervals. After each copulation, we determined whether
134
the female received aggression from a male who was not involved in the copulation, within a given time interval.
135
For these post-copulation (PC) observations, we selected MC observations, without a copulation event, as