HAL Id: hal-01849787
https://hal.inria.fr/hal-01849787
Submitted on 26 Jul 2018
HAL is a multi-disciplinary open access
archive for the deposit and dissemination of
sci-entific research documents, whether they are
pub-lished or not. The documents may come from
teaching and research institutions in France or
abroad, or from public or private research centers.
L’archive ouverte pluridisciplinaire HAL, est
destinée au dépôt et à la diffusion de documents
scientifiques de niveau recherche, publiés ou non,
émanant des établissements d’enseignement et de
recherche français ou étrangers, des laboratoires
publics ou privés.
Video Surveillance
Serhan Cosar, Giuseppe Donatiello, Vania Bogorny, Carolina Garate, Luis
Alvares, François Bremond
To cite this version:
Serhan Cosar, Giuseppe Donatiello, Vania Bogorny, Carolina Garate, Luis Alvares, et al.. Towards
Abnormal Trajectory and Event Detection in Video Surveillance. IEEE Transactions on Circuits and
Systems for Video Technology, Institute of Electrical and Electronics Engineers, 2016. �hal-01849787�
Towards Abnormal Trajectory and Event Detection
in Video Surveillance
Serhan Coşar, Giuseppe Donatiello, Vania Bogorny, Carolina Gárate, Luis Otavio Alvares,
and François Brémond
Abstract—In this paper we present a unified
ap-proach for abnormal behavior detection and group be-havior analysis in video scenes. Existing approaches for abnormal behavior detection do either use trajectory based or pixel based methods. Unlike these approaches, we propose an integrated pipeline that incorporates the output of object trajectory analysis and pixel-based analysis for abnormal behavior inference. This enables to detect abnormal behaviors related to speed and direction of object trajectories, as well as complex behaviors related to finer motion of each object. By applying our approach on three different datasets, we show that our approach is able to detect several types of abnormal group behaviors with less number of false alarms compared to existing approaches.
Index Terms—abnormal event detection, group
be-havior analysis, trajectory-based analysis, pixel-based analysis, fused approach
I. Introduction and Motivation
I
T is well known that anomalous behavior detection and group behavior analysis is an important problem in video surveillance. This can be noticed by the number of papers that addressed the problem in the last ten years [1], [2]. In this paper, as in the majority of existing studies, we consider as abnormal the events that are rare in the scene, and which are different from the majority. In the literature, there are basically three main categories of work for anomalous behavior detection in videos. The first category is based on the explicit event modeling using supervised techniques, where the model of abnormal behavior is learned from the training set and the system should detect the abnormalities defined in the model [1]. The problem of these approaches is that the abnormality detection really depends on previously collected and annotated videos.Portions of this research were done while S. Coşar, G. Donatiello, V. Bogorny, and L.O. Alvares were with INRIA-Sophia Antipolis, 2004 Route de Lucioles, Sophia Antipolis.
S. Coşar is with School of Computer Science, University of Lincoln, United Kingdom (e-mail: [email protected]).
G. Donatiello is with Technogym SpA, Cesena - Italy (e-mail:[email protected]).
V. Bogorny is with Post-graduate Program in Computer Science, Department of Informatics and Statistics, Universidade Federal de Santa Catarina, Brazil (e-mail:{vania.bogorny,luis.alvares}@ufsc.br). L.O. Alvares is with Department of Informatics and Statistics, Universidade Federal de Santa Catarina, Brazil (e-mail:{vania.bogorny,luis.alvares}@ufsc.br).
C. Gárate and F. Brémond are with INRIA-Sophia Antipolis, 2004 Route de Lucioles, Sophia Antipolis (e-mail:{carolina.garate,francois.bremond}@inria.fr).
The second category includes approaches developed for specific applications using knowledge-based systems, representing a specific abnormal behavior manually defined by the user, as for instance, detecting threats for cargo video surveillance [3].
The third category of work, which is the focus of this paper, is about unsupervised approaches that can detect abnormal behaviors not restricted to prior knowledge, and without the need of training. However, in this category, most studies detect only simple abnormal events such as cars and bicycles among pedestrians. They analyze the optical flow and acceleration, which is very discriminative among these objects [4]. Other approaches simply classify the objects that are not grouped into clusters, representing the outliers, as abnormal [5]–[7], or detect objects that move in different speed or direction as unusual events [8]. In this class of work, there are two main categories: trajectory-based [9] and pixel-based [10]–[12] approaches.
We claim that there are abnormal behaviors that cannot be detected by using either trajectory-based or pixel-based methods. Abnormalities in speed and direction can be easily detected from trajectories. However, abnormal actions such as jumping or fighting may not be detected from the analysis of the spatio-temporal trajectory points, as these actions are related to the body movements of the person, rather than global movements. Similarly, pixel-based approaches may not detect a terrorist or a thief which is loitering, since this activity is related to global movement of the person rather than the finer body movements. On the other hand, loitering can be discovered using the global object trajectories. Therefore, in this paper we propose a fused approach that combines global object trajectory with finer local motion information to detect events related to speed and direction and more complex events related to finer motion of each object. While existing approaches for unsupervised anomalous behavior detection use either object tracking or pixel based
analysis, our approach incorporates both of them.
In summary, we make the following contributions to the state of the art of abnormal behavior detection:
of trajectories called snapped trajectories, that do not only decrease computational load, but also enable finding scene regions,
(ii) our approach, in an unsupervised way, can auto-matically discover important zones in the scene that represent distinctive motion among other regions (e.g., a zone where people move fast),
(iii) we propose a unified framework (a pipeline) that incorporates the output of object trajectory analysis with pixel-based analysis allowing to detect abnor-mal behaviors related to speed and direction of object trajectories, as well as complex behaviors related to finer motion of each object,
(iv) our approach can detect abnormal behavior for both groups and individual objects without requiring a training set.
In most unsupervised approaches, normal events are learned in a clean video sequence which does not include any abnormal event [13], [14]. However, this is a certain limitation in many aspects. In many applications, it is very likely that the training set will include abnormal events. Therefore, these unsupervised approaches may not learn an appropriate model to correctly classify abnormal behaviors, mainly when there are several abnormal events in the training set. In addition, the learning is limited with the normal trajectories that are present in the clean sequence. If there are other types of normal trajectories that appear in a different part of the video, the algorithm cannot learn these normal instances and will detect these normal trajectories as abnormal events. On the other hand, since we run our unsupervised learning framework over the whole video, it learns all the types of normal events present in the video and distinguishes the abnormal events.
We evaluated the proposed approach on three different categories of datasets: Subway [8] and Mind’s Eye [15], which are two popular public datasets that have been used by a large number of approaches in various applications, and Vanaheim Metro [16], which is a European project dataset collected in Paris metro stations.
The rest of the paper is organized as follows: Section II presents related work in the field of abnormal behavior detection from videos. In Section III, we explain the details of our unsupervised approach and how we detect different types of abnormality. In Section IV, the datasets are described in details and experimental results are given. Finally, in Section V, we draw the conclusion and talk about future directions.
II. Related work
In this paper, we focus on trajectory-based and pixel-based approaches for unsupervised abnormal behavior detection [2].
A. Trajectory-based Approaches
Abnormal behavior detection without using prior knowledge about abnormal events is normally done by clustering the trajectories of the detected moving objects, and the obtained clusters are then used to define the normal model for anomaly detection [6]. Piciarelli et al. [5] proposed a trajectory clustering method, considering the distance between trajectory points, where the parts of the same trajectory (subtrajectories) can belong to different clusters. After the clustering step, a tree is build with the sequence of clusters, and an anomalous trajectory is defined as a trajectory that matches a path in the tree of clusters with low probability. This approach could detect cars driving in the wrong direction, but it does not distinguish among different types of abnormal behavior, such as going fast/slow or abnormal action (e.g., fighting). Similarly, in [6], this work is extended to use SVM for detecting the trajectories with different movements from the typical trajectory patterns as anomalous events, and no explicit labeled event is recognized.
In [17], Patino et al. focused on detecting people loitering around the queue and people going against the flow of the queue (e.g., undertaking a suspicious path). Trajectories of moving objects are used to find zones of speed and direction changes. According to the time spent inside the zones and the frequency of a path for a given trajectory, loitering and suspicious path events are detected. However, finer abnormal motions, such as fighting, cannot be detected.
The authors in [18] introduced the factor of stationary crowd groups to model pedestrian behaviors in crowd, such as walking through or walking bypass stationary groups. Energy maps, that represent the regions where pedestrians tend to travel, are created by taking into account the interaction among moving pedestrians and between pedestrians and stationary groups. Based on the energy maps, for a given source and destination points, the fast marching algorithm is used to learn the paths of pedestrians. Using the learned pathways, they predict destinations, walking paths, and perform abnormal behavior detection by finding unexpected observations which are significantly different from the predictions. In [19], the velocity and the orientation of the usual motion are considered to create a time surface on image plane, where each node/pixel shows the time needed to reach the pixel if the person behaviour is usual. Using the orientation and velocity information, a modified version of fast marching method is used to estimate potential and velocity surfaces of the scene, respectively. They also introduced a metric that allows measuring a path’s "abnormality" by calculating the time log-likelihood distance between a point on the surface and the amount of time for a trajectory to arrive at this point.
In all previous methods, abnormal events related to global movement of people (e.g., following an unusual route) can be detected. However, local abnormal events related to finer motion (e.g., jumping over the payment gate) cannot be distinguished from the global movement of people.
B. Pixel-based Approaches
Adam et al. [8] proposed a method for unusual event detection using fixed spatial points and optical flow information. Although it is a pixel based approach, this work only detects unusual events based on speed and/or direction of pixel flow, without analyzing finer motion. Zhao et al. [13] proposed to detect unusual events in videos via dynamic sparse coding, using sliding windows, cuboids and bag of words (BoW). Inside the cuboids, the proposed approach uses both HOG and HOF to describe the motion and appearance, and it is able to detect wrong direction anomalies and abnormal actions in subway surveillance videos. However, it cannot make distinction among abnormal actions such as loitering, no payment, and so on. In [14], Han et al. proposed an adaptive dictionary learning approach for abnormal behavior detection, using MHOF for motion detection. Although this approach is able to correctly detect wrong direction motion in subway videos, since it relies only on the direction of MHOF features, it does not detect abnormal body movements that occur in the same direction of normal actions, such as jumping over the payment gate. Another drawback of this approach is that the user must manually define the zones.
Nallaivarothayan et al. [4] proposed an approach for abnormal event detection among pedestrians, considering HOF and optical flow acceleration. An abnormal event is the presence of abnormal objects among pedestrians (e.g. a car or a bike in a pedestrian area). They assume that the optical flow within the human body varies over time, and the acceleration within the human body varies significantly in direction, but with small magnitude. They assume that vehicles and bicycles tend to have high acceleration compared to pedestrians and the direction of their acceleration is predominantly uniform because of their rigid motion. In fact, this approach is not really to detect abnormal behaviors or abnormal events, but rather to detect moving objects that are not pedestrians. In [20], direction information is also extracted from optical flow points. Then, Dirichlet Processes are used to find re-occurring patterns and build a vocabulary of motifs. By measuring the number of occurrence of each motif, abnormal instants are detected. Since only direction information is used, this approach fails to distinguish among different types of abnormal events (e.g., objects moving fast/slow).
Zhou et al. [21], presents a descriptor of collectiveness for crowds by analyzing the collective manifolds in collective motions of crowds. Based on keypoints extracted by generalized KLT tracker, the authors study behavior consistency along paths on the collective manifolds and measure collectiveness in a bottom-up way: from behavior consistency in neighborhood of individuals to behavior consistency among all pairwise individuals along paths in the crowd. However, as the approach focuses only on the flow of the crowd, it may not detect abnormalities related to a single person, e.g., loitering.
Another recent approach for a specific type of abnormal behavior detection is proposed in [22]. The proposed approach is to detect sudden/quick motions in a video, corresponding to any action. The method uses HOF with dense trajectories [23], computed in a dense grid. Mean and standard deviation for displacement vector are calculated to both represent and model the motion in each cell of the spatial grid. Trajectories that do not fit the model are detected as sudden movements in the cells. A new video descriptor for violence detection in crowded scenes is presented by Mohammadi et al. [24]. Local and convective acceleration (force) of optical flow points are calculated using substantial derivative equation in fluid mechanics. Then, a standard BoW is followed for each force separately and the histograms are concatenated to form the video descriptor that represents the total force. This video descriptor can capture the spatial structure and temporal changes of the motion field in the case of abnormal event in a crowded scene. However, it may fail to detect the abnormal actions of individuals.
To the best of our knowledge, there are no studies in anomalous behavior detection in video analysis that consider both trajectory- and pixel-based features. Although Burghouts et al. [3] consider the trajectory of moving objects and color inside a bounding box as appearance feature, all the abnormal actions are pre-defined. Indeed, their approach was developed for complex event identification, and for the specific domain of threat detection for cargo trucks that are equipped with surveillance cameras, at parking lots.
III. Proposed Approach
In this paper, we introduce a new method for abnormal behavior detection in video sequences by fusing object trajectory analysis and pixel-based features that have proven to achieve state-of-the-art results for action recognition [23]. Our approach builds an integrated framework that can detect various types of abnormal events. Trajectory analysis provides not only the information on global motion of the person but also the bounding box of the person, allowing to perform finer motion analysis for each individual. Figure 1 shows the general overview of the proposed approach.
Fig. 1. The flow diagram of our fused approach that uses both trajectory and pixel-based features.
In general words the method works as follows: the input is the video sequence, from which the moving object trajectories are computed using object and group tracking algorithms (Section III-A). Then, the method performs a multi-resolution analysis to automatically extract the zones in different space granularities, and computes the speed and direction pattern within each zone (Section III-B). Before the pixel-based analysis, a filtering is performed to exclude abnormal trajectories that are already detected by the trajectory analysis (Section III-C). The next step, is the pixel-based analysis for the zones (Section III-D). This step takes as input each zone computed in the previous step and the bounding box of the tracked objects, and extracts action descriptors inside the bounding box of each object. With this step, we obtain the information about body movements of each detected moving object inside a zone. Finally, a clustering operation on each feature gathered from all mobiles (speed, direction, body movements) is applied to discriminate between different types of normal/abnormal behavior in the scene.
In the following sections, we explain each step of the process in detail.
A. Object and Group Tracking
As the first step of our approach, we take the input video and extract all trajectories in the scene. In this step, we run the object tracking algorithm [25] and group tracking algorithm [26] to generate all individual trajectories of objects/groups moving in the scene.
First, foreground objects are extracted using the Gaussian Mixture Model algorithm for background subtraction. Then, the object tracking algorithm computes the similarity between each detected pair of objects in a given temporal window (of a predefined size) using the following appearance descriptors: 2D and 3D displacement distance, 2D area and shape ratio, RGB color histogram, color covariance and dominant color. A temporal link is established between two detected objects when their similarity is greater than a predefined threshold. At the end of this stage, we obtain a weighted graph whose vertices are objects detected in the considered temporal window, and edges are the temporal established links with the object similarities. We consider all possible links in a temporal window so that if a mobile object cannot be detected in some frames, it can still be tracked. In order to decrease the algorithm complexity, for each object, the tracker looks for its matched candidate objects in a spatial neighborhood with a predefined radius. Successive links form several paths on which an object can undergo within this temporal window. Each possible path of an object is associated with a score given by all the scores of the links it contains. The object trajectory is determined by maximizing the path score.
Once we obtain the object trajectories, we apply the group tracking algorithm [26] to detect groups and create trajectories for moving groups in the scene. The group tracking algorithm takes the object trajectories as input and creates groups based on the criteria that a group is defined as two or more people who are spatially and temporally close to each other and have similar
direction and speed of movement.
Having extracted the object and group trajectories, the next step is the grid-based analysis, detailed in the following section.
B. Grid-Based Analysis
This step takes the extracted trajectories and bounding boxes of each object as input and performs grid-based analysis. In the grid-based analysis, three main steps are performed: trajectory snapping, zone discovery, and trajectory-based anomaly detection. Before we go into details of each step, we define two main concepts: point and trajectory.
Definition 1 (Point): A point 𝑝 is a tuple (𝑥, 𝑦, 𝑡), where 𝑥 and 𝑦 is the position in the image and 𝑡 is the time
instant in which the position is collected.
𝑝𝑘= (𝑥𝑘, 𝑦𝑘, 𝑡𝑘) (1)
A list of points ordered in time forms a trajectory.
Definition 2 (Trajectory): A trajectory 𝑇𝑖 is a tuple
(𝑡𝑖𝑑𝑖, {𝑝1, 𝐵𝑝1, 𝑝2, 𝐵𝑝2, ..., 𝑝𝐾, 𝐵𝑝𝐾}), where 𝑡𝑖𝑑𝑖 is the
tra-jectory identifier, 𝐵𝑝𝑘 is the bounding box of the object at
point 𝑝𝑘, and 𝑡1< 𝑡2< 𝑡3< . . . < 𝑡𝐾.
𝑇𝑖= (𝑡𝑖𝑑𝑖, {𝑝𝑘, 𝐵𝑝𝑘}𝑘=1:𝐾) (2)
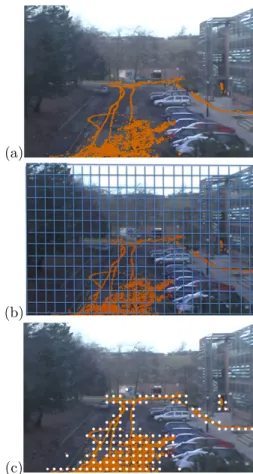
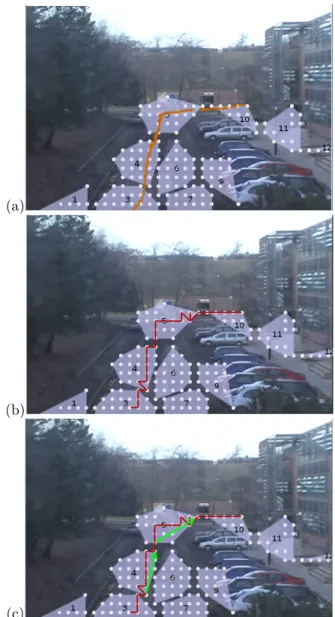
1) Trajectory Snapping: The snapping process is an important step and one of the contributions of the proposed approach. This step allows an abstract representation of the trajectories and use this representation to find regions of the scene that are related to activities. The process is detailed in Figure 2, showing the real trajectories (2(a)) of the objects tracked in one of the video set of Mind’s Eye [15].
The first step is to build a grid of chosen size over the video scene (Figure 2(b)). We choose the best size of the cell as the minimal bounding box of the trajectories, to avoid loosing information. The next step is to summarize all trajectory points to the grid centroids, where each trajectory point inside a cell is snapped (mapped) to the centroid of the cell, as shown in Figure 2(c).
Notice that once the trajectory points are snapped (the white points in Figure 2(c)), the number of trajectory points is dramatically reduced, and the trajectory path is simplified but preserved, called snapped trajectory. For each snapped trajectory, we store the sequence of snapped
points and the time of the first and the last point of the
trajectory inside each cell. Figure 4(a) shows an example of a real trajectory, which has initially 629 points, and Figure 4(b) shows the snapped trajectory, which has 28 snapped points.
A snapped point is a summary of all consecutive points of a trajectory inside a cell of the grid.
Definition 3 (Snapped Point): A snapped point 𝑠 is a
tuple (𝑐𝑖𝑑, 𝑥, 𝑦, 𝑚𝑖𝑛𝑡, 𝑚𝑎𝑥𝑡), where 𝑐𝑖𝑑 identifies the cell that 𝑠 belongs to, 𝑥 and 𝑦 are the position of the centroid of the cell 𝑐𝑖𝑑, and 𝑚𝑖𝑛𝑡 and 𝑚𝑎𝑥𝑡 are respectively the timestamps of the first and the last consecutive points of the trajectory 𝑇𝑖 inside cell 𝑐𝑖𝑑.
𝑠𝑙= (𝑐𝑖𝑑𝑙, 𝑥𝑙, 𝑦𝑙, 𝑚𝑖𝑛𝑡𝑙, 𝑚𝑎𝑥𝑡𝑙) (3)
Definition 4 (Snapped Trajectory): A snapped trajectory 𝑆𝑖 of 𝑇𝑖 is a sequence of snapped points {𝑠1, 𝑠2, ..., 𝑠𝐿}.
𝑆𝑖 = {𝑠𝑙}𝑙=1:𝐿 (4)
Having defined the snapped point of a cell and a snapped trajectory, we also define a set of information that is computed for each cell of the grid. For each cell, we store the 𝑥 and 𝑦 of the centroid of the cell, the total amount of trajectory points mapped to the centroid, and the average speed of all points in the cell. Since the information of each cell is computed individually, this representation preserves the motion differences between cells near the camera and far from the camera. More formally, a grid
cell summary is given as follows:
Definition 5 (Cell Summary): A cell summary 𝐶𝑗 is a
tuple (𝑥, 𝑦, 𝑎𝑣𝑔𝑆, 𝑞𝑡𝑑𝑒) where 𝑥, 𝑦 is the centroid of the
(a)
(b)
(c)
Fig. 2. Example of (a) Trajectories, (b) Trajectories over the grid, (c) Snapped Trajectories.
cell, 𝑎𝑣𝑔𝑆 is the average speed inside this cell and 𝑞𝑡𝑑𝑒 is the number of trajectory points inside the cell.
𝐶𝑗= (𝑥𝑗, 𝑦𝑗, 𝑎𝑣𝑔𝑆𝑗, 𝑞𝑡𝑑𝑒𝑗) (5)
After mapping the trajectory points to the grid, the next step is to discover the zones, as explained in the following section.
2) Zone Discovery: Automatic zone discovery is one of
the contributions of this paper. In this process, we aim to find regions in the scene that represent distinct motion (e.g., a zone where people move fast). To discover such zones, we employ clustering on the grid cell summaries. As we perform global and finer motion analysis exploiting the discovered zones, clustering cell information has a crucial role in our approach. It is a challenging problem that requires to use a clustering algorithm that fits well with the problem. For instance, the result of clustering algorithms that require to set either the number of clusters or a bandwidth threshold (e.g., 𝐾-means), will require the optimization of such parameters. Thus, to cluster grid cell summaries, we have chosen the affinity propagation algorithm [27], that uses a similarity matrix for measuring the similarity among data without requiring to set the number of clusters, unlike many clustering algorithms. Among the cell summary information, we use both density and speed features (𝑎𝑣𝑔𝑆, 𝑞𝑡𝑑𝑒).
˜
𝐶𝑗= (𝑎𝑣𝑔𝑆𝑗, 𝑞𝑡𝑑𝑒𝑗) (6)
Using the density feature, the zones where people stand still can be distinguished from the zones where people/ob-jects move, and the speed features enable the distinction between zones where people/objects move fast and slow. To measure the similarity among cells, we use the following distance metric: 𝐷( ˜𝐶𝑗1, ˜𝐶𝑗2) = (𝑎𝑣𝑔𝑆𝑗1− 𝑎𝑣𝑔𝑆𝑗2) 2 + (𝑞𝑡𝑑𝑒𝑗1− 𝑞𝑡𝑑𝑒𝑗2) 2 (7) After we normalize the calculated distances among cells, as suggested in [27], we define the similarity measure between
˜
𝐶𝑗1 and ˜𝐶𝑗2 as follows:
𝑆𝑖𝑚(𝑗1, 𝑗2) = −𝐷( ˜𝐶𝑗1, ˜𝐶𝑗2) (8)
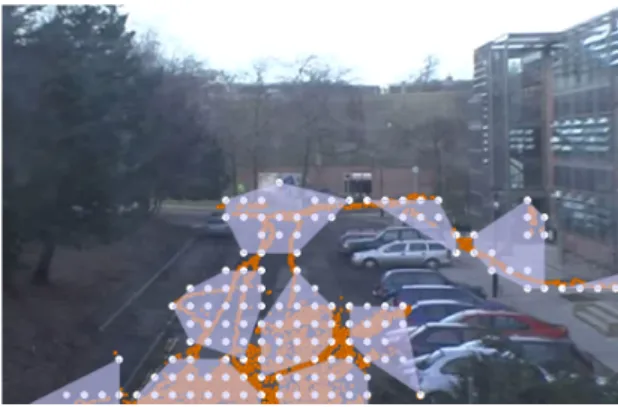
An example of zones discovered using the affinity propagation algorithm for a Mind’s Eye video is shown in Figure 3.
Each discovered zone is represented as follows:
Definition 6 (Zone): A zone 𝑧 is a tuple (𝑅, 𝑆, 𝑆𝑠𝑝𝑒𝑒𝑑, 𝑆𝑑𝑖𝑟𝑒𝑐𝑡𝑖𝑜𝑛), where 𝑅 is a polygon topologically closed representing the geometry of the zone, 𝑆 is the set of snapped trajectories inside the zone,
𝑆𝑠𝑝𝑒𝑒𝑑 and 𝑆𝑑𝑖𝑟𝑒𝑐𝑡𝑖𝑜𝑛 are, respectively, the sets of speed
and direction calculated for each snapped trajectory in 𝑆.
𝑧𝑛= (𝑅𝑛, {𝑆𝑛}, 𝑆𝑠𝑝𝑒𝑒𝑑𝑛, 𝑆𝑑𝑖𝑟𝑒𝑐𝑡𝑖𝑜𝑛𝑛) (9)
Fig. 3. Discovered zones: The zones close to the camera represent regions where people/objects stand still, whereas the zones far to the camera represent regions where people/objects move.
The speed of each trajectory is obtained from all snapped points of the trajectory inside the zone. More formally
Definition 7 (Snapped Trajectory Speed): Let {𝑆𝑛} =
{𝑠1, 𝑠2, ...𝑠𝑁} be a snapped trajectory of 𝑇𝑖 inside a zone.
The snapped trajectory speed inside zone 𝑧𝑛 is given as
𝑆𝑠𝑝𝑒𝑒𝑑𝑛= 𝑁 −1 ∑︀ 𝑖=1 √︀(𝑥𝑖+1− 𝑥𝑖)2+ (𝑦𝑖+1− 𝑦𝑖)2 𝑚𝑎𝑥𝑡𝑁 − 𝑚𝑖𝑛𝑡1 (10)
Similarly, we compute the direction of each snapped trajectory inside the zone, taking the overall direction between the snapped points where the trajectory enters the zone and leaves the zone. Figure 4(a) shows an example of the trajectory of one object. This trajectory passes through zones 3, 4, 5, and 10. In Figure 4(b) we can see this trajectory snapped, where the red line connects the snapped points of this trajectory. Figure 4(c) shows how we compute the direction of the snapped trajectory inside each zone, highlighting the direction with a green arrow in zones 4 and 5.
The direction of each snapped trajectory inside a zone is mapped to one of the 4 cardinal points: {𝑁 𝑜𝑟𝑡ℎ(𝑁 ),
𝑆𝑜𝑢𝑡ℎ(𝑆), 𝐸𝑎𝑠𝑡(𝐸), 𝑊 𝑒𝑠𝑡(𝑊 )}. As a result, we obtain
the frequency histogram for the direction inside the zone.
3) Trajectory-based Anomaly Detection: As we have
mentioned earlier, the discovered zones in the scene represent regions where a distinctive motion (e.g., a zone where people move fast) occurred. After having discovered the zones, the snapped trajectories inside each zone are analyzed in order to detect trajectories with abnormal speed or direction.
We have analyzed 𝑆𝑠𝑝𝑒𝑒𝑑𝑛 inside each zone using
Q-Q plot, and observed that the speed of normal trajectories follow a Gaussian distribution. Therefore, we represent the distribution of speed inside a zone as a Gaussian, i.e. 𝒩 (𝜇𝑛, 𝜎𝑛), where 𝜇𝑛 is the average
speed of the zone and 𝜎𝑛 is the standard deviation of
speed inside the zone. In complex scenarios, where the speed of normal trajectories is variable (e.g., kids and old people walking in a park), a more sophisticated approach, such as Mixture of Gaussians, non-parametric models or codebooks could be used to present the speed distribution. In order to detect abnormal trajectories, we compare the average speed of each trajectory inside the zone with various confidence intervals and check it fits in the speed distribution.
Definition 8 (Abnormal Trajectory Speed): Let 𝑆𝑠𝑝𝑒𝑒𝑑𝑧𝑛
be the speed of a snapped trajectory 𝑆𝑛 of 𝑇𝑖 inside a
zone 𝑧𝑛. This speed is considered abnormal if it is inside a
confidence interval: (𝑆𝑠𝑝𝑒𝑒𝑑𝑧𝑛> 𝜇𝑛+𝛼*𝜎𝑛)∨(𝑆𝑠𝑝𝑒𝑒𝑑𝑧𝑛<
𝜇𝑛− 𝛼 * 𝜎𝑛), where 𝛼 is the coefficient of sensitivity.
In most datasets of abnormal behavior, the abnormality related to direction is specified as "wrong direction" assuming that there is a main direction, and the direction opposite to this is abnormal. Following this definition, we find the main direction inside each zone and detect as abnormal trajectories that move in the opposite direction. We generate the sample distribution of direction inside a
zone, using the set of direction computed for each snapped
trajectory inside the zone (𝑆𝑑𝑖𝑟𝑒𝑐𝑡𝑖𝑜𝑛𝑛). The first step
to detect a trajectory with abnormal direction inside a zone is to analyze if there is a uniform distribution of direction inside the zone. Using the Pearson’s chi-squared test, we check if the sample distribution follows a uniform distribution. 𝜒2= 𝐵 ∑︁ 𝑏=1 (𝑂𝑏− 𝐸𝑏) 𝐸𝑏 2 (11) where 𝑂𝑏 is the observed frequency for bin 𝑏 and 𝐸𝑏 is
the expected frequency of the uniform distribution for bin
𝑏. If the test fails, we find the main direction inside the
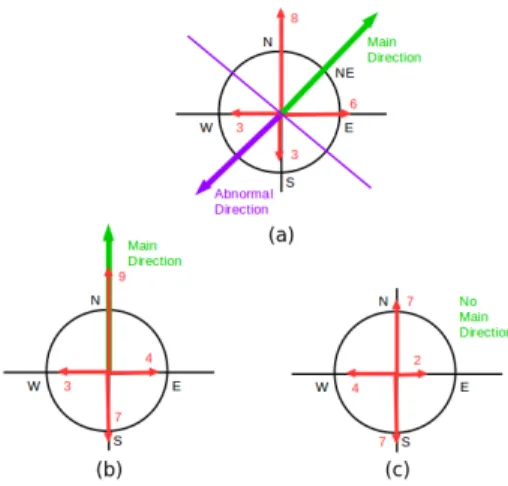
zone. Depending on the distribution, the peak point of the direction may not always provide the main direction inside the zone. Thus, we follow a finer approach by taking into account the two most probable directions. For the two most probable directions, according to their value and direction, we have three cases, as presented in Figure 5: i) they are not opposite to each other, ii) they are opposite to each other but one of them has a higher probability, iii) they are opposite to each other with equal probability. For the first case, as both directions are significantly important, we exploit both of them and define the direction between the two most probable direction as the main direction (Figure 5(a)). The second and third cases are the most difficult as the two most probable directions are opposite to each other. Thus, in the second case, we take the most probable direction as the main direction knowing that the second most probable direction can be false alarms (Figure 5(b)). In the third case, as there is no main direction, we do
not perform abnormal trajectory detection via direction (Figure 5(c)). Similarly, if the Pearson’s chi-squared test suggests that the sample distribution of direction follows a uniform distribution and there is no dominant direction, we cannot perform direction-based abnormal trajectory detection.
(a)
(b)
(c)
Fig. 4. Example of (a) Single Trajectory passing the zones (orange line), (b) Snapped Trajectory (red line), (c) Example of direction computation for the Snapped Trajectory in zones 4 and 5 (green arrows).
Definition 9 (Abnormal Trajectory Direction): Let 𝑆𝑑𝑖𝑟𝑒𝑐𝑡𝑖𝑜𝑛𝑛 be the direction of a snapped trajectory 𝑆𝑛 of
𝑇𝑖 inside a zone 𝑧𝑛. This direction is considered abnormal
if it is opposite to the main direction of the zone 𝑧𝑛 (𝐷𝑧𝑛):
(𝑆𝑑𝑖𝑟𝑒𝑐𝑡𝑖𝑜𝑛𝑛> 𝐷𝑧𝑛+ 90
𝑜) ∨ (𝑆𝑑𝑖𝑟𝑒𝑐𝑡𝑖𝑜𝑛
𝑛< 𝐷𝑧𝑛− 90
𝑜).
Having detected the abnormalities for speed and direction, the next step is to compute the action descriptors of each trajectory, and detecting normal and abnormal activities inside each zone.
Fig. 5. The three cases of calculating the main direction inside a zone using the two most probable directions: (a) they are not opposite to each other, (b) they are opposite to each other but one of them has a higher probability, (c) they are opposite to each other with equal probability.
C. Trajectory Filtering
Another contribution of our approach is the combination of trajectory analysis and pixel-based analysis in a pipeline chain (i.e., incorporating the output of object trajectory analysis with pixel-based analysis) that enables to compensate drawbacks of each part. As we have described above, the first part of our approach performs trajectory analysis and detects abnormal events based on speed and direction features. On the other hand, in the pixel-based analysis, detecting these types of abnormal events is not easy as the noise in optical flow will be accumulated while analyzing global motion of a person. Thus, before the pixel-based analysis, we remove the abnormal trajectories that were already detected during the trajectory analysis.
The drawback of trajectory analysis is that more complicated abnormal behaviors, such as jumping over payment gates, are still considered as normal since speed and/or direction are not discriminative features for this type of abnormal events (e.g., a person jumping over payment gate follows a route similar to normal trajectories). The pixel-based analysis provides finer motion features that can distinguish abnormal trajectories that follow similar speed and direction patterns with normal trajectories. Thus, we exploit the output of the trajectory analysis that is considered as normal and extract main pathways in the scene using the zone and direction information. Then, the main pathways are used to take all trajectories that fit in the main pathways. At the end, the input to the next step of pixel-based analysis contains only the trajectories that share the similar speed and direction patterns with normal trajectories.
In addition, noisy trajectories that are present because of failures in object detection and tracking (e.g., short in time, stays in the same place for a long time) are filtered
out.
D. Abnormal Behavior Detection using Actions Descrip-tors
In this section, we explain the second part of our approach that detects finer abnormal behaviors in videos using dense trajectory-based action descriptors. By incorporating tracking information with learned zones, we apply spatio-temporal filtering on action descriptors. Thus, we can process each object in the scene individually and achieve precise abnormal behavior detection.
1) Extracting Dense Trajectories: Extracting
space-time interest points is one of the well-known techniques in video-based action recognition [28]. An extension of this approach proposes dense trajectories that find dense optical flow trajectories [23].
Following the approach of [23], we first extract dense tracklets via densely sampling feature points on a grid spaced by 5 pixels, and computing optical flow on the feature points. Then, within a space-time volume aligned with each tracklet, we extract image descriptors. The size of the volume is 32x32 pixels and 15 frame long. We divide the volume into a spatio-temporal grid of size 2x2x3 and, for each grid cell; we compute appearance and motion descriptors using HOG, HOF, MBHx, and MBHy. We have used the appearance and motion descriptors to represent local motion of objects in the scene.
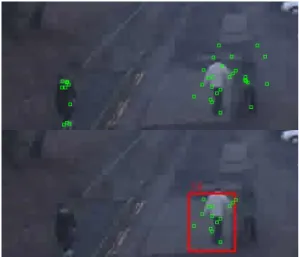
2) Spatio-Temporal Filtering: One of the main disadvantages of using dense trajectories is the assumption that there is only one person in the scene, and videos are manually clipped for each action individually [23]. As explained above, by using dense trajectories, we obtain appearance and motion descriptors calculated over the whole image. However, if there is more than one object in the scene, the descriptors would include the features of all people together and, thus, the descriptors would not be discriminative and they could be misleading (Figure 6(top)). In order to obtain a precise individual representation for each object in the scene, we propose to perform spatial filtering on extracted dense trajectories and take only the descriptors that belong to the object of interest.
Thanks to the unified framework of our approach, the region of interest for each individual can be obtained from the global trajectories. By using the bounding box information from the object tracker, we can define a region of interest for the dense trajectories specified to each object in the scene. For each object in the scene, we perform spatial filtering by taking the descriptors that are obtained from the dense trajectories inside the bounding box of the object (Figure 6(bottom)). Since the appearance and motion descriptors are extracted over a
Fig. 6. Dense tracklets extracted (top): from the whole frame includes the motion from all moving objects in the scene, (bottom): from the bounding box of the tracked object that contains only the motion related to the object of interest.
spatio-temporal volume (𝑥, 𝑦, 𝑡) that collects bounding boxes in a temporal window of 15 frames, if there is an error in bounding box detection, it will not affect the calculated action descriptors significantly, as the action descriptors already include information from the past. In order to obtain a set of descriptors for each action of an object, an automatic clipping is required to find the start/end frames of each action. The zones learned by grid-based analysis (Section III-B) provides the information about the place where an important action is performed. By using the zone information, we can estimate when an object starts and ends an action. For each object in the scene, we record the start/end frames when they enter and exit the zone, and take only the descriptors between these frames. By performing this procedure for each learned zone, we achieve spatio-temporal filtering on dense trajectories and obtain a set of descriptors, that are precise and discriminative, representing the action of a particular object in a particular zone of the scene.
3) Bag-of-words Representation: For each computed
descriptor, we apply the standard bag-of-words (BoW) approach to obtain a better representation of the action [28]. We construct a codebook for each descriptor (HOG, HOF, MBH). To find the codebook, we cluster the features using the K -means algorithm. Descriptors are assigned to their closest vocabulary word using the Euclidean distance. The resulting histograms of visual word occurrences are used as action descriptors.
Since the zones discovered in grid-based analysis represent where an important action is performed, the action descriptors are assumed to represent one type of action of a particular object in a particular zone of the scene (e.g., a person walking on pavement zone)
4) Abnormal Behavior Detection via Clustering:
By using an SVM model learned in a supervised way, the BoW representation of action descriptors is proven to achieve the best accuracy for video-based action recognition [23]. However, in this paper, we are interested in automatic abnormal behavior detection without using a training set. Hence, rather than supervised learning, we focus on unsupervised learning of normal and abnormal behavior models. Therefore, we apply clustering on computed BoW representation of action descriptors. The description of normal behavior is highly dependent on the application. According to the application, normal behavior may consist of one type of action (e.g., passing over the turnstile in subway videos) or many types of actions (e.g., standing, walking, running in surveillance videos). For this reason, clustering algorithms that require the number of clusters do not fit well with this problem. Therefore, we use the affinity propagation clustering algorithm [27]. We define a similarity matrix by calculating the pairwise distance between BoW histograms of each action instance(𝐻𝑚). Several distance
metrics have been proposed to achieve better histograms discrimination, among which we have used Bhattacharyya, Chi-square, and Euclidean distances:
𝐷𝐵ℎ𝑎𝑡𝐻 (𝐻1, 𝐻2) =∑︁ 𝑏 √︀ 𝐻1(𝑏) · 𝐻2(𝑏) (12) 𝐷𝐻𝐶ℎ𝑖(𝐻1, 𝐻2) =1 2 ∑︁ 𝑏 (𝐻1(𝑏) − 𝐻2(𝑏))2 𝐻1(𝑏) + 𝐻2(𝑏) (13) 𝐷𝐸𝑢𝑐𝐻 (𝐻1, 𝐻2) = ∑︁ 𝑏 √︀ (𝐻1(𝑏) − 𝐻2(𝑏))2 (14) Euclidean distance (𝐷𝐸𝑢𝑐 𝐻 (𝐻1, 𝐻2)) is empirically selected
to measure the similarity among histograms. After nor-malizing the calculated distances among histograms, we define the similarity between 𝐻1and 𝐻2 as follows:
𝑆𝑖𝑚(𝐻1, 𝐻2) = −𝐷𝐸𝑢𝑐𝐻 (𝐻1, 𝐻2) (15) Using the similarity matrix above, the affinity propagation algorithm is employed to cluster fine motion of each individual.
IV. Experiments
We evaluate the proposed approach on three different types of datasets, Mind’s Eye [15] and Subway [8], that are two public datasets, and Vanaheim1, which is a dataset from a European Commission funded project. These three datasets contain various types of abnormalities with dif-ferent levels of complexity. Hence, we test the performance of our framework under different abnormality scenarios.
A. Vanaheim Dataset
This dataset consists of two videos recorded in Paris underground metro stations. The videos contain people passing turnstiles while entering/exiting stations. Several abnormal events have been manually annotated: event-1: one person is loitering/stopping; event-2: three people are stopping; event-3: one person jumps over turnstiles and runs in the opposite direction of people flow; event-4: one person is stopping. Each video has an approximate length of 10 minutes.
Figure 7 shows the abnormalities detected by our approach. In Table I, we show the quantitative results of our approach and the approach of [29], which uses density-based clustering in order to find stops and moves of trajectories. As can be seen, our approach detects all abnormal events in this dataset, while having five false alarms. Using the speed feature of trajectories, we can easily cluster people who either stop or walk with very low speed compared to the general flow of people. Similarly, the direction feature of trajectories enables the detection of people going in the opposite direction. However, our approach detects five false alarms related to a noisy trajectory, and miscalculated speed because of object detection and tracking failure. On the other hand, the approach in [29] fails to detect three people stopping and wrong direction events. In addition, it can only detect two events of loitering and stopping.
TABLE I
Comparison for Vanaheim dataset, where LT/ST: Loitering/Stopping, ST: Stopping, WD:Wrong Direction,
FA:False Alarm
LT/ST ST WD FA
Ground Truth 7 1 1
-Palma A.T. et al. [29] 2 - - 1 Proposed Approach 7 1 1 5
B. Subway Dataset
We have also tested our algorithm on Subway dataset [8], which is a well-known public dataset for abnormal event detection. The dataset contains over 2 hours of surveillance videos recorded from a subway station. It consists of two videos: one monitors the entrance gate and the other monitors the exit gates. In both videos, there are up to 10 people moving in the scene at the same time. The videos are provided by the courtesy of Adam et al. [8]. This dataset has two different ground truth, one annotated by Adam et al. [8] that only specifies wrong direction as abnormal events, and a second one proposed by Kim et al. [30], that also marks loitering and no payment events in addition to the annotation of Adam et al. [8]. In this paper, as it specifies all abnormal events in detail, we have followed the ground-truth proposed by Kim et al. [30]. Quantitatively, we have compared the abnormal event detection results of our approach against the state-of-the-art methods in [8], [13], [14], [30], [31].
Fig. 7. The results of our trajectory-based approach on Vanaheim dataset. Our approach can detect (a) one person stopping, (b) one person is loitering/stopping, (c) three people are stopping, and (d) one person jumps over turnstiles and runs in the opposite direction of people flow.
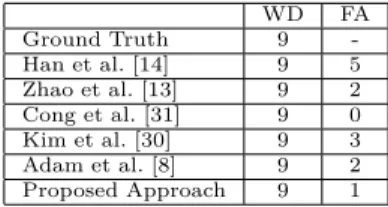
Subway-exit video shows people getting off the train, walking up the stairs and passing the exit gates. This video contains one type of abnormal event: people walking down the stairs (wrong direction:WD). Table II presents the results of our approach and the state-of-the-art methods. It can be seen that, thanks to the trajectory-based analysis, our approach detects all wrong direction events in the video with only 1 false alarm. Because of an ID switch problem in tracking, the direction of a normal trajectory is miscalculated and detected as a wrong direction event. Even though all of the state-of-the-art approaches capture all WD events, our method obtains less number of false alarms.
By detecting all WD events without any false alarm, only the approach in [31] works better than ours. However, in order to learn the atoms of the dictionary (i.e. basis functions of normal activities), the method in [31] requires first 10 minutes of the video with only normal events. However, this is a certain limitation in many aspects. Since there is no guarantee that a portion of the video only contains normal events, especially for cases when there are both abnormal events and normal events in the
training set, the models of [31] will consider the abnormal events as normal. In addition, the learning is limited with the normal trajectories that are present in the first 10 minutes, what makes the training step the main drawback of this type of approach. If there are other types of normal trajectories that appear in different parts of the video, the algorithm cannot learn these normal instances and it may detect these normal trajectories as abnormal events. On the other hand, since our approach establishes an unsupervised learning framework, it can automatically learn, starting at any time in a video.
TABLE II
Comparison for Subway-exit dataset, where WD:Wrong Direction, FA:False Alarm
WD FA Ground Truth 9 -Han et al. [14] 9 5 Zhao et al. [13] 9 2 Cong et al. [31] 9 0 Kim et al. [30] 9 3 Adam et al. [8] 9 2 Proposed Approach 9 1
The subway-entrance video contains people walking down the stairs, passing the entrance gate and getting on the train. There are 3 types of abnormality in this video: i) people walking up the stairs (WD), ii) loitering near the entrance gate (LT), iii) passing the gates without paying (no payment:NP). WD and LT events are detected mostly by using direction and speed features of trajectories. No Payment event includes different actions such as jumping over the gates, and sliding through the gates. As NP events are more complex than WD and LT events, direction and speed features are not discriminative enough. Instead, action descriptors are efficient to represent the body motion of people and distinguish NP events. After WD and LT events are detected, pixel-based analysis is performed on the remaining trajectories based on action descriptors. Clustering is performed on the action descriptors to detect NP events.
Since the quality of this video is very low and the bottom parts of the body of people are occluded while passing the gates, in some cases the object detection and tracking algorithms fail, and we obtain noisy trajectories because of ID switch, bad detection, and ghost person tracking problems. By considering the main pathways of people, the filtering step (Section III-C) helps to remove the noisy trajectories. In Figure 8, we present the learned zones for the subway-entrance video. For instance, based on our trajectory-based analysis, we have found that passing zones 8-5-2 is one of the main pathways. If there is a trajectory that does not follow this path, it is removed by the filtering step. The action descriptor-based approach (Section III-D) is performed following the filtering step.
Table III shows the abnormality detection results of
all approaches. Since the results for detecting LT and/or NP events for the approaches in [8], [14], [31] are not available (NA), they are not reported in the table. As the results show, thanks to the trajectory-based analysis, our approach detects all WD and LT events. After filtering the noisy trajectories (Section III-C) and applying the spatio-temporal filtering of action descriptors (Section III-D2), the pixel-based analysis detects 6 NP events out of 13.
For our approach, one of the reasons of missing NP events is the occlusion of lower body parts of people. Since the motion of legs helps to discriminate the motion between normal trajectory and NP trajectory (e.g., jumping over gates), the action descriptors extracted from the trajectory volume are not discriminative enough when the lower body parts of people are only partially visible. Thus, NP trajectories are mixed with normal trajectories. Another reason of missing NP events are the errors in detection and tracking. For some NP trajectories, detection and tracking cannot be achieved properly, and we obtain very short trajectories that are treated as noise, thereby eliminated.
Compared to state-of-the-art approaches, considering all types of abnormality, our approach works better than all approaches except the methods in [13]. Our method is better than the work of [30], because it correctly detects 45 and we detect 46. [30] has 6 false alarm and we have 4. Although, the methods in [13] and [30] detect more NP events than our approach, they have more false alarms. In addition, in order to find the basis functions of normal activities in the dictionary, the method in [13] requires the first 5 minutes of the video with only normal events. As discussed earlier, using a fixed part of the video limits the quality of the learned models. On the other hand, our approach can automatically learn, starting at any time in a video.
Among 4 false alarms, we get 3 false alarms for loitering event and 1 false alarm for no payment. The 3 false alarms for loitering are 3 people that pass the gates very slowly. Although they normally pass the gates, since they move very slowly, they are detected as people loitering in the scene. The false alarm for no payment is a person who tries 2 gates to pass. As this action is different from people passing through one gate, it is detected as an abnormal event, that in fact, is not a normal action.
Considering the results of both entrance and exit videos, we can see that, among the state-of-the-art approaches, there is no single approach that works for both videos. On the other hand, in total, our approach detects 55 out of 62 abnormal events in both videos, achieving less number of false alarms.
Fig. 8. The learned zones for Subway-entrance dataset. Our approach can efficiently learn zones of stairs (zone #8), turnstiles (zone #5) and the platform (zone #2) and the main pathway passing zones 8-5-2.
TABLE III
Comparison for Subway-entrance dataset, where WD:Wrong Direction, LT:Loitering, NP:No Payment, ALL:All
Abnormals, FA:False Alarm, NA:Not Available
WD LT NP ALL FA Ground Truth 26 14 13 53 -Han et al. [14] 22 NA 2 24 9 Zhao et al. [13] 25 14 9 48 5 Cong et al. [31] 21 NA 6 27 4 Kim et al. [30] 24 13 8 45 6 Adam et al. [8] 17 NA NA 17 4 Proposed Approach 26 14 6 46 4
C. Mind’s Eye Dataset
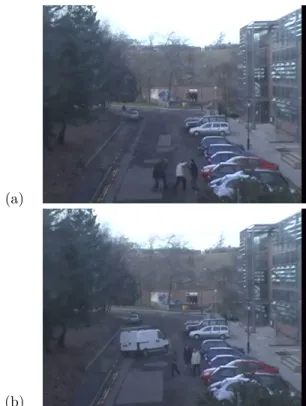
Mind’s Eye [15] dataset is recorded in the parking lot of a University campus for anomaly detection. In this dataset, we have specifically selected two videos that contain group activities. Videos include people walking around the parking lot in groups. There are two types of abnormality: i) people fighting (FT), ii) cars (CR) coming to/going out of the parking lot. Sample images for FT and CR events are displayed in Figure 9.
Again due to the object detection and tracking failures, we obtain trajectories that correspond to noise (e.g. ghost person detection stays in the same place for a long time). As the first part of our approach performs analysis on speed, we detect these noisy trajectories and remove them in the filtering step. Next, action descriptors are extracted for the remaining objects and clustering is performed to detect FT and CR events.
In Table IV, we show the results of our approach. To the best of our knowledge, none of the existing approaches have published results for this public dataset. It can be seen that our approach detects all FT events in the video. It misses only one CR event and obtains 3 false alarms. The reason of missing a CR event is the ID switch problem in tracking. While tracking the car, because of a problem in detection, the id switches to pedestrians walking by the car. Therefore, this trajectory is detected as normal (people walking). In some fighting events,
(a)
(b)
Fig. 9. Sample images from Mind’s Eye dataset for (a) fighting (FR) and (b) cars (CR) coming to/going out of the parking lot.
after or before fighting starts, people (group) stand or walk normally. Thus, while clustering action descriptors, some of the normal walking or standing events are found as being similar to these fighting events. As a result, 3 normal trajectories with some significant motion are detected as abnormal events.
It is worth mentioning that, to the best of our knowledge, our work is the first one that, based on dense tracklets, is able to detect abnormal behaviors on both individuals and groups moving in the scene. This is possible thanks to the trajectory extraction step that provides the bounding box of each individual and each group in the scene.
TABLE IV
Comparison for Mind’s Eye dataset, where FT:Fighting, CR:Car, FA:False Alarm
FT CR FA
Ground Truth 9 7
-Proposed Approach 9 6 3
V. Conclusion and Future Works
This paper presents a framework for abnormal event detection and group behavior analysis in video surveillance. We propose a fully unsupervised method that uses not only basic trajectory features (such as speed and duration), but also fine motion features to represent body movements. Therefore, compared to the existing trajectory-based and pixel-based approaches, our method detects different types of abnormality, from basic to complex events. Indeed, to the best of our knowledge,
our work is the first one that, based on dense tracklets, is able to detect abnormal behaviors on both individuals and groups moving in the scene. This is possible thanks to the trajectory extraction step that provides the bounding box of each individual and each group in the scene. We have tested our approach with three datasets that include different types of abnormality. Experimental results show that our approach is able to detect all kinds of abnormal events, including wrong direction, loitering, stopping, no payment in metro/subway videos, fighting and car moving in parking lot videos. Although there are some missed events, our approach is able to detect all types of abnormal events with very low number of false alarms when compared to existing approaches.
Since our approach is based on unsupervised learning, an interesting direction for future work is the performance analysis of our approach in an online setting, learning "on-the-fly" and running in real-time.
References
[1] O. Popoola and K. Wang, “Video-based abnormal human be-havior recognition -a review,” Systems, Man, and
Cybernet-ics, Part C: Applications and Reviews, IEEE Transactions on,
vol. 42, no. 6, pp. 865–878, Nov 2012.
[2] T. Li, H. Chang, M. Wang, B. Ni, R. Hong, and S. Yan, “Crowded scene analysis: A survey,” IEEE Transactions on
Circuits and Systems for Video Technology, vol. 25, no. 3, pp.
367–386, March 2015.
[3] G. J. Burghouts, V. P. Slingerland, H. ten R.J.M, H. den R.J.M, and K. Schutte, “Complex threat detection: Learning vs. rules, using a hierarchy of features,” in 11th IEEE International
Conference on Advanced Video and Signal Based Surveillance.
IEEE, 2014, pp. 375–380.
[4] H. Nallaivarothayan, C. Fookes, S. Denman, and S. Sridharan, “An mrf based abnormal event detection approach using motion and appearance features,” in 11th IEEE International
Confer-ence on Advanced Video and Signal Based Surveillance. IEEE,
2014, pp. 343–348.
[5] C. Piciarelli and G. L. Foresti, “On-line trajectory clustering for anomalous events detection,” Pattern Recognition Letters, vol. 27, no. 15, pp. 1835–1842, 2006. [Online]. Available: http://dx.doi.org/10.1016/j.patrec.2006.02.004
[6] C. Piciarelli, C. Micheloni, and G. L. Foresti, “Trajectory-based anomalous event detection,” IEEE Trans. Circuits Syst. Video
Techn., vol. 18, no. 11, pp. 1544–1554, 2008. [Online]. Available:
http://dx.doi.org/10.1109/TCSVT.2008.2005599
[7] B. Antic and B. Ommer, “Video parsing for abnormality detection,” in IEEE International Conference on Computer
Vision, ICCV 2011, 2011, pp. 2415–2422. [Online]. Available:
http://dx.doi.org/10.1109/ICCV.2011.6126525
[8] A. Adam, E. Rivlin, I. Shimshoni, and D. Reinitz, “Robust real-time unusual event detection using multiple fixed-location mon-itors,” IEEE Transactions on Pattern Analysis and Machine
Intelligence, vol. 30, no. 3, pp. 555–560, March 2008.
[9] K. Ouivirach, S. Gharti, and M. N. Dailey, “Incremental behavior modeling and suspicious activity detection,” Pattern
Recognition, vol. 46, no. 3, pp. 671 – 680, 2013. [Online]. Available: http://www.sciencedirect.com/science/ article/pii/S0031320312004426
[10] Y. Benezeth, P.-M. Jodoin, and V. Saligrama, “Abnormality detection using low-level co-occurring events,” Pattern Recognition Letters, vol. 32, no. 3, pp. 423 – 431, 2011.
[Online]. Available: http://www.sciencedirect.com/science/ article/pii/S0167865510003545
[11] M. Roshtkhari and M. Levine, “Online dominant and anomalous behavior detection in videos,” in Computer Vision and Pattern
Recognition (CVPR), 2013 IEEE Conference on, June 2013, pp.
2611–2618.
[12] V. Mahadevan, W. Li, V. Bhalodia, and N. Vasconcelos, “Anomaly detection in crowded scenes,” in IEEE Conference
on Computer Vision and Pattern Recognition (CVPR), June
2010, pp. 1975–1981.
[13] B. Zhao, L. Fei-Fei, and E. Xing, “Online detection of unusual events in videos via dynamic sparse coding,” in Computer Vision
and Pattern Recognition (CVPR), 2011 IEEE Conference on,
June 2011, pp. 3313–3320.
[14] S. Han, R. Fu, S. Wang, and X. Wu, “Online adaptive dictionary learning and weighted sparse coding for abnormality detection,” in 20th IEEE International Conference on Image Processing
(ICIP), Sept 2013, pp. 151–155.
[15] [Online]. Available: http://www.visint.org/
[16] J. Varadarajan, R. Emonet, and J.-M. Odobez, “A sequential topic model for mining recurrent activities from long term video logs,” International Journal of Computer Vision, vol. 103, no. 1, pp. 100–126, May 2013.
[17] L. Patino, J. Ferryman, and C. Beleznai, “Abnormal behaviour detection on queue analysis from stereo cameras,” in Advanced
Video and Signal Based Surveillance (AVSS), 2015 12th IEEE International Conference on, Aug 2015, pp. 1–6.
[18] S. Yi, H. Li, and X. Wang, “Understanding pedestrian behaviors from stationary crowd groups,” in Computer Vision and Pattern
Recognition (CVPR), 2015 IEEE Conference on. IEEE, 2015. [19] B. Cancela, A. Iglesias, M. Ortega, and M. Penedo, “Unsu-pervised trajectory modelling using temporal information via minimal paths,” in Computer Vision and Pattern Recognition
(CVPR), 2014 IEEE Conference on, June 2014, pp. 2553–2560.
[20] R. Emonet, J. Varadarajan, and J.-M. Odobez, “Temporal analysis of motif mixtures using dirichlet processes,” IEEE
Transactions on Pattern Analysis and Machine Intelligence,
vol. 36, no. 1, pp. 140–156, Jan 2014.
[21] B. Zhou, X. Tang, H. Zhang, and X. Wang, “Measuring crowd collectiveness,” Pattern Analysis and Machine Intelligence,
IEEE Transactions on, vol. 36, no. 8, pp. 1586–1599, Aug 2014.
[22] S. Zaidenberg, P. Bilinski, and F. Brémond, “Towards unsuper-vised sudden group movement discovery for video surveillance,” in VISAPP 2014 - Proceedings of the 9th International
Confer-ence on Computer Vision Theory and Applications, 2014, pp.
388–395.
[23] H. Wang, A. Klaser, C. Schmid, and C.-L. Liu, “Action recog-nition by dense trajectories,” in Computer Vision and Pattern
Recognition (CVPR), 2011 IEEE Conference on, June 2011, pp.
3169–3176.
[24] S. Mohammadi, H. Kiani, A. Perina, and V. Murino, “Violence detection in crowded scenes using substantial derivative,” in
Advanced Video and Signal Based Surveillance (AVSS), 2015 12th IEEE International Conference on, Aug 2015, pp. 1–6.
[25] D. P. Chau, F. Brémond, M. Thonnat, and E. Corvée, “Robust mobile object tracking based on multiple feature similarity and trajectory filtering,” in VISAPP 2011 - Proceedings of the
Sixth International Conference on Computer Vision Theory and Applications, Vilamoura, Algarve, Portugal, 5-7 March, 2011,
2011, pp. 569–574.
[26] S. Zaidenberg, B. Boulay, C. Garate, D. P. Chau, E. Corvee, and F. Bremond, “Group interaction and group tracking for video-surveillance in underground railway stations,” in International
Workshop on Behaviour Analysis and Video Understanding (ICVS 2011), Sophia Antipolis, France, Sep. 2011, p. 10.
[Online]. Available: https://hal.inria.fr/inria-00624356 [27] B. J. Frey and D. Dueck, “Clustering by passing messages
between data points,” Science, vol. 315, pp. 972–976, 2007. [Online]. Available: www.psi.toronto.edu/affinitypropagation [28] I. Laptev, M. Marszalek, C. Schmid, and B. Rozenfeld,
“Learn-ing realistic human actions from movies,” in Computer Vision
and Pattern Recognition, 2008. CVPR 2008. IEEE Conference on, June 2008, pp. 1–8.
[29] A. T. Palma, V. Bogorny, B. Kuijpers, and L. O. Alvares, “A clustering-based approach for discovering interesting places in trajectories,” in Proceedings of the 2008 ACM Symposium
on Applied Computing, ser. SAC ’08. New York, NY, USA: ACM, 2008, pp. 863–868. [Online]. Available: http: //doi.acm.org/10.1145/1363686.1363886
[30] J. Kim and K. Grauman, “Observe locally, infer globally: A space-time MRF for detecting abnormal activities with incre-mental updates,” in 2009 IEEE Computer Society Conference
on Computer Vision and Pattern Recognition (CVPR), 2009,
pp. 2921–2928.
[31] Y. Cong, J. Yuan, and J. Liu, “Sparse reconstruction cost for abnormal event detection,” in The 24th IEEE Conference
on Computer Vision and Pattern Recognition, CVPR, 2011,
pp. 3449–3456. [Online]. Available: http://dx.doi.org/10.1109/ CVPR.2011.5995434
![Figure 7 shows the abnormalities detected by our approach. In Table I, we show the quantitative results of our approach and the approach of [29], which uses density-based clustering in order to find stops and moves of trajectories](https://thumb-eu.123doks.com/thumbv2/123doknet/13589827.422889/11.918.493.821.80.565/abnormalities-detected-approach-quantitative-approach-approach-clustering-trajectories.webp)