HAL Id: halsde-00315537
https://hal.archives-ouvertes.fr/halsde-00315537
Submitted on 28 Aug 2008HAL is a multi-disciplinary open access archive for the deposit and dissemination of sci-entific research documents, whether they are pub-lished or not. The documents may come from teaching and research institutions in France or abroad, or from public or private research centers.
L’archive ouverte pluridisciplinaire HAL, est destinée au dépôt et à la diffusion de documents scientifiques de niveau recherche, publiés ou non, émanant des établissements d’enseignement et de recherche français ou étrangers, des laboratoires publics ou privés.
Conserved features and evolutionary shifts of the EDA
signaling pathway involved in vertebrate skin appendage
development.
Sophie Pantalacci, Arnaud Chaumot, Gérard Benoît, Alexa Sadier, Frédéric
Delsuc, Emmanuel Douzery, Vincent Laudet
To cite this version:
Sophie Pantalacci, Arnaud Chaumot, Gérard Benoît, Alexa Sadier, Frédéric Delsuc, et al.. Conserved features and evolutionary shifts of the EDA signaling pathway involved in vertebrate skin appendage development.. Molecular Biology and Evolution, Oxford University Press (OUP), 2008, 25 (5), pp.912-28. �10.1093/molbev/msn038�. �halsde-00315537�
RESEARCH ARTICLE
Conserved features and evolutionary shifts of the EDA signaling pathway involved in vertebrate skin appendage development
Sophie Pantalacci1, Arnaud Chaumot2, Gérard Benoît1, Alexa Sadier1, Frédéric Delsuc3, Emmanuel JP Douzery3, and Vincent Laudet1.
1 Université de Lyon, Institut de Génomique Fonctionnelle de Lyon, Molecular Zoology
Team, Institut Fédératif Biosciences 128 Gerland Lyon Sud ; Université Claude Bernard Lyon 1, CNRS, INRA, Ecole Normale Supérieure de Lyon, France
2 Cemagref, Laboratoire d'écotoxicologie, 3bis quai Chauveau, CP 220, 69336 LYON Cedex
09, France.
3 Institut des Sciences de l’Evolution de Montpellier, UMR 5554 du CNRS, Paléontologie,
Paléobiologie & Phylogénie, cc064, Université Montpellier II, Place E. Bataillon, 34095 Montpellier cedex 5, France
Correspondence to: Sophie Pantalacci and Vincent Laudet, IGFL, ENS de Lyon, 46 allée d'Italie, 69364 Lyon Cedex 07, France Tel: +33 4 72 72 81 90; Fax: +33 4 72 72 80 80; e-mail: sophie.pantalacci@ens-lyon.fr ; vincent.laudet@ens-lyon.fr
Key words: signaling pathway, comparative genomics, EDA, Ectodysplasin, evolutionary developmental biology, skin appendages
Running head: EDA signaling pathway evolution in vertebrates
Abbreviations
EDA: Ectodysplasin A EDAR: EDA Receptor
EDARADD: EDAR Adaptor with Death Domain HED: Hypohidrotic Ectodermal Dysplasia
ML: Maximum Likelihood TNF: Tumor Necrosis Factor
TNFR: Tumor Necrosis Factor Receptor WGD: Whole Genome Duplication
ABSTRACT
It is widely accepted that evolutionary changes in conserved developmental signaling pathways play an important role in morphological evolution. However few in silico studies were interested in tracking such changes in a signaling pathway. The Ectodysplasin (EDA) pathway provides an opportunity to fill this gap, since it is involved in vertebrate skin appendage development such as scales, teeth, hair and feathers that take an obvious part in the adaptation of species to their environment. We benefited from the large amount of genomic data now available to explore the evolution of the upstream genes of the EDA pathway. In mammals, these genes are eda (encoding two ligands, EDA-A1 and EDA-A2), edar (EDA-A1 receptor), edaradd (EDAR adaptor),
xedar (EDA-A2 receptor) and troy (a XEDAR-related receptor). We show that the
evolution of EDA pathway genes combines both strongly conserved features and evolutionary shifts. These shifts are found at different signaling levels (from the ligand to intracellular signaling) and at different taxonomic levels (class, sub-order, genera). While conserved features likely participate to the similarities found in the early development of vertebrate skin appendages, these shifts might account for innovations and specializations. Moreover, our study demonstrates that we can now benefit from the large number of sequenced vertebrate genomes to explore the evolution of specific signaling pathways, and thereby to open new perspectives for developmental biology and evo-devo.
INTRODUCTION
Morphological evolution of complex organisms is thought to arise through the evolution of the developmental mechanisms controlling morphogenesis. Among these mechanisms, “embryonic induction” refers to the ability of cells to induce their neighbors to change their behavior or their fate. Cells do so by secreting signals (ligands) that, upon reception (by receptors), are transduced into the cell through complex cascades leading for example to changes in gene expression. Research in the past two decades have shown that despite their wide morphological diversity, bilaterians only use a few types of developmental signaling pathways, such as hedgehog, Wnt, TGFB, Notch, FGF and nuclear hormone pathways (see for review: Pires-daSilva and Sommer, 2003). Nevertheless, many evolutionary changes in these signaling pathways can, at least in principle, shape morphological evolution, like for example, (i) structural mutations in the signaling pathway components: ligand, receptor, transcription factor… (see for example the melanocortin receptor, reviewed in Hoekstra and Coyne 2007) (ii) the functional diversification of the signaling pathway components through gene duplications (see for example the FGF superfamily (Itoh and Ornitz 2004; Popovici et al. 2005) or the nuclear receptor superfamily (Bertrand et al. 2004)) (iii) the co-option of existing signaling pathways networks into new structures (as exemplified by the hedgehog pathway in butterfly wing eyespot development: Keys et al. 1999); (iv) changes in the signaling network (see for example vulva development in C. elegans, Felix 2005) and (v) changes in cis-regulation (and thus spatio-temporal expression) of signaling pathway components or target genes (see for example BMP4 in finches beaks (Abzhanov et al. 2004) or Wnt signaling in the mouse and chicken face (Pires-daSilva and Sommer 2003); for recent reviews on cis-regulation in morphological evolution: Wray 2007; Prud'homme, Gompel, and Carroll 2007). Despite this large conceptual framework, only few studies have been able to pinpoint specific genetic changes in a signaling pathway gene as a key event for morphological evolution. Even
in silico studies of signaling pathway genes were, to our knowledge, limited to comparative studies at very high taxonomic scales (e.g. bilaterians, Pires-daSilva and Sommer 2003), or to reconstructions of gene family histories. But thanks to the large number of vertebrate genome and EST sequencing programs, we have now the opportunity to trace signaling pathway gene evolution while scanning for those clade specificities that may be associated with morphological evolution.
For this purpose, we have chosen the EDA pathway, which presents an obvious interest for morphological evolution. This pathway is involved in early organogenesis of vertebrate skin appendages, such as teleost fish scale or tooth (Kondo et al. 2001; Harris et al. submitted), bird feather (Houghton, Lindon, and Morgan 2005; Drew et al. 2007) or mammal tooth, hair and glands (Courtney, Blackburn, and Sharpe 2005; Mikkola 2007). As specialized interfaces with the environment, skin appendages are known hot spots of morphological evolution, both at the macroevolutionary and microevolutionary levels, and the study of their origin and evolution has been a major topic in evolutionary biology (see for example: Reif 1982; Peterkova, Lesot, and Peterka 2006). They share many similarities in the early steps of their development, which use a common set of genes, among which the genes of the EDA pathway (Sharpe 2001; Mikkola 2007). It is unclear whether this common genetic network is the result of direct lineage relationships between different types of skin appendages or the result of co-option events, or both. Lineage relationships have been demonstrated for some cases (e.g. from the keratinized scales of dinosaur to bird feathers (Wu et al. 2004)), but are still debated for others (from placoid scales of early cartilaginous fishes to teeth (Donoghue 2002; Stock 2001)). Whatever the case, we can expect that the evolution of the EDA pathway has been linked to the evolution of skin appendages. We already have an example for this, since the eda gene is responsible for adaptive variation of the body armor plate in fresh water populations of a teleost fish, the threespine stickleback (Colosimo et al. 2005; Knecht,
Hosemann, and Kingsley 2007). Moreover, two other genes of the EDA pathway are strong candidates in recent adaptation of human populations in Asia (Sabeti et al. 2007; Williamson et al. 2007). Albeit in those cases, we do not know the selected trait, the Asian-specific allele of one of these two genes (edar) has been clearly associated with increased hair thickness (Fujimoto et al. 2007).
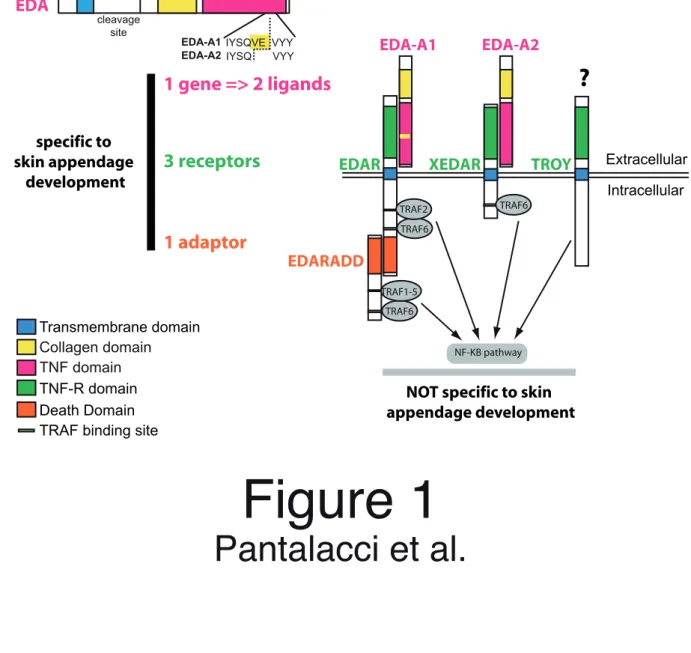
The EDA pathway belongs to an ancient type of signaling pathway, the TNF signaling pathway, which is common to bilaterians and involves ligands of the TNF superfamily binding to receptors of the TNF receptor (TNFR) superfamily. Like for many other signaling pathways, both the ligands and receptors of these superfamilies were extensively duplicated during early vertebrate evolution (Collette et al. 2003). In human and mouse, the term “EDA pathway” is used to describe two TNF pathways of which respective ligands, EDA-A1 and EDA-A2, are produced by alternative splicing from the same gene, eda (Figure 1). First, the EDA-A1 pathway involves the TNF-like ligand EDA-A1, the TNFR-like receptor EDAR and a death domain adaptor, EDARADD, that is recruited by EDAR death domain after ligand binding (Thesleff and Mikkola 2002; Courtney, Blackburn, and Sharpe 2005) (Figure 1). Second, the EDA-A2/XEDAR pathway involves the EDA-A2 ligand, which differs from EDA-A1 by only two missing aminoacids (Figure 1), and the XEDAR receptor, whose TNFR domain is related to that of EDAR (Yan et al. 2000) (Figure 1). From an evolutionary point of view, a third pathway, the TROY pathway, could also be included in an “EDA pathway, senso lato”, since the TNFR domain of TROY is closely related to that of XEDAR. TROY (also known as TAJ-1, TRADE or TNFRSF19 (Eby et al. 2000; Kojima et al. 2000)) however does not bind either EDA-A2 or EDA-A1 and is still an orphan receptor to date (Bossen et al. 2006). In all, the EDA pathway, senso lato, involves signaling through the three related TNFR receptors: EDAR, XEDAR and TROY (Figure 1). Despite their radically different cytoplasmic tail, signaling through all three receptors converges on TRAF proteins (binding
to receptors and EDARADD) and NF-!B signaling (Courtney, Blackburn, and Sharpe 2005) (Figure 1), which are commonly involved in TNF pathways and, as a consequence, are also involved in other processes like osteogenesis or immunity (Zonana et al. 2000; Ohazama et al. 2004). That these three pathways should be taken as a whole is confirmed by their broad involvement in skin appendage development. In mammals, the EDA-A1/EDAR/EDARADD pathway is necessary for skin appendage development and its impairment results in Hypohidrotic Ectodermal Dysplasia (HED), characterized both in human and mouse by defects in tooth, hair and glands (Mikkola and Thesleff 2003). EDAR signaling is also necessary for feather development in chicken (Drew et al. 2007) and for tooth and scale development in teleost fishes (Kondo et al. 2001; and Harris et al. submitted). xedar and troy knock-out mice show no obvious phenotype (Newton et al. 2004; Shao et al. 2005). However, both genes are expressed during skin appendage development in both mouse and chicken (Pispa et al. 2003; Drew et al. 2007) and, in chicken, their loss results in feather development defects (Drew et al. 2007). Thus, at least in amniotes, all three receptors share an intimate and related role in skin appendage development. We thus consider that the EDA pathway, senso lato, includes the signaling related to skin appendage development through all three receptors. In summary, the EDA pathway is a promising model for studying how the evolution of a signaling pathway can be involved in morphological evolution. In addition, while being relatively simple, it is also quite representative of other signaling pathways. Indeed, it provides a typical case of duplicated receptors that evolved different ligand binding and intracellular signaling specificities, which, like very often, were studied mainly in mammals. An important consequence is that, except in human and mouse, there is no biochemical data about the precise ligand/receptor relationships of the three receptors to the EDA ligands. For all these reasons, we chose the EDA pathway as a model and made use of the large number of vertebrate genomes to explore the evolution of this specific signaling pathway during
vertebrate evolution. This allows us to provide the first comparative genomic overview of the evolution of a signaling pathway at the scale of vertebrates.
MATERIALS AND METHODS Gene prediction
The origin of sequences used in this study is described in Table S1. Reference sequences stored in “Refseq” from Genbank were used in priority when available as well as the Ensembl gene predictions. Importantly, all these predictions were checked manually to detect annotation errors especially around splicing sites, which are very frequent. Similarity searches were performed using tblastn against assembled genomes (http://ensembl.org; http://esharkgenome.imcb.a-star.edu.sg/index.html), EST data (from http://ncbi.org) and TRACE data (deposited in the Trace Archive of Genbank) followed by manual compilation of data to predict further genes or exons missing from Ensembl predictions (small exons). Criteria for accepting an exon were high sequence similarity, adequacy of the splicing sites, and assignment of all exons of a gene to the same genomic region (assembled genomes only). Each time our prediction or even an Ensembl prediction did not fit with this criteria, the corresponding sequence was replaced by question marks. EST data were checked against genomic data when possible. EST and Trace data being susceptible to sequencing errors, we compared two or more sequences to each other when feasible. When the sequences diverged, we added a question mark except when one of the sequences exhibited a conserved amino acid, in which case we included this conservative version. For small exons (like EDARADD exons 1A and 1B), we also used conservation of non coding regions immediately around to screen databases by blastn.
cDNA cloning
We cloned Macropus eugenii edaradd isoform-A, Mesocricetus auratus edaradd isoform-B, Mus Nannomys minutoides edaradd isoform-B, Cavia porcellus edaradd isoform-A and Macropus eugenii eda cDNAs from adult kidney total mRNA of respective species with
primers included in the Table S1. Macropus mRNA was kindly provided by Dr. Kevin Nicholas from Melbourne University. The corresponding sequences were deposited in Genbank (Accession number, respectively: EU410404, EU410405, EU410406, EU410407 and EU410403).
Sequence alignments
Sequences were aligned using Muscle (http://www.drive5.com/muscle/; (Edgar 2004)) followed by manual refinements. In the provided alignments (Figure S1 to S5), we used a color code to underline aminoacids shared by different group of species (see legend of Figures S1 to S5 for details).
Phylogenetic reconstructions
Phylogenetic trees were calculated on specific protein domains. Alignments used can be found in fasta format in table S2. Maximum likelihood (ML) reconstructions were conducted with PHYML (Guindon and Gascuel 2003) using the JTT model of amino acid substitution, with among site rate heterogeneity model by a gamma distribution with four categories and an estimated proportion of invariable sites. Indeed, JTT model with a gamma distribution had been found to best fit to the data, as tested with ProtTest 1.4 (Abascal, Zardoya and Posada 2005). For the “free topology tree”, the tree was calculated using NNI moves on a BioNJ starting tree and 500 bootstrap replicates were performed. For the “imposed topology”, the tree topology was constrained according to the accepted phylogeny of organisms with only branch lengths being estimated by the software. The imposed species phylogeny used was established on (Murphy et al. 2001) for mammals, and (Lavoue et al. 2005) for fish and can be found on Figures S1 to S5.
3D modeling of EDA-A1 and EDA-A2
3D models of EDA-A1 and -A2 of the various species were modeled on the human EDA-A1 (1RJ7) and EDA-A2 (1RJ8) homotrimers using the Swiss-PDB Viewer software (v3.9) and the web-based Model server. Electrostatic potential was computed using the Swiss-PDB Viewer software.
Identification of shifts in site-specific selective constraints during mammal evolution In order to identify amino acid undergoing shifts in their selective constraints during mammal evolutionary history, we performed phylogenetic analyses using ML methods and codon-based substitution models. Nucleic sequences were first aligned by reference to protein alignments. Since gap positions are discarded before ML computations, different sets of sequences (Table S3) were analyzed favoring either a maximum number of positions (but a reduced species number) or a maximum number of species (but a reduced position number, i.e. a sub-part of the protein). We used the software PAML v3.14 (Yang 1997) which allows site-specific computation of non synonymous/synonymous substitution rate ratios (" or Ka/Ks) for a predefined branch versus other branches of a phylogenetic tree. We carried out all computations with an unrooted consensus topology of mammals (topology after Murphy et al. 2001 and Huchon et al. 2002 for rodents). In order to test site-specific changes in selective constraints for predefined branches, we used the likelihood ratio tests based on branch-site models developed by Zhang and colleagues (Yang 1997; Zhang, Nielsen, and Yang 2005). These tests consist of applying three models to the data and comparing their respective likelihood value: (I) the nearly neutral model (M1a) only considers constrained and neutral residues with no possibility of shift between the two categories along the branches of the phylogenetic tree; (II) the modified branch-site model A, which allows some sites to undergo a non-synonymous/synonymous substitution rate ratio (!2) greater than 1 for a predefined
branch of the tree, considering thus possible positive selection events along a specific lineage; (III) a branch model built in the same way as the modified branch-site model A but with !2 =
1 fixed, considering thus site-specific relaxation along the same lineage (Zhang, Nielsen, and Yang 2005). Because these models are nested, likelihood ratio tests based on twice the log-likelihood difference as a statistic can be constructed to test the existence of positive selection or relaxation events on given branches (Yang 1997). Test 1 of Zhang et al. (Zhang, Nielsen, and Yang 2005) – i.e. branch-selection model (II) as alternative vs nearly neutral model (I) as null model using a conservative #2 with two degrees of freedom – was employed here to test
the relaxation in a given branch. The relaxation was also tested with a supplementary likelihood ratio test called “test 1bis”, considering the branch-relaxation model as alternative
vs the nearly neutral model as null model and a #2 distribution with one degree of freedom for
the test statistic distribution. We performed test 2 (Zhang, Nielsen, and Yang 2005) to test for positive selection, comparing the branch-selection model (III) as alternative versus the branch-relaxation model (II) as a null model. In this latter case, since the conservative procedure – use of a #2 distribution with one degree of freedom – yields overestimated
p-values, we also calculated p-values according to the exact null distribution for this test, which is a 50:50 mixture of point mass 0 and #2 with one degree of freedom (Zhang, Nielsen, and
Yang 2005). If test 1, test 1bis or test 2 rejected the null hypothesis, we identified sites under either relaxation or positive selection along the defined lineage using the posterior probabilities supplied by the empirical Bayesian procedure implemented in PAML (Yang, Wong, and Nielsen 2005).
Synteny Map
The synteny map for the eda-xedar region was generated from genome assembly data found in Ensembl. For each species, we walked on the chromosome (or scaffold) from the xedar
gene or the eda gene, and looked for genes described in Ensembl as orthologs of genes found in the human xedar-eda region. Only such genes were represented on the map.
Non coding sequence alignment in the edaradd gene
Ensembl genomes and Ensembl TRACE were screened by blastn with both a human and a Monodelphis probe spanning 1.4 kilobases around exon 1A and 1B of the edaradd gene (the sequence can be found in the Table S1). Genbank ESTs were screened with tblastn for the coding sequence of exon 1A and 1B.
TRACE data of Spermophilus tridecemlineatus, Oryctolagus cuniculus and Cavia porcellus were compared to establish a consensus sequence for the region. These sequences were of poor quality and we used chromatogram data to check them manually (http://trace.ensembl.org/).
The EST spanning edaradd exon 1A of Ovis aries exhibited a sequence error introducing a frame-shift. This error was confirmed by sequencing a small PCR fragment of genomic DNA (Accession number: EU410408) and the corresponding sequence was corrected (Table S1). Large genomic regions spanning the edaradd gene were extracted from Ensembl for Homo sapiens, Mus musculus, Rattus norvegicus, Canis familiaris, Bos taurus, and Monodelphis domestica. They were aligned with Spermophilus tridecemlineatus, Oryctolagus cuniculus and Cavia porcellus short sequences using M-LAGAN (Brudno et al. 2003) and alignment was visualized using Vista (Mayor et al. 2000) and Seaview (Galtier, Gouy, and Gautier 1996).
RESULTS
In our study, we considered the molecular evolution of the upstream genes of the EDA pathway, namely eda, edar, xedar, troy and edaradd, which are specific to skin appendage development (Figure 1). We first produced an annotated dataset for each gene (domains, exons, comparison with mutation in HED patients…) by crossing data from EST sequences, complete genome sequence and trace archive (Figures S1 to S5, the dataset is fully available in Table S1 of supplementary materials or on the first author website: http://igfl.ens-lyon.fr/Members/spantala). Then, we studied conservation and clade specificities in these genes, with two questions: Can we detect evolutionary shifts that may be related to the remarkable diversification of vertebrate appendages? How far can we expect to extrapolate our knowledge of the pathway in human and mouse to other species – especially our knowledge of ligand-receptor relationships? At this point, it is important to note that, by encoding two ligands with only two alternatively-spliced amino acid differences but with two different receptor specificities (Figure 1), the eda gene should coevolve with receptors of both ligands (i.e. edar and xedar for human and mouse).
In this result section, we will review conserved and clade specific traits in the functional domains of these genes by running through the pathway, that is, starting with the ligand and the ligand binding part of the three receptors, and going on with intracellular signal transduction, i.e. the cytoplasmic tail of the three receptors and the EDARADD adaptor.
Two cleaved EDA ligands, EDA-A1 and EDA-A2, are found at least in all osteichthyans In human and mouse, alternative splicing of the eda transcript generates two major isoforms, A1 and A2, differing by only 2 amino acids in the TNF domain (lacking in EDA-A2, Figure 1). These two transmembrane proteins are cleaved by a furin protease to free the two ligands, EDA-A1 and EDA-A2, which form homotrimers through their collagenous
domain. Ultimately, in mammals, EDA-A1 and EDA-A2 trimers each bind a different receptor, EDAR and XEDAR respectively, through their trimerized TNF domain.
From our dataset, it appeared that any gnathostome EDA ligand should be cleaved and should be able to trimerize, since all eda genes contain a consensus site for furin cleavage and a very well conserved collagenous domain (figure S1). The EDA-A1 isoform is predicted in all examined gnathostome genomes and ESTs and can be found in various clades (Figure S1; see various ESTs in Table S1). The shorter EDA-A2 isoform is also predicted in all examined gnathostomes, but in its case the prediction is more problematic. Indeed, the A2 alternative splicing event corresponds to the use of an internal donor splice, formed by the first two nucleotides encoding Val308 of the EDA-A1 isoform (Figure 1). Consequently, at the genomic level, it is not possible to distinguish between constraints to maintain this valine or the donor splice site (or both). We found EST sequences corresponding to EDA-A2 in Xenopus and Gallus (Table S1), but none in fish. The existence of EDA-A2 splice variant outside tetrapods has been provided Colosimo et al. 2005 who reported its detection in the stickleback Gasterosteus aculeatus by RT-PCR.
Therefore, a cleaved collagenous EDA-A1 ligand is obviously a common feature of gnathostomes. It remains to be confirmed for the EDA-A2 isoform, which is however at least a common feature of osteichthyans (including both tetrapods and teleosts).
Another EDA ligand with lower affinity, EDA-A5, is expressed in various tetrapods
In humans, another alternative splicing variant, called EDA-A5, is missing three amino acids in the very beginning of the TNF domain (Figure S1). Few things are known about this isoform, except that it binds EDAR with a lower affinity than EDA-A1 (Hashimoto, Cui, and Schlessinger 2006). Interestingly, this third isoform is also found in Xenopus and Gallus ESTs (see Table S1), suggesting that its presence is a functional feature of all tetrapods.
The receptor binding surface of the EDA ligands changed at least twice: once subtly in therians and once radically in teleosts.
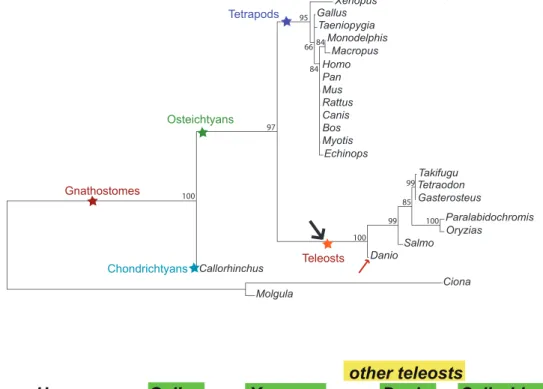
We have seen that the major EDA-A1 and EDA-A2 ligands are found in most vertebrates. However, biochemical data are only available in human and mouse, in which EDA-A1 binds to EDAR and EDA-A2 binds to XEDAR. Whether these relationships can be generalized to other species is currently unknown but a comparative study of the TNF domain evolution in vertebrate species could provide useful insights into this question. As a first step, we performed an ML analysis, which revealed two trends (Figure 2A). First, the domain evolved at an extremely slow rate in tetrapods. Second, the branch leading to teleosts is almost twice longer than the branch leading to therian mammals (from the actinopterygian/sarcopterygian split, arrow and thick lines in Figure 2A), despite the fact that the divergence of the herein represented teleosts is equivalent to that of the represented therian mammals (150-165 MY versus 125-140 MY, after Benton and Donoghue 2007) . Interestingly, this long branch was related to non conservative substitutions at positions otherwise conserved in other gnathostomes (i.e., Callorhinchus + tetrapods) (dark grey in Figure S1). Such kind of substitutions were 2.8 more frequent for teleosts versus other gnathostomes than for therian mammals versus other gnathostomes. From this analysis, we thus expected that EDA TNF domain evolution is conservative in tetrapods, while a shift occurred in the course of teleost evolution. Since 3D data are available for both EDA-A1 and EDA-A2 TNF domains (Hymowitz et al. 2003), we had the opportunity to further characterize these trends.
As already mentioned, the functional units binding the receptors are trimers of EDA-A1 and trimers of EDA-A2. These EDA trimers display a bipartite receptor binding surface: the upper part is similar in both trimers while the lower part differs and thus confer receptor specificity (see Figure 2C) (Hymowitz et al. 2003). In order to evaluate the possible consequences of
species differences in amino acid sequence, we located these differences on the human EDA-A1 and EDA-A2 trimers. We first noticed that the backbone of the trimer was very well conserved and that differences were almost exclusively found at its surface. We thus examined them in more details for a few representative species (Figure 2B).
Unexpectedly, one of the very few differences found in Gallus and Xenopus (a phenylalanine at position 343 instead of a tyrosine) was located just in the lower part of the binding surface (yellow star in Figure 2B and Figure S1). Nevertheless, our modeling showed that Gallus and Xenopus EDA-A1 and EDA-A2 trimers are similar to their human counterparts, in terms of surface and electrostatic potential (Figure 2C). The Tyr343Phe substitution, which occurred specifically in therian mammals versus all other vertebrates, thus did not induce a drastic change of the receptor binding surface. However, given its crucial position, this therian specific substitution is probably important for the fine tuning of ligand-receptor assembly of one or both ligands in therians versus other tetrapods.
As the ML analysis indicated that the Danio sequence accumulated very few amino acid replacements after its divergence from the ancestral sequence of all teleosts (see the very short branch in Figure 2A highlighted by a small red arrow), we considered it as a representative of the shift that occurred at the basis of teleosts. Most of positions that differ between Danio and Homo were found in and around the lower part of the receptor binding site (Figure 2B). Comparison with positions that differ in the more distantly related species Callorhinchus (Figure 2B) showed that most of them are in fact positions that specifically changed in teleosts (represented by Danio) versus other gnathostomes. Our observation thus suggested that the lower part of the binding surface, which is responsible for receptor specificity, could have specifically changed early in teleost fish evolution. The modeling of both Danio EDA-A1 and EDA-A2 confirmed that the lower part was actually very different from its human counterpart, while the upper part was still quite similar (Figure 2C). Indeed, the Danio
EDA-A1 surface was globally more apolar than its human counterpart and the Danio EDA-A2 surface was strongly positively charged instead of being apolar as in human. Nonetheless, like in tetrapods, Danio EDA-A1 and EDA-A2 trimers differed from one another only in their lower part (Figure 2C). All together, these observations strongly suggest that the EDA-A1 and EDA-A2 surfaces responsible for receptor specificity experienced an acceleration before the diversification of teleosts, and were subsequently fixed in teleosts. Indeed, variable positions in teleosts (yellow in Figure 2B) are out of these surfaces.
In conclusion, the receptor binding surfaces of the EDA ligands changed at least twice during vertebrate diversification: once during therian evolution, and once more drastically, during teleost evolution. An important issue is whether we can correlate these changes with changes in the ligand binding domain (TNFR domain) of the three receptors, EDAR, XEDAR and TROY. Of note, these three domains are phylogenetically related, with XEDAR and TROY being closer to each other than they are to EDAR (Cui and Schlessinger 2006, see also Figure 4). Nevertheless, in human and mouse, EDAR is the exclusive EDA-A1 receptor; XEDAR, the exclusive EDA-A2 receptor and TROY is to date considered an orphan receptor (Bossen et al. 2006). We then characterized the evolution of all three receptors.
xedar evolved much faster than edar and troy in gnathostomes
As compared with edar and troy, bioinformatic identification of xedar genes was trickier. Up to now, the xedar gene was only known in amniotes (human, mouse and chicken) and had not been detected in teleost fishes (Knecht, Hosemann, and Kingsley 2007). Nevertheless, in our analysis, we found EST sequences from Xenopus and Danio that we interpreted as clear xedar orthologs for three reasons: (i) in an ML analysis of the TNFR domain (Figure S6), these genes grouped with the XEDAR-TROY family and are clearly excluded from the robustly supported TROY monophyletic group that already contains orthologs in the same species; (ii)
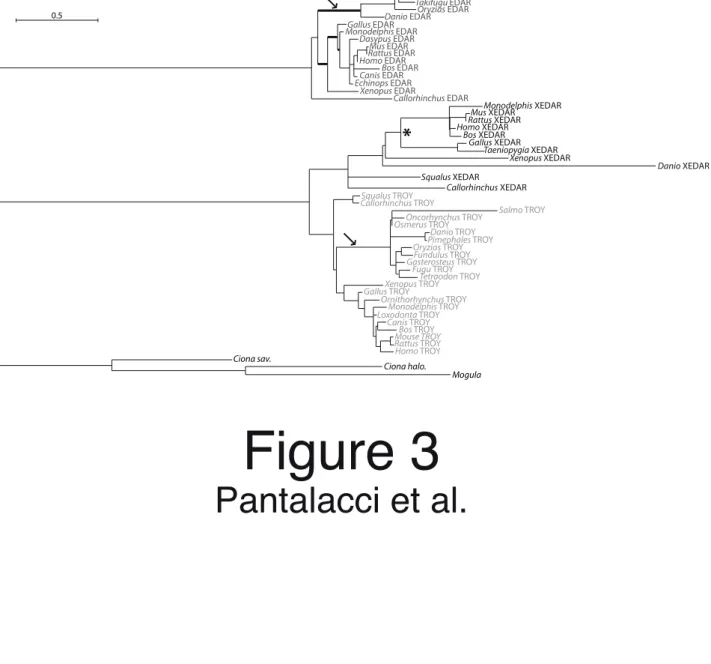
their cytoplasmic tail include a short region containing a TRAF6 binding site, with high similarity to the unique intracellular region conserved between human and chicken xedar genes (see Figure S3); (iii) these genes are located in chromosomal regions that are clearly syntenic with the region encompassing xedar in human (Figure S7). In addition, we also found sequences from Squalus (EST) and Callorhinchus (genomic prediction), which also clustered in the xedar group (Figure S6) and were thus very likely to be xedar orthologs. All together, these data strongly suggested that we actually identified xedar orthologs in Xenopus, Danio, Squalus and Callorhinchus. Now comparing all xedar gnathostomes genes, it appears that the TNFR domain of xedar genes evolved much faster as compared with the ones of edar and troy (compare branch lengths on Figure 3).
xedar TNFR domain evolved rapidly in amniotes, raising questions about the evolution of
specificity to the EDA isoforms
The previous observation holds true among amniotes: in our ML analysis, we found long branches separating therians (placentals + marsupials) and birds from their common ancestral node (marked with a star on Figure 3). Close examination of amino acid sequences revealed that several residues specifically changed in therians (see yellow with red circle residues in Figure S3). The third cysteine rich repeat, which has been shown experimentally to be responsible for specific binding to EDA-A2 versus EDA-A1 (Hymowitz et al. 2003), is also concerned (note at position 89 the substitution of a glycine with an arginine, whereas this glycine was conserved in all non therian XEDAR and even EDAR and TROY proteins, Figure S3). Importantly, this pattern of evolution thus leaves open the possibility that the function known in mammals (EDA-A2 binding) only arose with the recent changes that we observed in therian mammals. Moreover, it is tempting to relate these observations to the Phe343Tyr substitution specifically found at the receptor binding surface of EDA ligands in
therians (Figure 2B).
xedar is highly divergent or lost in teleost fishes, while the TNFR domain of both edar and troy may have experienced an evolutionary shift at the base of teleosts
As judged by our ML calculations, the xedar TNFR domain of the teleost Danio rerio was much more divergent than that of any other species. From then on, one could expect difficulties in detecting divergent xedar genes by tblastn searches in the four Acanthopterygian genomes. Indeed, despite close scrutiny, we did not find any ortholog of xedar in the well assembled Gasterosteus, Takifugu and Tetraodon genomes. However, we could find two exons of a highly divergent xedar homolog in the Oryzias genome. This divergent gene is located on the same chromosome as eda (Figure S7), but the synteny relationship of neighboring genes found between Danio and human is scrambled in Oryzias. Still, the most likely hypothesis is that it is actually a xedar gene even more divergent than the one in Danio. We concluded that in teleosts, the xedar gene was either highly divergent (for example in Danio and Oryzias) or lost (maybe the case of Gasterosteus, Takifugu and Tetraodon).
Interestingly, this high divergence/loss of xedar correlated with an evolutionary shift on edar and troy TNFR domain at the base of teleosts. Indeed, for both edar and troy TNFR domain, we noticed in our ML analysis the aberrant position of teleost sequences outside the gnathostome clade represented by the Callorhinchus plus tetrapod sequences (see arrows on Figure S6). This topology was typical of a long-branch attraction artifact and, indeed, recalculation of branch lengths on an imposed species phylogeny resulted in long branches leading to teleost fishes (arrows on Figure 3). As for eda, we quantified teleost- and therian-specific substitutions at sites otherwise conserved in gnathostomes. For both edar and troy, we found respectively 2 and 1.8 more substitutions for teleosts than for therian mammals.
Close examination of the EDAR TNFR domain sequence (Figure S2) revealed seven positions for which tetrapod sequences share the same amino acids as Callorhinchus sequences, while teleost sequences diverged. These seven positions are albeit identical within teleosts (colored in dark grey in Figure S2, positions Glu54, Gln85, Glu94, Gly95, Phe96, Phe97, Pro143, by reference to the human sequence). Together, this sequence pattern suggested an ancient case of positive selection at the base of teleosts. Interestingly, six positions out of these seven teleost specific positions were clustered in the second and third cysteine rich repeats of the TNFR domain, which are known to mediate interactions with the ligand in mammals (Hymowitz et al. 2003). These data suggest that the EDAR TNFR domain, and more specifically its ligand binding part, underwent an evolutionary shift at the base of teleosts.
The TNFR domain of troy shows a similar sequence pattern (dark grey residues in Figure S4), while the divergence observed inside teleost species is low and affected sites likely to evolve neutrally (Figure S4). This pattern suggested that the TNFR domain of TROY, like the one of EDAR, underwent a single shift at the base of teleosts.
In summary, while XEDAR strongly diverged or was even lost in some teleost species, it seems that there was a correlated shift on the TNFR domain of the remaining receptors: EDAR and TROY, which is consistent with the shift observed on the EDA-A1 and EDA-A2 receptor binding surfaces.
All the domains allowing EDAR intracellular signaling are very well conserved in gnathostomes, while TROY and XEDAR signaling domains changed at least twice: once for birds (XEDAR) and once for teleost fishes (TROY)
In mammals, EDAR signaling is mediated by TRAF proteins. EDAR can recruit these proteins directly through specific binding motifs found in its cytosplasmic tail. Alternatively,
EDAR can recruit EDARADD through heterotypic interactions of their respective death domains, and EDARADD in its turn allows further signal transduction by recruiting TRAFs proteins (Thesleff and Mikkola 2002).
In the cytoplasmic tail of EDAR, the TRAF2 and the TRAF6 binding sites are identical in all vertebrates and even the backbone supporting them is well conserved (see black residues in Figure S2). The death domain of both EDAR and EDARADD are extremely well conserved in vertebrates (see black residues in Figure S2 and S5). Moreover, in EDARADD, the two different TRAF binding sites (one for TRAF6 and one for TRAF1, 2, 3, 5) are conserved in all vertebrates (Figure S5). These observations suggest that the EDAR-EDARADD signaling through different TRAFs is conserved in all gnathostomes.
As compared to EDAR, the signaling trough XEDAR and TROY has been less studied. In mammals, XEDAR allows TRAF recruitment (Sinha et al. 2002) and indeed a TRAF6 binding site is conserved in all osteichthyans. More interestingly, chicken xedar has a supplementary terminal part encoding a death domain (Drew et al. 2007). We found this C-terminal death in the bird Taeniopygia, but not in Xenopus, nor in any mammalian genome. Thus, at least for birds versus amphibians and mammals, XEDAR signaling can in principle have different signaling outputs.
TROY signaling domains have not been mapped precisely in mammals. However, our alignment revealed that a small region of the cytoplasmic tail is conserved in both chondrichthyans and amniotes. This motif thus probably plays a role in signaling. Importantly, this region is divergent in teleost fishes, suggesting that a shift in the downstream signaling abilities of TROY correlated with the changes seen at the level of the ligand binding.
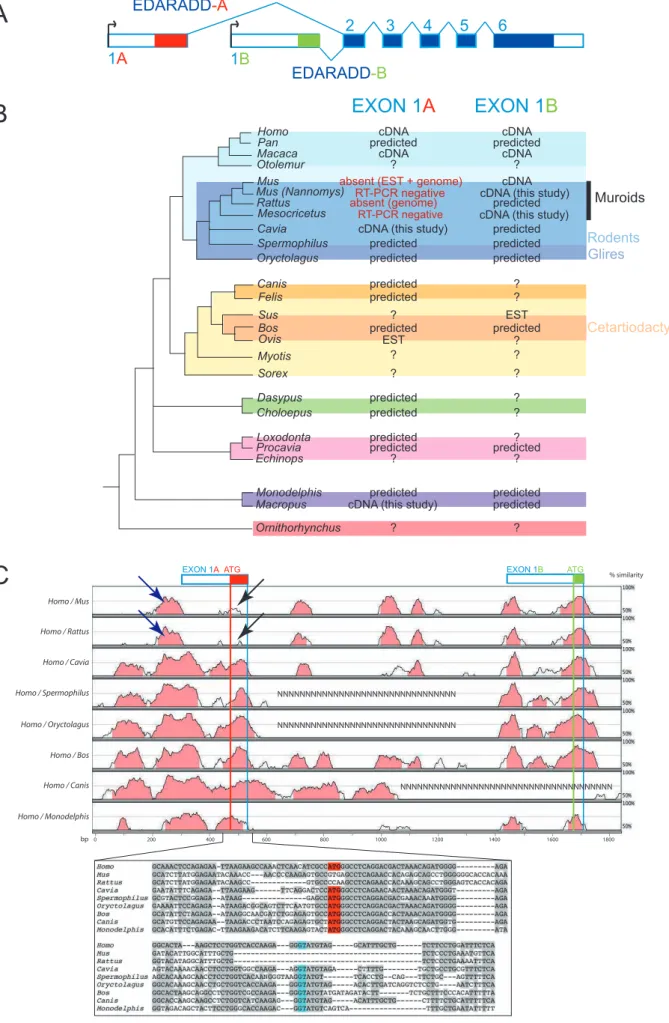
In humans, two major EDARADD isoforms differing in their very N-terminal ends have been described: EDARADD-A and EDARADD-B (Figure 4A). Examination of the extensive set of ESTs available for both isoforms suggested that they were transcribed through alternative promoter usage at two alternative exons: exon 1A and exon 1B (Figure 4A). We could predict bioinformatically the presence of both exons in most mammals while EST data were supporting their expression in Cetartiodactyls (Figure 4B). In addition, we experimentally cloned an edaradd-A transcript in a marsupial (Macropus eugenii), for which bioinformatic prediction of exon 1A was questionable. We thus concluded that both edaradd-A and edaradd-B transcripts are expressed in marsupial and placental mammals. We could not find any similar exons in the Ornithorhynchus genome, but since this genome is still incomplete, their absence remains to be confirmed. In chicken, the first known exon has similarities with the short exon 1B at the protein level (Figure S5) and no sequence reminiscent of exon 1A was detected. The isoform 1B might thus be considered closer to the ancestral form of the EDARADD protein, while the 1A isoform might have been gained later during mammalian evolution.
EDARADD-A isoform was selectively lost in the Mus/Rattus lineage
Despite the large number of mouse ESTs available in public databases, we could only find mouse ESTs for the 1B isoform, and we could not find an exon 1A by tblastn searches in the mouse or rat genomes (Figure 4B). This raised the possibility that exon 1A could have been lost in the Mus/Rattus lineage. In the assembled genomes of Homo, Canis, Bos and Monodelphis, a small region of two kilobases contains conserved sequences corresponding to exon 1A and exon 1B as well as their respective promoters (as visualized with RVISTA, Figure 4C). In the orthologous region of mouse and rat, we detected a sequence with similarities to the promoter region of exon 1A of other mammals (blue arrow in Figure 4C),
but we failed to detect the exon 1A coding region (black arrow in Figure 4C). Closer examination revealed that the sequence aligned with the exon 1A coding region of other mammals is highly divergent in mouse and rat: the initiator codon is missing, as well as the splice donor site (Figure 4C). By screening TRACE data with the 2kb human region, we could find orthologous regions for two rodents (the squirrel Spermophilus tridecemlineatus and the guinea pig Cavia porcellus), and a lagomorph (Oryctolagus cuniculus). Clearly, exon 1A is present in all species, an observation confirmed by our experimental cloning of edaradd-A isoform in Cavia (Figure 4 B and C). All together these data indicated that the EDARADD-A isoform was specifically lost in a sub-lineage of rodents including Mus and Rattus. Since we were unable to clone an edaradd-A transcript by RT-PCR in the hamster Mesocricetus auratus, the loss may have occurred during the early evolution of the muroid family, which includes hamster, rat and mouse, but excludes ground squirrel and guinea pig (Figure 4B).
EDARADD-B underwent positive selection in the Mus lineage
By analyzing rodent EDARADD sequences, we noticed an insertion next to the DD in the Mus musculus EDARADD protein but not in the Rattus norvegicus one. We cloned EDARADD in two other muroid species (Mesocricetus auratus and another Mus species belonging to the sub-genus Nannomys: Mus (Nannomys) musculoïdes. We found that this insertion was absent from the hamster sequence, but present in Mus Nannomys, confirming that it was acquired in the Mus lineage, after the Mus/Rattus split. Interestingly, two substitutions were fixed in the vicinity of this insertion along the Mus stem lineage (Figure 5, see also in red Figure S5). This observation prompted us to determine the mode of evolution of both sites: neutral versus positive selection. We used the tests proposed by Zhang et al. (Zhang, Nielsen, and Yang 2005) and Yang et al. (Yang, Wong, and Nielsen 2005) to
determine first, if positive selection was acting in the branch leading to the two Mus species, and second, which amino acids were concerned. The test favored the hypothesis of positive selection (instead of relaxation) operating along the branch (see Figure S8 and its legend for detailed results). Only two positions were found under positive selection, but both were in the vicinity of the newly fixed insertion in the Mus species: the Thr residue found in the death domain at position117 and the Pro residue at position 96 (Figure 5, see Figure S8 and its legend for detailed results). In summary, in two species within Mus, we identified a specific insertion and two residues under positive selection in its vicinity. These findings are strongly indicative of a localized evolutionary shift in this region of the EDARADD protein. Interestingly, the new threonine residue in helix1 of the DD presents a consensus for phosphorylation by ProteinKinaseC (as predicted with NetPhos2.0 server, Blom, Gammeltoft, and Brunak 1999) that provides a perspective to understand the functional significance of this shift.
DISCUSSION
In this paper, we studied the evolution of the EDA pathway genes in vertebrates. We focused on the five upstream genes of the pathway, that is, eda, encoding the TNF ligands EDA-A1 and EDA-A2; edar, xedar and troy, each encoding a TNFR type receptor; and lastly, edaradd, encoding an adaptor to the TRAF/NF-!B pathway. Our study highlights several critical points in the evolution of these proteins during vertebrate diversification (Figure 6). Of note, in most cases, we only used the term “evolutionary shift” for what we presume will be a “functional shift” when functional data will be available (for a discussion on this terminology, please refer to Levasseur et al. 2006).
(1) A pathway signaling through EDA-A1, EDAR and EDARADD was very likely present and implicated in skin appendages development since early gnathostome evolution. The functional domains of eda, edar and edaradd display high amino acid similarity at the gnathostome level. The EDA-A1 isoform is conserved in all gnathostomes, and the eda-A1 transcript is found in embryonic ESTs of the major osteichthyan clades. As a result, the EDA-A1-EDAR-EDARADD pathway probably worked in much the same way since early gnathostome evolution. An EDA-A1 ligand with both a TNF and a collagenous domain is cleaved at a conserved furin site and interacts with EDAR TNFR domain. Then, signal transduction can occur in multiple ways: through direct TRAF recruitment (with conserved TRAF2 and TRAF6 binding sites in EDAR) and/or through EDARADD recruitment (conserved Death Domain). EDARADD itself allows recruitment of TRAFs through its conserved binding sites for TRAF1/2/3/5 and TRAF6. In addition, we know that edar loss of function impairs appendage development in mammals (tooth, hair, glands…: Mikkola and Thesleff 2003), chicken (feather: Drew et al. 2007) and teleost fishes (tooth and scales in zebrafish: Harris et al. submitted). It would be surprising if it was not also involved in tooth development in
chondrichthyans, since the teeth of all gnathostomes are generally considered as homologous (Reif 1982; Gillis and Donoghue 2007). In summary, both biochemically and developmentally, the EDA-A1 pathway has been remarkably conserved since early gnathostome evolution. An interesting question is whether this pathway arose with vertebrates or earlier, for example in the ancestor of all extant chordates. Of note, clear eda and edar/xedar/troy orthologs are found in invertebrate chordate genomes (Ciona and Branchiostoma, SP, unpublished data), but their developmental role as well as their biochemical function is totally unknown. However, we did not find orthologous domains for the death domain of EDAR and EDARADD in invertebrate chordate genomes, while we found them in the lamprey (SP, unpublished data). The ancestral chordate receptor, if able to activate the NF-KB pathway, should have done it by direct recruiting of TRAF proteins to the receptor (as still possible for edar and xedar vertebrate receptors, figure 1). The EDA-EDAR-EDARADD-TRAF-NF-KB pathway as known in vertebrate skin appendages is thus probably an innovation of early vertebrates. It is tempting to speculate that this innovation has something to do with the origin of the first mineralized skin appendages, such as dermal plates and odontodes found in early vertebrate fossils. Whether the ancestral chordate pathway might already have been involved in epithelial morphogenesis, and was later co-opted for those vertebrate specific epithelial appendages, will be investigated in our lab in a near future using amphioxus as a model system.
(2) Both EDA isoforms, EDA-A1 and EDA-A2, were likely already present in early gnathostome evolution. Actually, we showed that both isoforms can formally be encoded from every gnathostome eda gene, and that both splicing forms are experimentally found in several major osteichthyan clades (namely mammals, birds, amphibians and teleost fishes). EDA-A2 splicing should however be confirmed in chondrichtyes. Interestingly, this
alternative splicing is not possible in invertebrate chordate eda-like genes, where we accordingly found a single receptor as a homolog for the three vertebrate receptors (SP, unpublished data). The most likely evolutionary scenario would thus be that after a first round of duplication of the ancestral chordate receptor, two receptors specialized in the binding of one isoform: EDAR binding EDA-A1 and XEDAR/TROY binding EDA-A2 (Figure 7). After the second round of duplication, both XEDAR and TROY could bind EDA-A2 but then, as we will discuss it later, they might have evolved different binding specificities during the evolution of the major vertebrate clades. An important consequence of this hypothesis would be that the three receptors genes and the eda gene co-evolved to maintain individual ligand-receptor interactions from early vertebrate evolution.
(3-4) A major shift occurred in the EDA pathway at the base of teleost fish evolution. We showed that the receptor binding domain of the EDA-A1 and EDA-A2 ligands, and probably also the ligand binding domain of both EDAR and TROY receptors, underwent a shift at the base of teleost evolution. Moreover, the xedar gene is either highly divergent or lost in all examined teleost species. All together, these data suggest that a major shift occurred at the base of teleosts evolution. Since EDA-A2 is still expressed in Gasterosteus where xedar is lost, it seems obvious that the binding relationships in teleosts are different from those known in mammals. The most likely hypothesis would be that EDAR binds EDA-A1 and TROY (which is more closely related to XEDAR) binds EDA-A2, but this should be confirmed by biochemical experiments. If this is confirmed, then the loss of one of the three co-evolving receptors, namely xedar, could be sufficient to explain the shift that we observed, by punctually relaxing the selective pressure on the ligand eda and the two remaining receptors edar and troy. Interestingly, we also observed a shift on the cytoplasmic tail of TROY, suggesting that the TROY pathway also changed at the intracellular signaling level. All
together, it seems that while the EDA/EDAR/EDARADD pathway was strongly conserved in teleost fishes, the accessory pathways (TROY and XEDAR) were deeply reorganized at the base of teleost fishes.
(5) the low affinity EDAR binding isoform EDA-A5 is conserved in various tetrapods. Up to know, very little attention has been paid to this isoform, probably because it had only been described in human. However it is well known that ligands with different affinities can induce different level or type of intracellular signaling (Pires-daSilva and Sommer 2003), and thus the EDA-A5 isoform may have specific roles in the regulation of the EDAR signaling pathway, and by consequence, in the development of skin appendages. The finding that EDA-A5 is conserved in various tetrapods prompts to investigate this possibility.
(6) A recent functional shift in XEDAR intracellular signaling occurred in the bird lineage. Indeed, in birds, the cytoplasmic tail of XEDAR includes a Death Domain, which cannot be found in any other gnathostome species. As a consequence, the intracellular XEDAR signal transduction is predicted to be different between birds and mammals. The most parsimonious hypothesis would be that the xedar gene gained this death domain by exon shuffling in the course of avian evolution (in accordance with this view, the death domain is found as a supplementary last exon). Of note, the protein interacting with this death domain is unknown. Could EDARADD bind this death domain as it binds the one of EDAR? We do not favor this hypothesis since we failed to detect traces of an evolutionary shift on the bird edaradd gene as it would probably have been the case if EDARADD had gained this capacity. Finally, it is tempting to speculate that this change in xedar signaling might be linked to feather acquisition in birds, and it will thus be interesting to test this hypothesis by specifically investigating the role of this death domain in chicken.
(7) Could XEDAR and TROY receptor specificity as known in human and mouse be a recent acquisition of therians? In mammals, XEDAR is known as the exclusive receptor of EDA-A2, whereas TROY does not bind EDA-A2 or EDA-A1 (Figure 7). We showed that the XEDAR TNFR domain (including the part which is responsible for EDA-A2 specific binding) displays important differences in amino acid composition, even when comparing birds with therians. This finding was all the more curious since substitutions at sites otherwise conserved in tetrapods or even in gnathostomes are found in the TNFR domain of TROY (four substitutions, yellow with red circle in Figure S4) and in EDA ligands (a subtle change from phenylalanine to tyrosine at the receptor binding surface, Figure 2B). Thus it seems that a shift occurred concomitantly on both XEDAR, TROY TNFR domains and EDA in therians. In these conditions, could exclusive binding of EDA-A2 to XEDAR and absence of binding to TROY have been set only recently, in the course of therian evolution (Figure 7)? Importantly, some data obtained by Drew and colleagues (Drew et al. 2007) by manipulating TROY and XEDAR functions during in vivo feather development are not easily explained by transposing to chicken what is known from mammals. Moreover, they showed that EDA-A2 splicing is found well before XEDAR is expressed, at a time when only TROY and EDAR are expressed. The authors suggested that the splicing may be constitutive, but an alternative explanation would be that TROY could be an EDA-A2 receptor in Gallus. Even if our proposition is speculative in absence of biochemical data, we think that the pattern of evolution of xedar and troy calls for the necessity to perform biochemical experiments in non-therian species to establish the exact relationships between the EDA ligands, XEDAR and TROY.
(8) Two EDARADD isoforms are conserved in mammals, which differ only by their very N-terminal part, and use two different promoters. Interestingly, for both isoforms, we found a
strong conservation of both the N-terminal peptide and the predicted promoter region. Beside the potential functional differences in the proteins themselves (of note, the N-terminal sequence is just found six amino acid away from the TRAF6 binding site and could thus influence TRAF6 binding), the use of two promoters offers many possibilities to achieve different regulations at different developmental times or in different tissues. It will be very interesting to see what are the specificities of those isoforms and their transcriptional regulation in skin appendage development. Indeed, since those two isoforms seem to be an acquisition of mammals, it is tempting to speculate that they brought new levels of regulation that helped the evolution of new mammalian specific skin appendages like hair, mammary or sebaceous gland.
(9) One of the two EDARADD isoforms (isoform A) was lost in a lineage of rodents including mouse and rat. Importantly, whereas the possibility to encode the isoform A is clearly lost, the predicted promoter region of the isoform A is still partly conserved in mouse and rat. Thus, the regulatory information associated to isoform A was not fully lost but may have been partly reorganized in the remaining promoter. The guinea pig is not concerned by this loss, and, as a laboratory animal, will provide an interesting outgroup to study the nature of this change and its consequences for skin appendages development.
(10) In the Mus lineage, a positive selection event together with a 3 aminoacids insertion occurred in the EDARADD protein. Interestingly, these changes are gathered just before and within the first $-helix of the Death Domain. It is unclear at present when precisely these changes occurred and thus if they can be correlated to specific morphological or physiological changes within the Mus lineage. Biochemical tests will be required to see in which way the Mus musculus EDARADD protein could be functionally different from its closest counterpart
in Rattus norvegicus. In particular, it will be interesting to test the phosphorylation status of both proteins, since the Mus EDARADD proteins gained a threonine with a good phosphorylation consensus.
In conclusion, we provide the first overview of the evolution of a signaling pathway in vertebrates that is summarized in Figure 6. By using a large set of species, we could emphasize both conserved and clade specific traits in this pathway. We are confident that by simply enlarging the dataset, we would be able to point out even more clade specific traits, and to fully take the measure of how different and divergent can be a conserved signaling pathway in different species. Already, we found that clade specificities are found at all levels, whether one considers the different levels of the pathway (from the ligand-receptor relationships to the intracellular signal transduction) or whether one considers the different taxonomic levels (from the deep Actinopterygian/Sarcopterygian split to the recent split of the Mus genus).
More specifically, our study establishes the EDA pathway as a paradigm for the evolution of appendages. Indeed, the high conservation of the EDA-A1/EDAR/EDARADD module among gnathostomes (point 1) is presumably associated to a conserved function related to the individualization of the organ at the very early stages of its development, and thus could participate in the similarities noticed between vertebrate appendages in their early development (Sharpe 2001; Mikkola 2007). In contrast, subtle species specificities displayed by this module, but also species specificities in the satellite and obviously more flexible XEDAR and TROY pathway may have participated in skin appendage diversity (Figure 6), both at a macroevolutionary (see points 3 to 8) and a microevolutionary scale (point 9). Further evolutionary developmental studies will shed light on how these species specificities may be related to morphological evolution (Figure 6).
Concluding remarks
Our study highlighted the need to explore receptor specificities of the EDA-A1 and EDA-A2 ligands outside mammals. This is in contrast with developmental studies on the EDA pathway (for example in chicken (Drew et al. 2007)), which rely on the implicit idea that the receptor specificities found in mammals could be generalized. Such implicit conclusions of conservation between species are common in developmental biology, probably due to a habit to emphasize conservation of developmental mechanisms. A careful phylogenetic study like the present one may thus help to orientate comparative biochemical studies and in the end may help to more objectively interpret data obtained in one species by comparison to others. More generally speaking, our study provides a typical case in which proteins that looked “conserved” at first glance in fact exhibit species specificities when looked into detail. Indeed, comparisons of developmental genes are often done with a few species and, as a consequence, they only put the stress on conservation. In contrast, in our case, we used a wide range of species and, as a consequence, we could point out several species specificities. We wonder if the lack of this type of approaches may have contributed, at least in the evo-devo field, to underestimate the importance of evolutionary changes in coding sequences. Indeed, the current view tend to minimize the role of coding sequences and, by opposition, to set the evolution of cis-regulatory sequences as the main force driving morphological evolution (see for example: Prud'homme, Gompel, and Carroll 2007); and for the specific case of the EDA pathway: Colosimo et al. 2005; Knecht, Hosemann, and Kingsley 2007 ). However, recently Hoekstra and Coyne argued that this view relies on several a priori and that, for the moment, it is not possible to determine whether, of cis-regulatory or coding sequences, one plays a more important role (Hoekstra and Coyne 2007) - both probably playing an important role (Oakley 2007). Our findings, by demonstrating that species specificities in signaling proteins
are found even at a low taxonomic level, provided that we look for them, also supports this idea. For this reason, we think that this comparative approach could be applied with large benefits to other developmental signaling pathways.
ACKNOWLEDGEMENTS
We thank Dr Kevin Nicholas from Melbourne University for Macropus RNAs, and Laurent Granjon from ISEM, Montpellier, for Nannomys Tissues. We are grateful to Bastien Boussau, Pascale Chevret and Mathilde Paris for their help with phylogenetics, and to Guillaume Lecointre for helpful discussion on teleost phylogeny. We are also grateful to Pascale Chevret, François Bonneton, Arnaud Martin, Maria Theodosiou, Michael Schubert and especially Marie Semon for critical reading of the manuscript.
This work was supported by the “programme Emergence” of the Région Rhône-Alpes, the “Agence Nationale pour la Recherche” (“Quenottes” program), the Centre National pour la Recherche Scientifique (CNRS) and the Ecole Normale Supérieure de Lyon. The first author benefited from grants obtained by the Fondation pour la Recherche Médicale (FRM) and the Fondation Singer-Polignac. This is contribution ISEM 2007-XXX of the Institut des Sciences de l’Evolution de Montpellier.
SUPPLEMENTARY MATERIAL
Table S1: Full set of sequences and alignments used in this study (excel table)
The complete vertebrate data set for eda, edar, xedar, troy and edaradd (DNA and aminoacids, origin of sequence and accession numbers) will be found in the so-called five excel sheets. Tunicates sequences used to root the trees will be found on a separate sheet. Alignments used for ML analysis will be found in Mfasta on an excel sheet named with the figure number (Figure 2, Figure 3).
Dataset and alignments (DNA and aminoacids) used for positive selection tests in Figure 5 and S7 (EDARADD) will be found on an excel sheet named with the figure number (Figure 5).
Figures S1 to S5: Sequence alignment and functional features of the EDA pathway proteins in vertebrates
Functional domains are shown (TM= Transmembrane Domain; TRAF2 binding = consensus site for TRAF2 binding; TRAF6 binding = consensus site for TRAF6 binding; TRAF1,2,3,5 binding = consensus site for TRAF proteins1, 2, 3 and 5 binding), as well as exons (blue lines separating two amino acids or surrounding an amino acid when the codon is formed from two exons). Stars indicate point mutations found in HED patients (EDA: Schneider et al. 2001; Vincent et al. 2001; Visinoni et al. 2003; Tao et al. 2006; EDAR: Monreal et al. 1999; Schneider et al. 2001; Chassaing et al. 2006; Lind et al. 2006 ; EDARADD: Yan et al. 2002. Origin of the sequences and sequences themselves can be found in Table S1. The phylogeny shown at the margin of sequences is based on Murphy et al. 2001 and Lavoue et al. 2005. The proteins are colored to reveal amino acids shared by different clades (see below). For convenience, the color code is symbolized on the phylogeny. However, it should be mentioned that the color code only underlines shared amino acids, without any assumption
about their evolutionary status (ancestral/derived state). See Table S1 for complete species names.
Black: positions shared at least by species belonging to two out of three major vertebrate clades: Chondrichthyans (Squalus and Callorhinchus), Tetrapods and Teleosts.
Light grey: positions shared by at least two of the three tetrapod clades: Mammalia, Aves (Gallus and Taeniopygia) and Amphibia (Xenopus).
Yellow: positions shared by the majority of represented placentals (except for Figure S4 and S5: positions shared by all Mammals)
Green: positions shared by the two represented marsupials (except for Figure S4 and S5: positions shared by the two represented Chondrichthyans)
Blue: positions shared by the two distant birds (Gallus and Taeniopygia)
Dark grey: positions shared by at least two of the three represented teleost families: Ostaryophysii (Danio and Pimephales), Protacanthopterygii (Osmerus, Salmo and Oncorhynchus) and Acanthopterygii (Oryzias, Fundulus, Ptyochromis, Paralabidochromis, Gasterosteus, Takifugu, Tetraodon)
Pink: positions shared by Protacanthopterygii (Osmerus, Salmo and Oncorhynchus) and Acanthopterygii (Oryzias, Fundulus, Ptyochromis, Paralabidochromis, Gasterosteus, Takifugu, Tetraodon)
Red: positions shared by the represented Acanthopterygii (Oryzias, Fundulus, Ptyochromis, Paralabidochromis, Gasterosteus, Takifugu, Tetraodon)
Figure S1: EDA
All vertebrate eda genes share the same structure of eight coding exons and highly conserved functional domains. The TNF like domain which is the part binding to the receptor is highly conserved (55% residues identical in all gnathostome sequences) as well as the collagen
domain which is likely to be implicated in multimerization (83% in all osteichthyan sequences). Moreover, one of the two furin cleavage sites found in mammals is fully conserved. In contrast the N-terminal part is much more variable. The two isoforms EDA-A1 and A2 can formally be encoded from every gnathostome gene. Another isoform, EDA-A5, is expressed in at least 3 tetrapods: Homo, Gallus and Xenopus. Of note, almost all mutations found in HED patients are found in residues conserved at the vertebrate level.
Figure S2: EDAR
The edar gene is extremely well conserved in vertebrates, with a common structure of 11 coding exons. This very high level of conservation is specific to this gene, when compared with the two other TNFR-like genes xedar and troy. It is illustrated by the extracellular domain containing the TNFR-like ligand binding domain, but also by the intracellular domain allowing signal transduction. Indeed, the TRAF2 and the TRAF6 binding sites are identical in all vertebrates and the backbone supporting them as well as the Death domain interacting with EDARADD are extremely well conserved (see black residues).
Figure S3: XEDAR
Within vertebrates, xedar diverges in terms of exonic structure, nature of the signaling domains, and more strikingly, in the sequence of the TNFR domain. The xedar gene structure is variable with six to nine exons. The cytoplasmic tail is highly divergent, except around the TRAF6 domain, and was difficult to predict in its totality from genomic data. Chicken as well as Taeniopygia genes have a supplementary C-terminal part encoding a death domain.
Figure S4: TROY