HAL Id: hal-02645706
https://hal.inrae.fr/hal-02645706
Submitted on 29 May 2020
HAL is a multi-disciplinary open access
archive for the deposit and dissemination of
sci-entific research documents, whether they are
pub-lished or not. The documents may come from
teaching and research institutions in France or
abroad, or from public or private research centers.
L’archive ouverte pluridisciplinaire HAL, est
destinée au dépôt et à la diffusion de documents
scientifiques de niveau recherche, publiés ou non,
émanant des établissements d’enseignement et de
recherche français ou étrangers, des laboratoires
publics ou privés.
Distributed under a Creative Commons Attribution - NonCommercial - ShareAlike| 4.0
spines controls synaptic excitability
Enora Moutin, F. Raynaud, Jonathan Roger, Emilie Pellegrino, Vincent
Homburger, Federica Bertaso, Vincent Ollendorff, Joël Bockaert, Laurent
Fagni, Julie Perroy
To cite this version:
Enora Moutin, F. Raynaud, Jonathan Roger, Emilie Pellegrino, Vincent Homburger, et al.. Dynamic
remodeling of scaffold interactions in dendritic spines controls synaptic excitability. Journal of Cell
Biology, Rockefeller University Press, 2012, 198 (2), pp.251-263. �10.1083/jcb.201110101 �.
�hal-02645706�
The Rockefeller University Press $30.00
E. Moutin and F. Raynaud contributed equally to this paper. Correspondence to Julie Perroy: julie.perroy@igf.cnrs.fr
Abbreviations used in this paper: BRET, bioluminescence resonance energy transfer; DHPG, dihydroxyphenylglycine; GKAP, guanylate kinase–associated protein; LTP, long-term potentiation; mEPSC, miniature excitatory postsynaptic current; NTA, nitrilotriacetic acid; shRNA, short hairpin RNA.
Introduction
Protein–protein interactions play key roles in cellular processes.
Identifying such multiprotein complexes has been a major issue
in the discovery of key biological pathways. Indeed, in their
natural environment, membrane receptors are associated with
scaffolding proteins that link them to their intracellular signal
transduction pathways and cytoskeleton. Such receptor-associated
scaffolds are relatively stable structures, but exchange of
in-dividual adaptor proteins can occur at a fast time scale and in a
highly regulated manner, which provides fine tuning, speed,
and specificity of the receptor signaling (Zeke et al., 2009).
Therefore, understanding how proteins are activated as free
molecules or part of complexes is an essential biological concern.
Currently, the molecular detail of the dynamics of these
inter-actions and the roles that they play in various cellular functions
are poorly defined because of the dearth of methods for acutely
and specifically controlling the binding interactions.
For instance, at brain synapses, scaffolding proteins
func-tion not only as anchors but also as signaling proteins for
neu-rotransmitter receptors. As synapses are dynamic structures, it
is a fundamental issue to study the dynamics of such synaptic
receptor scaffolds and their role in neurotransmission. Synaptic
transmission involves neurotransmitter receptors and ion
chan-nels. Their targeting, functioning, and dynamic exchanges at
synapses depend on their interaction with synaptic scaffolding
proteins (Renner et al., 2008). Glutamatergic neurotransmission
in the mammalian brain is mainly mediated by the ligand-gated
AMPA (2-amino-3-(5-methyl-3-oxo-1,2-oxazol-4-yl)propanoic
acid) and kainate receptor channels and modulated by NMDA
(N-methyl-d-aspartate) receptor channels and G protein–coupled/
metabotropic receptors (mGlu). Interestingly, group I mGlu
S
caffolding proteins interact with membrane
recep-tors to control signaling pathways and cellular
func-tions. However, the dynamics and specific roles of
interactions between different components of scaffold
complexes are poorly understood because of the dearth
of methods available to monitor binding interactions. Using
a unique combination of single-cell bioluminescence
resonance energy transfer imaging in living neurons and
electrophysiological recordings, in this paper, we depict
the role of glutamate receptor scaffold complex
remodel-ing in space and time to control synaptic transmission.
Despite a broad colocalization of the proteins in neurons,
we show that spine-confined assembly/disassembly of this
scaffold complex, physiologically triggered by sustained
activation of synaptic NMDA (N-methyl-
d-aspartate)
re-ceptors, induces physical association between ionotropic
(NMDA) and metabotropic (mGlu5a) synaptic glutamate
receptors. This physical interaction results in an mGlu5a
receptor–mediated inhibition of NMDA currents,
pro-viding an activity-dependent negative feedback loop
on NMDA receptor activity. Such protein scaffold
re-modeling represents a form of homeostatic control of
syn-aptic excitability.
Dynamic remodeling of scaffold interactions
in dendritic spines controls synaptic excitability
Enora Moutin,
1,2,3,4Fabrice Raynaud,
1,2,3,4Jonathan Roger,
1,2,3,4Emilie Pellegrino,
1,2,3,4Vincent Homburger,
1,2,3,4Federica Bertaso,
1,2,3,4Vincent Ollendorff,
5Joël Bockaert,
1,2,3,4Laurent Fagni,
1,2,3,4and Julie Perroy
1,2,3,41Centre national de la recherche scientifique, UMR-5203, Institut de Génomique Fonctionnelle, F-34000 Montpellier, Cedex 16, France 2Institut National de la Santé et de la Recherche Médicale, U661, F-34000 Montpellier, Cedex 13, France
3Université de Montpellier 1, UMR-5203, 34967 Montpellier, Cedex 02, France 4Université de Montpellier 2, 34095 Montpellier, Cedex 05, France
5UMR866 Dynamique Musculaire et Métabolisme, Institut National de la Recherche Agronomique, 34060 Montpellier, Cedex 01, France
© 2012 Moutin et al. This article is distributed under the terms of an Attribution– Noncommercial–Share Alike–No Mirror Sites license for the first six months after the pub-lication date (see http://www.rupress.org/terms). After six months it is available under a Creative Commons License (Attribution–Noncommercial–Share Alike 3.0 Unported license, as described at http://creativecommons.org/licenses/by-nc-sa/3.0/).
THE
JOURNAL
OF
CELL
BIOLOGY
on August 29, 2016
jcb.rupress.org
Downloaded from
Original image data can be found at:
http://jcb.rupress.org/content/suppl/2012/07/12/jcb.201110101.DC1.html Supplemental Material can be found at:
to the energy donors and acceptors, respectively, are indeed in
direct contact. We recently adapted BRET to single-cell
imag-ing analysis to study subcellular localization of protein–protein
interactions under microscope in living cells (Coulon et al., 2008;
Perroy, 2010). Here, we investigated by single-cell BRET
imag-ing the spatiotemporal remodelimag-ing of the interactions between
Homer proteins and mGlu5a receptor in cultured hippocampal
neurons and its consequence on NMDA receptor function. We
found that competition between Homer1a and multimeric Homer
proteins on mGlu5a receptor binding is virtually restricted to
dendritic spines. Such a scaffold remodeling triggers a direct
physical interaction between mGlu5a and NMDA receptors and
inhibition of NMDA currents. Our data also evidence that such
a regulation occurs after sustained activation of synaptic NMDA
receptors to restore synaptic NMDA current. Thus, this
remod-eling controls synapse excitability. To our knowledge, this is the
first study showing temporal dynamic remodeling of a
multipro-tein scaffold and its function at a subcellular level in living cells.
Results
Two different adaptor proteins, the long and short Homer isoforms, competitively interact with mGlu5a receptor
in living cells
The proline-rich Homer ligand domain (PPxxFr) identified on
mGlu5a receptor indifferently coimmunoprecipitates with the
short and long forms of Homer (Tu et al., 1998), suggesting that
competitive interaction may occur between the two Homer
iso-forms. We investigated the modality of these mutually exclusive
interactions in HEK-293 living cells by BRET. We fused the
C terminus of mGlu5a receptor to the energy donor Renilla
luciferase
(Rluc8) and the N terminus of the long Homer3 or
short Homer1a protein to the acceptor YFP (Myc-mGlu5a-Rluc8,
YFP-Homer, and YFP-Homer1a, respectively). The obtained
tagged proteins were functional (
Fig. S1, A and B
). Under the
condition of a constant level of Myc-mGlu5a-Rluc8 expression,
BRET signal increased hyperbolically as a function of
YFP-Homer1a or YFP-Homer expression level (Fig. 1 A). Saturation
of the BRET signal when all the donor was linked to the acceptor
indicated a specific interaction between the mGlu5a receptor and
Homer proteins. For a constant donor/acceptor ratio, the BRET
signal between Myc-mGlu5a-Rluc8 and either YFP-Homer1a or
YFP-Homer remained constant whatever the total level of
pro-tein expression (Fig. 1 B). By opposition, the point mutant
Myc-mGlu5a-P1124K-Rluc8, which could not interact with Homer
proteins (Tu et al., 1998), did not display BRET signal neither
with YFP-Homer1a nor YFP-Homer (Fig. 1 A). NMDA
recep-tor (NR1A-Rluc + NR2B) and YFP-Homer proteins did not
dis-play BRET signal either, confirming the specificity of interaction
between Homer proteins and the mGlu5 receptor.
To monitor competition between Homer1a and the long
form of Homer proteins for the binding to the mGlu5a receptor
in the same cell, we took advantage of the distinct spectral
properties of two luciferase substrates, coelenterazine H and
DeepBlueC coelenterazine (see Materials and methods). The
co-expression of Homer1a slightly reduced the binding of cotransfected
receptor (mGlu1 and mGlu5) and NMDA receptors are
physi-cally linked together in the postsynaptic density by a Homer
protein–containing complex (Brakeman et al., 1997; Scannevin
and Huganir, 2000). Functional interaction between the NMDA
and group I mGlu receptors has been extensively studied
(Gerber et al., 2007; Homayoun and Moghaddam, 2010), but
whether dynamic exchange of Homer proteins controls
func-tional cross talk between those receptors has received little
attention (Bertaso et al., 2010).
The Homer family of postsynaptic proteins displays an
EVH1 (Ena/Vasp homology) N-terminal domain, which
recog-nizes a proline-rich sequence (PPxxF) of protein partners. The
long forms of Homer proteins (Homer1b, Homer1c, Homer2,
and Homer3) display a central hinge region followed by a
C-terminal coiled-coil domain that is organized in two separate
regions, CC1 and CC2 (Hayashi et al., 2006). These proteins
are constitutively expressed in neurons and other cell types.
They form a tetrameric hub structure composed of two
anti-parallel dimers at the postsynaptic density (Hayashi et al., 2006).
This structure confers slow turnover rates and great efficiency
in coordinating dendritic spine functions. Shank proteins are
major components of the postsynaptic density that are
assem-bled in high-order complexes through self-association of their
sterile -motif C-terminal domain. Together with Homer
multi-mers, they are major constituents of a platform that cross-links
group I mGlu receptors to the guanylate kinase–associated
pro-tein (GKAP)–PSD95-NMDA receptor assembly in dendritic
spines (Baron et al., 2006). The short form of Homer proteins,
Homer1a, also displays an EVH1 domain but lacks of a
coiled-coil domain. Therefore, this protein can virtually bind to the
same targets as the long forms of Homer proteins but cannot
multimerize. This confers to Homer1a dominant-negative
prop-erties and the ability to disrupt Homer-associated multiprotein
complexes. In contrast to the long forms of Homer proteins,
Homer1a is an immediate early gene that is transiently expressed
after elevated neuronal activity or intake of drug of abuse
such as cocaine, amphetamine, LSD, phencyclidine, and nicotine
(Xiao et al., 2000; Fagni et al., 2002; Szumlinski et al., 2006,
2008). Homer1a plays fundamental physiological functions, such
as modulating synaptic plasticity and temporal encoding of
spatial memory (Celikel et al., 2007) or enabling homeostatic
scaling (Hu et al., 2010).
Because of its dominant-negative properties, Homer1a is
a viable mean that may trigger dynamic changes in the
associa-tion/dissociation of mGlu receptors to the GKAP-PSD95-NMDA
receptor assembly. Therefore, it is fundamental to depict the
spa-tiotemporal dynamics of mutually exclusive interactions of long
and short forms of Homer proteins with mGlu receptors.
Biolu-minescence resonance energy transfer (BRET) is a very
sensi-tive technology that became in the past decade a technology of
choice to study the dynamic of protein–protein interactions in
living cells (see Boute et al. [2002] and Pfleger and Eidne [2006]
for reviews about BRET). In this assay, the efficacy of the
en-ergy transfer depends on the close proximity (<10 nm) and
ori-entation of the donor and acceptor entities. The mean radius of
proteins being 5 nm, the occurrence of resonance energy
trans-fer is interpreted as a strong indication that the proteins attached
on August 29, 2016
jcb.rupress.org
Homer3 to the receptor (Fig. 1, C and D). Reciprocally, Homer3
expression impaired the interaction between Homer1a and
mGlu5a receptor but with significantly higher efficacy (Figs. 1
[E and F] and S1 [C–F]). Thus, concomitant detection of Homer1a
and Homer3 interactions with mGlu5a receptor in cells
co-expressing the three partners revealed that the competitive
bind-ing between the two Homer proteins on mGlu5a receptor occurred
in living cells. The shift in interaction between mGlu5a and
Homer induced by the presence of a concurrent Homer isoform
emphasized the apparent higher affinity of the receptor for the
multimeric Homer than for the monomeric Homer1a isoform.
Both long multimeric isoforms of Homer tested (Homer3 and
Homer1c) displayed similar affinity for the mGlu5a receptor
(in all the following experiments, the multimeric Homer3 was
used and referred to as Homer; Fig. S1 G).
In living neurons, the competition between long and short Homer isoforms on mGlu5a is confined to dendritic spines
We further studied mGlu5a receptor–Homer interactions in
cul-tured hippocampal neurons by BRET imaging. The highest
BRET signals between mGlu5a-Rluc8 and the multimeric form
of Homer, YFP-Homer, were found in the neurites, as compared
with the cell body. Despite a similar mean BRET intensity,
quantification of the high SD indeed indicates a clusterization
in neurites (Fig. 2 A). We then compared BRET signals in the
dendritic spine and shaft. Spines were chosen according to their
morphological criteria using the YFP-Homer fluorescence: a
protrusion composed of a large spine head (diameter ranging
from 0.5 to 1.0 µm) connected to the dendrite via a membranous
neck. BRET images revealed the highest intensity of BRET
signals between mGlu5a-Rluc8 and YFP-Homer confined to
spines (image 535/480 in Fig. 2 [B–D]). Interestingly, this occurred
despite colocalization and equal abundance of the two proteins
in both the dendritic shaft and spine (image Em480 for
mGlu5a-R
luc8 and image GFP for YFP-Homer in Fig. 2 B). In contrast
to the interaction between multimeric Homer and mGluR5, the
interaction between the mGlu5a-Rluc8 and the monomeric
form, YFP-Homer1a, was equally distributed in the cell body
and neurites (Fig. 2 A). Importantly, the long-term expression
of transfected Homer1a induced dramatic decrease in spine
number and size, which was consistent with the previously
de-scribed inhibitory effect of the protein on synaptic transmission
(Sala et al., 2003). This effect on dendritic spines hampered
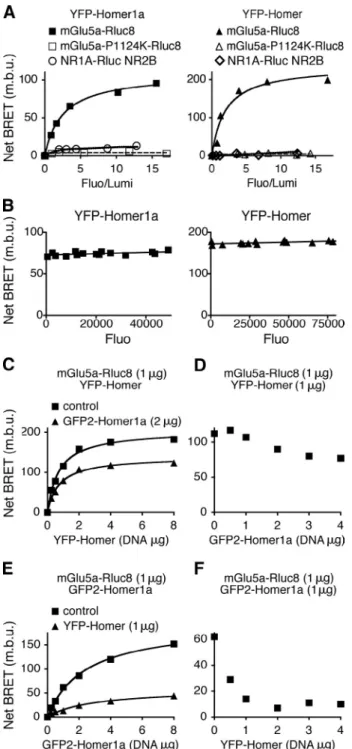
Figure 1. The long and short Homer isoforms specifically and competitively interact with mGlu5a receptor in living cells. (A) Cells were cotransfected with a constant concentration of mGlu5a-Rluc8 or mGlu5a-P1124K-Rluc8 and increasing concentrations of YFP-Homer1a (left) or YFP-Homer3 (re-ferred to as YFP-Homer; right) expression plasmids. To exclude a direct action of Homer proteins on NMDA receptors, the BRET between NR1A-Rluc + NR2B and YFP-Homer1a or YFP-Homer3 was also monitored. Fluo, fluorescence; Lumi, luminescence; m.b.u., milli-BRET unit. (B) The BRET sig-nal is independent of the total level of protein expression, thus reporting a specific interaction, providing that the ratio of acceptor/donor remains constant. Therefore, cells were transfected with a constant ratio (fluores-cence/luminescence of 5.1 ± 0.5 [left] and 5.6 ± 0.5 [right]) of YFP-Homer1a/mGlu5a-Rluc8 (left) or YFP-Homer/mGlu5a-Rluc8 (right) and various concentrations of total plasmids. (C–F) Cells were transfected with the following plasmids: mGlu5a-Rluc8, GFP2-Homer1a, and YFP-Homer.
Coelenterazine H (BRET1; C and D) or DeepBlueC coelenterazine (BRET2;
E and F) was added on two distinct pools of the same population of trans-fected cells to monitor concomitantly BRET between mGlu5a-Rluc8 and YFP-Homer or GFP2-Homer1a, respectively. Titration curves (C and E) were
obtained in the presence of constant concentration of mGlu5a-Rluc8 and increasing concentrations of YFP-Homer, with or without GFP2-Homer1a
(C) or increasing concentrations of GFP2-Homer1a with or without
YFP-Homer (E). Dose-response competitions (D and F) were measured between constant concentration of mGlu5a-Rluc8 and YFP-Homer for increasing concentration of GFP2-Homer1a (D) or constant concentration of
mGlu5a-Rluc8 and GFP2-Homer1a in the presence of increasing concentration of
YFP-Homer (F). Displacement of the interaction between mGlu5a receptor and a given isoform by the other isoform of Homer indicates a competitive interaction between the two Homer proteins for the receptor. (A–F) For each condition, data are representative of five independent experiments performed in triplicate.
on August 29, 2016
jcb.rupress.org
reliable experiments of precise dendritic localization and
phy-sical interaction between mGlu5a-Rluc8 and YFP-Homer1a.
To bypass this long-term effect of Homer1a, the protein
was conjugated to the cell membrane transduction domain of
the HIV-1 TAT protein (TAT-Homer1a). TAT-conjugated
pro-teins can cross the plasma membrane, thus allowing their acute
cell internalization (Dietz and Bähr, 2005). We verified that this
also applied to TAT-Homer1a (
Fig. S3
). A 10-min perfusion of
TAT-Homer1a, but not a TAT-HomerW24Y protein (a point
mutation that selectively abolished the interaction of Homer1a
with mGlu5a; Fig. S1 H; Beneken et al., 2000), decreased
the BRET signal between mGlu5a-Rluc8 and YFP-Homer
in a dose- and time-dependent manner (Fig. 3 A). Consistently,
BRET imaging revealed that the spine-confined basal
inter-action between YFP-Homer and mGlu5a-Rluc8 was disrupted by
acute perfusion of TAT-Homer1a but not a TAT-HomerW24Y
protein (Fig. 3 B). In basal condition, BRET pixel distribution
in dendritic shaft versus spines, expressed as a function of BRET
intensity, further showed the existence of high-intensity BRET
signals between the receptor and Homer in spine solely, whereas
TAT-Homer1a shifted the pixel distribution in the spine to
lower BRET values undistinguishable from the basal signal in
the shaft (in the presence of Homer1a, BRET ratio in the spine
was shifted from 364 + 57% to 101 + 19% of mean BRET in the
shaft; n = 8; Fig. 3, C and D). These experiments put emphasis
on the efficiency of Homer1a to disrupt the association of
mGlu5a receptor with multimeric forms of Homer specifically
in the spine.
Dynamics of mGlu5 receptor–Homer complex control physical and functional cross talk between mGlu5a and NMDA receptors in hippocampal neurons
In a heterologous expression system, NMDA and mGlu5a
re-ceptors can directly interact and display constitutive mutual
inhibition (Perroy et al., 2008). In neurons, however, the
con-straints that result from the link between the C terminus of these
receptors with the Homer-Shank-GKAP-PSD95 scaffold might
preclude the direct mGlu5a–NMDA receptor association.
Con-sistent with this hypothesis, although Rluc8-mGlu5a (Em480
image in Fig. 4 A) and YFP-NR1A + NR2B subunits (GFP
image in Fig. 4 A) clearly colocalized in the dendritic shaft and
spine, BRET signals between these tagged proteins remained
close to noise in both cell compartments (control condition
535/480 image in Fig. 4 A). This suggested that the NMDA and
mGlu5a receptors did not interact in control hippocampal
neu-rons, although both receptors were present in the same dendritic
spine. We reasoned that disassembly of the synaptic multimeric
Homer–mGlu5a receptor complex by Homer1a would allow
physical and functional interactions between NMDA and mGlu5a
receptors. Consistent with this hypothesis, after a 10-min
incu-bation with TAT-Homer1a (50 nM), BRET spots of high
inten-sity appeared in spines (TAT-Homer1a condition; 535/480
image in Fig. 4 A), thus highlighting the occurrence of confined
mGlu5a and NMDA receptor putative physical interactions. In
basal condition, BRET pixel distribution did not differ in the
dendritic shaft versus spines. On the other hand, two distinct
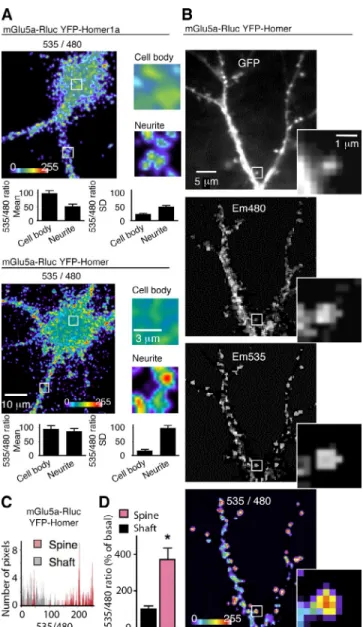
Figure 2. mGlu5a interaction with multimeric Homer in neurons is con-fined to dendritic spines. (A–D) In this and the following figures, experi-ments were performed in cultured hippocampal neurons, unless specified otherwise. Neurons were transfected with mGlu5a-Rluc8 and YFP-Homer (except for the top image in A, in which neurons expressed mGlu5a-Rluc8 and YFP-Homer1a). (A) BRET was imaged on neurons and zoomed in a 5 × 5–µm area on the neurite and cell body. Insets show magnified images of the boxed areas on the left. Histograms show the quantification of the mean BRET intensity and the SD in each area. Note that the highest BRET signals between mGlu5a and Homer were found in the neurites, as com-pared with the cell body, and that the high SD indicates a clusterization in dendrites (bottom). By opposition, the BRET signal between mGlu5a and Homer1a appeared homogenous in neurons (top). (B) The pictures show expression of YFP-Homer (GFP), mGlu5a-Rluc8 (Em480), YFP-Homer excited by energy transfer (Em535), and BRET signals generated by the two tagged proteins (535/480) within a 2.5 × 2.5–µm area zoomed on the framed spine. Note that although mGlu5a and Homer proteins were both present in the dendritic shaft and spine, the highest intensity BRET signals are located in the spines, indicating a preferential interaction of the two proteins in this cell compartment. (C) The histogram represents BRET pixel distribution as a function of BRET intensity in spines and adjacent dendritic shaft regions (n = 10) of a representative neuron. (D) BRET intensity was measured in the dendritic spine and shaft (mean ± SEM of 10 neurons; 7–10 regions per neuron; *, P = 0.05).
on August 29, 2016
jcb.rupress.org
directly interact, resulting in inhibition of NMDA current
(Perroy et al., 2008), we hypothesized that the present
Homer1a-induced inhibition of NMDA current could result from disruption
of endogenous mGlu5a receptor–multimeric Homer complexes
by Homer1a allowing physical interaction of mGlu5a with
NMDA receptors. To test this hypothesis, we used the Homer1a
point mutant, HomerW24Y, which cannot interact with mGlu5a
(Fig. S1 H) and therefore could not disrupt the interaction
between mGlu5a and the multimeric Homer (Fig. 3). This
Homer1a mutant had no effect on whole-cell NMDA currents
(Fig. 5 A), showing that to inhibit NMDA currents, Homer1a
needs to interact with mGlu5a receptor. This mGlu5a–Homer1a
interaction would relax mGlu5a from the physical constraint of
the scaffold. We also used an alternative manner to disrupt the
scaffold, achieved by coexpression of the C terminus of the
mGlu5a receptor, which quenched mGlu5a receptor partners
(Mao et al., 2005). This led to similar NMDA current inhibition
(55.3 ± 5.3% decrease; n = 8; Fig. 5 B) and prevented additional
effects of Homer1a on NMDA current (Fig. 5 B). By opposition,
distributions clearly appeared after TAT-Homer1a incubation
(but not TAT-HomerW24Y), with the highest- and lowest-pixel
intensities in spines and the dendritic shaft, respectively (Fig. 4 B).
Statistical analyses further confirmed such a Homer1a-induced
spine-restricted interaction between Rluc8-mGlu5a and
YFP-NR1a + NR2B, as the basal BRET ratio in spine over shaft was
shifted from 1.05 ± 0.24 to 1.77 ± 0.12 (n = 8) in the presence
of Homer1a (Fig. 4 C). These data show that although mGlu5a
and NMDA receptors colocalized in neurons, the receptors
were in sufficient proximity to directly interact with each other,
only in the presence of Homer1a and specifically in spines.
We further investigated the functional consequences of
such a protein scaffold remodeling and consequent physical
interaction between receptors on NMDA currents. Interestingly,
in nontransfected hippocampal neurons, whole-cell NMDA
currents were strongly decreased after TAT-Homer1a exposure
(57.7 ± 7.1% decrease; n = 8; Fig. 5 A). Based on previous
observations showing that, in HEK cells (i.e., in the absence of
scaffolding protein expression), NMDA and mGlu5 receptor
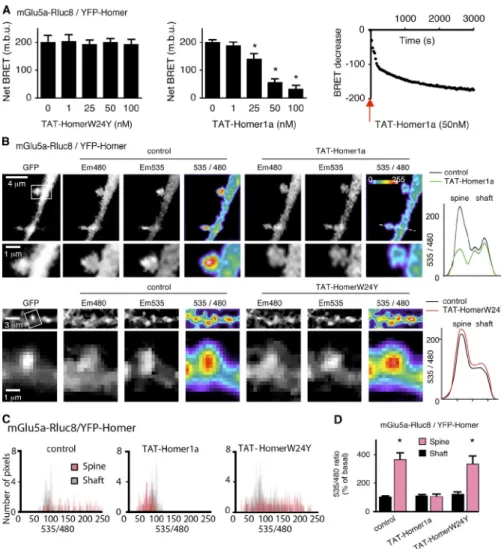
Figure 3. Homer1a disrupts the interaction between Homer and mGlu5a receptor in den-dritic spines. (A) HEK293 cells were trans-fected with mGlu5a-Rluc8 and YFP-Homer. BRET signals were monitored 10 min after addition of the indicated concentrations of either TAT-HomerW24Y (left) or TAT-Homer1a (middle) and during 50 min in the presence of 50 nM TAT-Homer1a (right). The graphs show loss of interaction between mGlu5a receptor and Homer in the presence of TAT-Homer1a but not TAT-HomerW24Y (left, middle). This occurred in <5 min after the beginning of ap-plication to the TAT-Homer1a protein (right). The red arrow represents the application of the TAT-Homer1a protein. Each bar of his-togram represents the mean ± SEM of four experiments performed in triplicate. The as-terisk represents significant difference from the BRET in absence of TAT. m.b.u., milli-BRET unit. (B–D) BRET images (B) and measurements (C and D) were obtained in neurons transfected with mGlu5a-Rluc8 and YFP-Homer before (control) and after exposure to TAT-Homer1a or TAT-HomerW24Y (50 nM; 10 min). (B) The pictures show expression of YFP-Homer (GFP), mGlu5a-Rluc8 (Em480), YFP-Homer excited by energy transfer (Em535), and BRET signals gen-erated by the two tagged proteins (535/480). The right graphs indicate the profiles of the 535/480 ratio values along the dotted lines crossing the spine and shaft shown in the image before and after Homer1a or TAT-HomerW24Y perfusion. Bottom images show magnifications of the boxed areas. (C) BRET pixel distribution in spines and adjacent den-dritic shaft regions (n = 10) of a representative neuron before (control) and after perfusion of TAT-Homer1a or TAT-HomerW24Y. (D) Mean BRET intensity in the dendritic spine and shaft before (control) and during exposure to TAT-Homer1a or TAT-HomerW24Y. Each bar of the histogram represents the mean ± SEM obtained from eight neurons and 7–10 regions/neuron. Note that in the presence of Homer1a, BRET signal between mGlu5a-Rluc8 and YFP-Homer decreased in spines but not the shaft. *, P = 0.05.
on August 29, 2016
jcb.rupress.org
As previously shown (Lu et al., 2001; Park et al., 2004),
pro-longed stimulation of NMDA receptors by the coagonist glycine
(200 µM; 3 min) successfully induced LTP in primary culture of
hippocampal neurons (Figs. 6 [A–C] and
S4
). Indeed, the glycine
treatment significantly increased the amplitude and frequency of
miniature excitatory postsynaptic currents (mEPSCs), and this
effect remained stable for >60 min after glycine washout (mEPSC
frequency and amplitude were increased by 40 ± 10 and 34 ± 7%
[mean ± SEM; n = 8], respectively; Fig. 6 B). Consistently,
gly-cine treatment also increased the size of the spine head and the
level of AMPA receptors expressed at the cell surface (Fig. S4,
B and C). Interestingly, this sustained activation of synaptic
NMDA receptor successfully triggered Homer1a transcription
and expression (Fig. 6, D and E). We found that sustained
activa-tion of synaptic NMDA receptor (a 3-min applicaactiva-tion of glycine/
strychnine followed by washout of the drugs) also triggered
BRET signals between NMDA (YFP-NR1a + NR2B) and
Rluc8-mGlu5a receptors in the spine. The BRET was detectable 30 min
after the glycine application and persisted for at least 60 min
(Fig. 6 F). Such a kinetic correlated with the time course of
Homer1a induction (Fig. 6 E). To characterize the effect of
glycine treatment on synaptic AMPA and NMDA receptors, we
analyzed the fast and slow components of mEPSCs (Fig. 6 C),
which are carried by AMPA and NMDA currents, respectively
(Fig. S4 A). The glycine treatment increased the amplitude of the
synaptic AMPA component of mEPSCs for at least 60 min (which
was consistent with the aforementioned increase in mEPSCs
amplitude). The NMDA component of mEPSCs also strongly
increased but only transiently. Indeed, the current progressively
recovered to its control value (Fig. 6 C). Thus, after sustained
activation of synaptic NMDA receptor, there is a strong temporal
correlation between Homer1a induction, mGlu5a–NMDA
recep-tor interaction in the spine head, and inhibition of mEPSC
NMDA receptor component (Fig. 6). All of these evidences favor
the hypothesis of a role of the Homer1a-dependent mGlu5–
NMDA receptor interaction to inhibit synaptic NMDA current.
the mGlu5a–C terminus point mutant (P1124K), which cannot
interact with Homer proteins, had no effect on the NMDA
cur-rents and did not impair their inhibition by Homer1a (Fig. 5 B).
Disengagement of the mGlu5a receptor would favor its direct
interaction with NMDA receptor and functional blockade of
NMDA receptors. Accordingly, depletion of mGlu5a receptor
expression by specific short hairpin RNAs (shRNAs) significantly
reduced the TAT-Homer1a–induced inhibition of NMDA
currents (Fig. 5 C). Importantly, the potency of Homer1a to
in-duce inhibition of NMDA currents was correlated to the amount
of mGlu5a receptor expression (Fig. 5, C and D). To rule out
unspecific targets of the mGlu5 shRNAs, we verified that the
loss of Homer1a-induced inhibition of NMDA currents could
be rescued by overexpression of the mGlu5a receptor (Fig. 5 E).
Finally, blocking the activity of mGlu5 receptor with a specific
antagonist, MPEP (2-methyl-6-(phenylethynyl)-pyridine; 10 µM),
was not sufficient to abolish the Homer1a-dependent
suppres-sion of NMDA currents (Fig. 5 F), suggesting that the removal
of mGlu5a protein was required. Collectively, these results
showed that inhibition of NMDA currents by Homer1a requires
the interaction of Homer1a with mGlu5. Homer1a-induced
dis-sociation of the mGlu5a receptor from multimeric Homer
com-plex allowed, in turn, association between mGlu5a and NMDA
receptors and inhibition of the NMDA current.
Molecular Homer–mGlu5 receptor complex reorganization occurs after sustained activation of synaptic NMDA receptors
Homer1a protein expression is very low or virtually absent in
resting neurons. Elevated neuronal activity induced by
psycho-stimulants (Brakeman et al., 1997) or sustained NMDA receptor
stimulation (Sato et al., 2001), which eventually results in
long-term potentiation (LTP) of synaptic transmission (Kato et al.,
1997), can induce expression of the protein in neurons. Therefore,
we examined whether Homer1a-induced mGlu5a–NMDA
recep-tor interaction occurred after NMDA receprecep-tor–sustained activity.
Figure 4. Homer1a–mGlu5a interaction enables physical association of mGlu5a with NMDA receptors in spine. (A–C) BRET images (A) and analyses (B and C) obtained in neurons transfected with Rluc8-mGlu5a and YFP-NR1A + NR2B expression plasmids. (A) BRET images acquired before (control) and after incubation with TAT-Homer1a (50 nM; 10 min). From left to right, images revealed expression of NR1A (GFP) and Rluc8-mGlu5a (Em480), YFP-NR1A excited by the energy transfer (Em535), and BRET between Rluc8-mGlu5a and YFP-NR1A (535/480). The boxed area in the GFP picture was enlarged below. The graph on the right represents the profile of the 535/480 ratio values along the dotted line before (con-trol) and after TAT-Homer1a exposure. (B) Pixel distribution in spines and adjacent dendritic shaft regions (n = 10) before and after appli-cation of TAT-Homer1a or TAT-HomerW24Y. (C) Mean BRET intensity in the dendritic spine and shaft before (control) and during exposure to TAT-Homer1a or TAT-HomerW24Y. Each bar of the histogram represents the mean ± SEM obtained from eight neurons and 7–10 regions/neuron. *, P = 0.05.
on August 29, 2016
jcb.rupress.org
(Fig. 7 A). On the other hand, knockdown of endogenous
Homer1a by siRNA abolished BRET signals between the two
receptors 30 min after glycine treatment (inset in Fig. 7 B).
These results strongly suggest that induction of Homer1a by
sustained activation of synaptic NMDA receptors can trigger
physical and functional interaction between mGlu5a and NMDA
receptors, thus leading to down-regulation and recovery of
synaptic NMDA currents while leaving synaptic AMPA current
potentiation unaffected.
Discussion
Several studies have suggested that the temporal and spatial
dynamics of protein–protein interactions is crucial to specify
synaptic membrane receptor and channel signaling (Sala et al.,
2001; Fagni et al., 2002; Renner et al., 2008; Zeke et al., 2009;
Sainlos et al., 2011). Thanks to recent development in
single-cell BRET imaging (Coulon et al., 2008; Perroy, 2010), we
have examined this issue by studying the competitive binding
of the monomeric Homer1a and multimeric Homer with the
neurotransmitter mGlu5a receptor at synapses of living neurons.
We found that the competitive interactions between mGlu5a
To further examine the direct implication of Homer1a in
synaptic mGlu5a–NMDA receptor interaction and inhibition of
synaptic NMDA current, we perfused the TAT-Homer1a
pro-tein immediately after glycine application. Remarkably, the
TAT-Homer1a, but not TAT-HomerW24Y, decreased NMDA
synaptic currents 10 min after glycine washout (Fig. 7 A). This
delay corresponded to the time required for the TAT-Homer1a
protein to enter the cell and to abolish BRET signals between
Homer and mGlu5a receptor (Fig. 3 A). By opposition, the
knockdown of Homer1a by a mix of two specific siRNAs (see
Materials and methods) blocked the induction of Homer1a
expression after sustained activation of synaptic NMDA
recep-tors (
Fig. S5
) and abolished the recovery of synaptic NMDA
current (Fig. 7 B). However, this siRNA-induced loss of
post-synaptic NMDA current inhibition was rescued by perfusion of
TAT-Homer1a at the end of the experiment. These
electrophys-iological experiments were systematically correlated to BRET
imaging between mGlu5a and NMDA receptors. In the
pres-ence of TAT-HomerW24Y, which does not interact with mGlu5a
receptor, no BRET signal was detected 10 min after glycine
washout. By opposition, TAT-Homer1a treatment induced BRET
signals between mGlu5a and NMDA receptors in the spine
Figure 5. Homer1a–mGlu5a interaction enables inhibition of NMDA currents. (A) NMDA-induced currents recorded in nontransfected neurons be-fore (100% NMDA current at time 0 s) and during sequential perfusion of HomerW24Y and TAT-Homer1a proteins. Horizontal bars above each trace represent application of 100 µM NMDA. Each plot represents the mean ± SEM obtained from eight neurons (asterisks represent significant difference from NMDA current before TAT perfu-sion). (B) NMDA current density (top) and percent-age of TAT-Homer1a–induced inhibition of NMDA current (bottom) measured in neurons transfected or not with mGlu-Cterm (to quench Homer1a) or mGlu-Cterm-P1124K (which cannot interact with Homer proteins). Each bar of the histogram rep-resents the mean ± SEM obtained from eight neu-rons. *, P = 0.05. (C and D) Neurons transfected with shRNA1 or shRNA2 and GFP (transfection
reporter) were used for either NMDA-induced cur-rent recording (C; same legend as in A) or immuno-staining with an anti-mGlu5 antibody (D; boxed areas are magnified to the right of each image). (D, bottom) Quantification within a dendritic area of 5 µm × 15 µm. (E) Neurons transfected with shRNA1, GFP (transfection reporter), and
Myc-mGlu5a were immunolabeled with an anti-Myc antibody in nonpermeabilized conditions (top) or used to record NMDA-induced currents (bottom; same legend as in A). (F) Percentage of NMDA current in the presence of the mGlu5a antagonist (MPEP; 10 µM) before and after TAT-Homer1a perfusion. *, P = 0.05. (D and F) Each bar of histo-gram represents the mean ± SEM obtained from eight neurons.
on August 29, 2016
jcb.rupress.org
of the long-term expression of transfected Homer1a prevented
the direct analysis of the BRET between Homer1a and mGlu5a
receptor in spines. However, it is important to note that the
competition between TAT-Homer1a and Homer to interact
with the receptor in spines indeed attested the occurrence of
Homer1a–mGlu5a interaction in the spine as well (Fig. 3, B–D).
The occurrence of Homer1a–mGlu5a interaction in the spine
was further supported by the spine-confined interaction between
mGlu5a and NMDA receptors after Homer1a expression
induced by glycine stimulation (Fig. 7 B). These observations
further support the notion that competition between long and
short Homer isoforms on mGu5 receptors at synaptic sites may
control neurotransmission.
Competition between the monomeric Homer1a and
multi-meric Homer proteins on mGlu5 receptor depends on the level
of Homer1a expression, the relative affinity of the Homer
pro-teins for their target, and the subcellular localization of these
partners. The apparent higher affinity of multimeric versus
mono-meric Homer for the mGlu5a receptor might be explained by
the dimeric state of the receptor, which would favor cooperative
receptor and Homer proteins was restricted to specific
subcellu-lar compartments (dendritic spines), precisely where synaptic
transmission takes place. Interaction with Homer1a and
disso-ciation with Homer resulted in mGlu5a–NMDA receptor
asso-ciation and NMDA current inhibition. We further showed that a
sustained activation of synaptic NMDA receptors triggered the
expression of endogenous Homer1a, interaction between
syn-aptic mGlu5a and NMDA receptors, and inhibition of
postsyn-aptic NMDA currents. These results provide, for the first time,
a physiological role for dynamic remodeling of a receptor
scaf-fold (the postsynaptic glutamate receptor scafscaf-fold) and its
cellular function (the control of synaptic excitability; Fig. 8).
Despite nonpreferential distribution of the transfected
Homer protein and mGlu5 receptor in mature hippocampal
neu-rons, we found that the mGlu5a receptor interacts with Homer
exclusively in spines. Consistent with this finding, transfection
of long or short Homer isoforms results in spine enlargement or
drastic reduction of spine density, respectively, in hippocampal
neurons (Sala et al., 2001; Szumlinski et al., 2005; Tappe et al.,
2006; Jaubert et al., 2007). This drastic loss of spines as a result
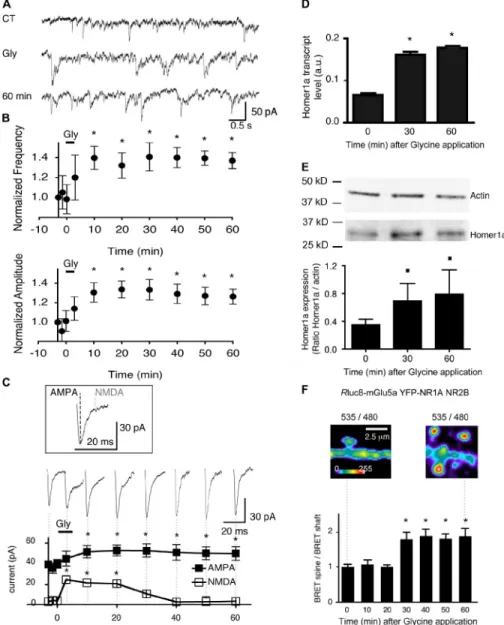
Figure 6. Synaptic NMDA receptor activa-tion triggers Homer1a endogenous expres-sion, physical interaction between NMDA and mGlu5a receptors in the spine, and inhibition of postsynaptic NMDA currents. (A) mEPSCs recorded at 60 mV before (C terminal), dur-ing (Gly), and 60 min after (60 min) synaptic NMDA receptor stimulation (200 µM glycine for 3 min). (B) Amplitude and frequency of mEPSCs, normalized to values obtained at time 0 s before and 60 min after application of gly-cine (mean ± SEM; n = 8 neurons). Asterisks represent significant differences from the sig-nal before glycine application. (C) Mean of 50 mEPSCs showing the AMPA and NMDA postsynaptic current components. Dotted lines show the times (at the peak and 7 ms later for the AMPA and NMDA components, respec-tively) at which measurements were performed on the averaged mEPSCs. The sequential traces and graph below show persistent potentiation of the AMPA component and prominent NMDA current component during and after applica-tion of glycine. Asterisks represent significant differences from the signal before glycine ap-plication. Error bars are SEM. (D and E) Level of Homer1a mRNA assessed by quantitative PCR (D) and Homer1a protein quantified by Western blot and divided by the expression of actin as a control for protein loading (E) in hip-pocampal neurons before (time 0), 30, and 60 min after glycine application. The histograms represent the mean ± SEM obtained from three individual experiments. Squares represent sig-nificant differences at P < 0.10. *, P = 0.05. a.u., arbitrary unit. (F) Neurons transfected with Rluc8-mGlu5a, YFP-NR1A, and NR2B expres-sion plasmids. BRET images were acquired before (left) and 60 min after (right) glycine ap-plication. Note the increase in BRET signal in dendritic spines. The histogram represents the ratio between dendritic spine and shaft BRET values before (time 0), 30, and 60 min after glycine application. The histogram represents the mean ± SEM obtained from eight neurons and four to seven regions per neuron for each time condition. *, P = 0.05.
on August 29, 2016
jcb.rupress.org
would disrupt the interaction between this receptor and
the PSD95–GKAP–Shank–Homer scaffold complex, thus
allowing the mGlu5 receptor to directly interact with and
inhibit the NMDA receptor. The dual role of group I mGlu
receptors on NMDA receptors in neurons may rely on the
presence or absence of Homer1a and on the integrity of the
mGlu5–Homer–Shank–GKAP–PSD95–NMDA receptor
com-plex. By disrupting the scaffolding complex, Homer1a may
affect mGlu5a as well as NMDA receptor complex
localiza-tion. Studies are currently in progress in our laboratory to
further address the precise movement of glutamate receptors
and their rearrangement in the postsynaptic density.
Homer1a expression is regulated by neuronal activity
(Brakeman et al., 1997; Kato et al., 1997). Here, we could
in-duce Homer1a expression by sustained activation of synaptic
NMDA receptors, and this was necessary and sufficient to
pro-mote physical interaction between mGlu5a and NMDA
recep-tors in dendritic spines as well as to scale down postsynaptic
NMDA currents. It has been previously reported that
NMDA-dependent LTP is blocked in transgenic mice expressing
hippocampal-specific tetracycline-inducible Homer1a (Celikel
et al., 2007). This may result from the herein-described
Homer1a-induced inhibition of NMDA currents, as in this transgenic
mouse, Homer1a was induced before application of the LTP
stimulus. This hypothesis was further confirmed by applying
TAT-Homer1a before glycine stimulation. In this condition,
TAT-Homer1a disrupted the integrity of the scaffold in spines
binding of the multimeric over monomeric Homer isoform
(Sainlos et al., 2011). Nevertheless, native Homer1a, even at a
relatively low level, can affect group I mGlu receptor signaling
in neurons (Kammermeier, 2008). Consistent with this result,
the displacement of multimeric Homer interaction with the
mGlu5a receptor by coexpressed Homer1a was quite efficient.
In light of these results, sufficient Homer1a expression would
be required to displace Homer–mGlu5a receptor interaction,
and this may restrain the phenomenon to particular conditions,
such as induction of synaptic plasticity (Ronesi and Huber, 2008)
or after drug-of-abuse intake, epilepsy, or chronic pain (Tappe
et al., 2006; Szumlinski et al., 2008).
Our results also show that the delicate balance of Homer
protein interactions would control mGlu5a receptor functions.
Thus, interaction of Homer1a with mGlu5a receptor triggers a
direct inhibition of NMDA channel by mGlu5a receptor. The
func-tional modulation of NMDA receptor channels by group I mGlu
receptors is highly debated. Both synergism (Aniksztejn et al.,
1992; Harvey and Collingridge, 1993; Doherty et al., 1997; Ugolini
et al., 1997; Awad et al., 2000; Attucci et al., 2001) and mutual
antagonism (Anwyl, 1999; Bortolotto et al., 1999; Kotecha et al.,
2003; Perroy et al., 2008; Bertaso et al., 2010) have been
ob-served in neurons of various brain regions. The mGlu5a
recep-tor is physically linked to the Shank–GKAP–PSD95–NMDA
receptor complex by multimeric Homer proteins. Herein, we
suggest that competition between monomeric Homer1a and
multimeric Homer on the binding domain of mGlu5 receptor
Figure 7. After activation of synaptic NMDA re-ceptors, Homer1a is necessary and sufficient to in-duce mGlu5a–NMDA interaction and inhibition of NMDA receptor. (A and B) Mean of 50 mEPSCs re-corded at different times before, during, and after the application of glycine (top). The graphs repre-sent the mean (±SEM; n = 8) of AMPA and NMDA components of mEPSCs (middle). BRET images were obtained at the indicated times after wash-out of glycine (bottom). Calibration bars apply to A and B. (A) TAT-HomerW24Y (black traces) or TAT-Homer1a (green traces) was perfused imme-diately after glycine application. Note that TAT-Homer1a accelerated the inhibition of the NMDA component of mEPSCs after washout of glycine, as compared with the inactive TAT-HomerW24Y. Asterisks indicate that NMDA current is significantly different in TAT-Homer1a and TAT-HomerW24Y conditions at the same time after glycine applica-tion. BRET images show that interaction between mGlu5a and NMDA receptor in the presence of TAT-Homer1A (but not TAT-HomerW24Y) occurs in spines at the same time as postsynaptic NMDA current is inhibited. (B) 2 d before electrophysi-ological recordings, neurons were transfected with control siRNA (black traces) or Homer1a siRNA (red traces). Note that Homer1a siRNA (but not control siRNA) prevented the recovery of NMDA current. Asterisks indicate that NMDA current is significantly different in Homer1a siRNA and con-trol siRNA conditions at the same time after glycine application. TAT-Homer1a perfusion restored the inhibition of postsynaptic NMDA currents. 30 min after washout of glycine, BRET images show that Homer1A siRNA (but not control siRNA) prevented mGlu5a–NMDA receptor interaction in the spine.
on August 29, 2016
jcb.rupress.org
feedback control is thus crucial for homeostasis of synaptic
excitability and tenacity.
This work highlights the importance of the association/
dissociation dynamics of multiprotein complexes in receptor
functions and cell physiology. Neurotransmitter and hormone
receptors can no longer be seen as cell surface–isolated entities.
Regulations of receptor signaling by dynamic changes in
receptor-associated complex that we described here can be taken as a
template to study other high-order modulatory mechanisms in
various systems. Thus, similar remodeling of multiprotein
assemblies by environmental factors would define a given cell
status, which in turn would influence subsequent cellular
res-ponses, depending on the history of the cell.
Materials and methods
Plasmids, shRNA, and siRNA
DNA plasmids containing the ORF for Myc-mGlu5a-Rluc8, Homer1a, Homer3, or the NR2B subunit of NMDA receptors were encoded under control of cytomegalovirus promoter in pcDNA3.1-Myc-mGlu5a-Rluc8, pRK5-Homer1a, pRK5-Homer3, or p3apA-e2-NR2B, respectively, as previ-ously described (Ango et al., 1999; Coulon et al., 2008; Perroy et al., 2008). Homer proteins tagged at their N terminus with either YFP or GFP2
were used for BRET experiments. The coding sequences of Homer1a or Homer3 were added in-frame to the 3 end coding sequence of YFP or GFP2 in their respective pcDNA3.1 plasmids to obtain
pcDNA3.1-YFP-Homer1a, pcDNA3.1-YFP-Homer3, and pcDNA3.1-GFP2-Homer1a. For
BRET experiments between receptors, tags were added in the extracellular N terminus part of the receptors to avoid any interference with the protein interactions on their cytosolic tail. The Rluc8 tag (a gift from A. De and A. Loening, Stanford University, Stanford, CA) was added in-frame between the 3 end of the signal peptide and the 5 end coding sequence of mGlu5a receptor to obtain pRK5-Rluc8-mGlu5a. The YFP-NR1A construct was engi-neered by inserting a YFP cDNA fragment in-frame with the NR1-1a subunit after the predicted sequence for signal peptide (MSTMHLLTFALLFSCSFARAA) to obtain the p-YFP-NR1a plasmid. pRK5-cherry-CD4-mGlu-Cterm was
(Fig. 3), enabled NMDA and mGlu5a receptor interaction (Fig. 4),
and totally prevented the induction of LTP (Fig. 9). Indeed, in
the presence of TAT-Homer1a, neither NMDA nor AMPA
cur-rent was affected by glycine stimulation (Fig. 9). These effects
were consistent with the blockade of NMDA receptors and
NMDA-dependent AMPA receptor LTP by Homer1a. Thus,
during elevated synaptic activity and synaptic plasticity, induced
Homer1a would trigger mGlu5a receptor–mediated
down-regulation of synaptic NMDA currents and scale down synaptic
excitability. Dysfunction of such a mechanism may engender
neuropathologies. It has been shown that Homer1a
overexpres-sion reduces susceptibility to amygdala kindling (Potschka
et al., 2002) and decreases the magnitude of LTP in the
hip-pocampus, presumably by diminishing postsynaptic responses
during tetanization (Celikel et al., 2007). Electroconvulsive
therapy, which represents an induced seizure used for treatment
of psychosis, promotes Homer1a expression, which reduces
seizure susceptibility and drives homeostasis of pyramidal cell
excitability (Sakagami et al., 2005). By opposition, in a mouse
model of human Fragile X mental retardation syndrome, it has
been shown that less mGlu5 receptors are associated with the
multimeric Homer isoforms, and this could be the molecular
basis of the receptor functional alteration in the pathology
(Ronesi and Huber, 2008). Dysregulation of the herein-identified
molecular control of synaptic excitability could therefore have
dramatic consequences. Such a Homer1a-induced negative
Figure 8. Model of molecular scaffold remodeling and NMDA–mGlu5a re-ceptor cross talk to control synaptic excitability. (A) Under basal condition, multimeric forms of Homer cross-link group I mGlu receptors to the GKAP– PSD95–NMDA receptor complex in the spine and prevent mGlu–NMDA receptor interaction. In this condition, mGlu5a and NMDA receptors do not directly interact. (B) Intense neuronal activity triggers Homer1a expression, which competes with multimeric forms of Homer on the mGlu5a receptor C terminus, resulting in the disruption of the interaction between mGlu5a receptor and GKAP–PSD95–NMDA receptor complex. (C) Homer1a would trigger disengagement of mGlu5a from the multimeric Homer complex, thus allowing association of mGlu5a with NMDA receptor in spines. In this condition, mGlu5a receptors directly inhibit NMDA receptors.
Figure 9. Preapplication of TAT-Homer1a precludes the induction of LTP by activation of synaptic NMDA receptors. Mean of 50 mEPSCs recorded at different times before, during, and after the application of glycine (top). The graph represents the mean (±SEM; n = 8) of AMPA and NMDA com-ponents of mEPSCs. TAT-HomerW24Y (black traces) or TAT-Homer1a (blue traces) was perfused at the beginning of the experiment before glycine application. Note that TAT-Homer1a abolished the glycine-induced NMDA current increase as well as AMPA current potentiation, as compared with the inactive TAT-HomerW24Y. Asterisks indicate that NMDA current is sig-nificantly different in TAT-Homer1a and TAT-HomerW24Y conditions at the same time after glycine application.
on August 29, 2016
jcb.rupress.org
absolute light intensities per pixel of images obtained at 535 nm over 480 nm. These numerical ratios (comprised between 0 and 1.5) were translated and visualized with a continuous 256-pseudocolor look-up table, as dis-played in the figures. To determine the mean intensity and distribution of the 535-nm/480-nm ratio, we calculated the mean intensity and SD of pix-els within a square region of the cell of interest using ImageJ software (National Institutes of Health). To follow TAT-Homer1a–induced BRET changes, 20 µM coelenterazine H was applied for 5 min before the first image acquisition, and 1 µM TAT-Homer1a was added immediately after the first acquisition. A second acquisition was performed 10 min after the TAT-Homer1a application.
Electrophysiology
Hippocampal neurons were recorded in the whole-cell patch-clamp config-uration, as previously described (Roussignol et al., 2005). In Fig. 5, whole-cell current density induced by NMDA application was recorded before (control) and after TAT-Homer1a perfusion. NMDA current density was then expressed as the percentage of NMDA current density in control con-dition, shown as INMDA (%) = (ITAT-Homer1a/Icontrol) × 100.
In Fig. 5 F, hippocampal neurons were incubated with the mGlu5a antagonist (MPEP; 10 µM) before the recording. mEPSCs were recorded on DIV14 hippocampal neurons at room temperature at a holding potential of 60 mV. The recording pipettes had a resistance of around 5 MΩ when filled with the following medium: 140 mM CsCl, 0.5 mM CaCl2, 20 mM
EGTA, 10 mM Hepes, and 10 mM d-glucose, pH 7.2, with an osmolarity of
300 mOsm. The high concentration of EGTA avoided slow Ca2+-dependent
desensitization of NMDA receptors. Neurons were perfused continuously with the following external medium: 140 mM NaCl, 2 mM CaCl2, 3 mM
KCl, 10 mM Hepes, 10 mM d-glucose, 0.01 mM glycine, 0.01 mM
bicucul-lin, and 0.0003 mM tetrodotoxin, pH 7.4, with an osmolarity of 330 mOsm. Currents were recorded through an amplifier (Axopatch 200B), filtered at 1 kHz, digitized at 3 kHz, and analyzed using Axon Instrument pClamp 10.0 software (Molecular Devices). Once a minimal sample of at least 50 mEPSCs had been collected from a neuron, the mean frequency and amplitude of these events were measured on the total duration of the sam-ple. A mean trace was generated from 50 individual mEPSCs to study the fast and slow components (AMPA and NMDA currents, respectively) of the events.
Synaptic NMDA receptor stimulation
The selective activation of synaptic NMDA receptors was achieved by briefly (3 min) incubating neurons with the external medium described in the previous section, complemented with saturating levels (200 µM) of the coagonist glycine and 1 µM strychnine (Lu et al., 2001). Neurons were then kept in normal extracellular solution without glycine until the end of the experiment.
mGlu5 receptor immunostaining
DIV14 hippocampal neurons transfected with shRNA to prevent mGlu5 receptor expression and GFP as a transfection reporter were fixed with 4% PFA at 4°C for 20 min, permeabilized with 0.15% Triton X-100 for 5 min, washed, and incubated with a rabbit anti-mGlu5 antibody (EMD Millipore) for 30 min at room temperature. Cells were washed and incubated with Cy3-conjugated secondary antibody (Jackson Immuno-Research Laboratories, Inc.) for 1 h at room temperature. Cells were then observed under a microscope (Axioimager Z1; Carl Zeiss). Quantifica-tion of the immunostaining of endogenous mGlu5 (histogram in Fig. 5 D) was performed on neurons transfected with shRNA1 or shRNA2 and on nontransfected neurons in the same dish. For each condition, we mea-sured the mean fluorescence intensity and substracted the noise meamea-sured in an adjacent equivalent area with no cell to obtain netFluo C terminus, net Fluo shRNA1, and netFluo shRNA2. The net fluorescence was expressed as a percentage of the expression of mGlu5a in C-terminal condition, shown as net FluoshRNA (%) = (net FluoshRNA/net FluoC terminal) × 100. The
percentage of depletion (D) in mGlu5 receptor expression was calculated as the percentage of DshRNA1 = net FluoC terminal (%) net FluoshRNA (%) =
100 (netFluoshRNA1/netFluoC terminal).
Analysis of the expression level of Homer1a
We extracted total RNA from hippocampal neurons with TRIZOL reagent (Invitrogen) according to the manufacturer’s instructions. RT-PCR analysis of total RNA was performed with random hexamer oligonucleotides for reverse transcription. Sequences of the primers used for the determination of Homer1a expression levels are Homer1a-430F (5-AAAGGCCGA-GTAACCTGGCT-3) and Homer1a-481R (5-CATTTCGCTCACGTCTT-CCAC-3; available from GenBank under accession no. AF093257). generated by PCR amplification of the DNA coding for the C-terminal
tail of mGlu5a, which was then subcloned in-frame with the 3 end of the DNA coding for the ectodomain and transmembrane domain of CD4. The Homer1a coding sequence was fused to the coding sequence of the TAT-permeant peptide to obtain pET-TAT-His-Homer1a. To engineer pcDNA3.1-Myc-mGlu5a-P1124K-Rluc8, pRK5-cherry-CD4-mGlu-Cterm-P1124K, pcDNA3.1-YFP-HomerW24Y, and pET-TAT-His-HomerW24Y, we used primers containing the point mutations coding for P1124K (5-GAGGAGCTTGTGGCGTTAACTAAACCATCGC-3) and W24Y (5-ACAAAGAAGAACTATGTACCCACTAGTAAGCAT-3) to amplify by PCR the mGlu5a and Homer1a coding sequences, respectively. Two shRNAs subcloned into pLKO.1-CMV-tGFP vector (Sigma-Aldrich) were designed to prevent the expression of mGlu5 receptor specifically: shRNA1, clone ID
TRCN0000218761 (5-GTACCGGACATGCCAGGTGACATTATTACTC-GAGTAATAATGTCACCTGGCATGTTTTTTTG-3), and shRNA2, clone ID
TRCN0000219566 (5-CCGGTCATGGAGCCTCCGGATATAACTC-GAGTTATATCCGGAGGCTCCATGATTTTTG-3). Two siRNAs were designed to prevent the expression of Homer1a specifically: Si1 (5-GGTGGA-TAATTGGAAGTCA-3) and Si2 (5-CAGCAATCATGATTAAGTA-3). We used the Eurogentec Universal Negative Control oligonucleotide (reference no. OR-0030-neg05) as a control.
HEK293 cell culture and transfection
HEK293 cell culture and transfection were previously described (Perroy et al., 2003).
Hippocampal primary cell cultures and transfection
Hippocampal cultures were prepared and transfected with Lipofectamine, as previously described (Roussignol et al., 2005). In brief, hippocampal cultures were prepared from embryonic day 17 (E17) to E18 rats and grown in B27-supplemented Neurobasal medium (Life Technologies). We transfected neurons at day in vitro 10 (DIV10) and performed the experi-ments at DIV14. The amount of cotransfected DNA per 35-mm dishes was as follows: 2 µg pcDNA3.1-Myc-mGlu5a-Rluc8 + 2 µg pcDNA3.1-YFP-Homer1a or pcDNA3.1-YFP-Homer3 in Figs. 2 and 3 and 1 µg pRK5-Rluc8-mGlu5a + 1 µg p-YFP-NR1a + 1 µg p3apA-e2-NR2B in Fig. 4. BRET measurements in a cell population using a spectrophotometric plate reader
Cell population BRET measurements were previously described (Perroy et al., 2004). In brief, transfected cells were resuspended in PBS with 0.1% glucose and dispersed in 96-well microplates (Corning) at a density of 100,000 cells/well. We initiated BRET by adding 5 µM of the luciferase substrate and measured the ratio of the light emitted by the acceptor to the light emitted by Rluc using the Mithras LB 940 instrument (Berthold Technol-ogies). Values were corrected by subtracting the background ratio detected when the Rluc construct was expressed alone. For concomitant detection of mGlu5a receptor interactions with Homer1a and Homer3/1c, we com-bined BRET1 and BRET2 generations. Rluc8 catalyzes oxidation of
coelen-terazine H and DeepBlueC coelencoelen-terazine, leading to BRET1 between
Rluc8 and YFP and BRET2 between Rluc8 and GFP
2, respectively. HEK cells
coexpressing Myc-mGlu5a-Rluc8, GFP2-Homer1a, and YFP-Homer were
divided into two samples. In one sample, we measured BRET1 signal
gener-ated by YFP-Homer and Myc-mGlu5a-Rluc8 interaction, and in the second sample, we monitored BRET2 signals resulting from binding of GFP
2-Homer1a
with Myc-mGlu5a-Rluc8. These BRET signals were specific to the studied in-teraction, as no substantial transfer of energy occurred between Rluc8 and GFP2 in the presence of coelenterazine H or between Rluc8 and YFP in the
presence of DeepBlueC coelenterazine (Perroy et al., 2004). BRET imaging
BRET imaging has been previously described (Coulon et al., 2008; Perroy, 2010). In brief, all images were obtained using a bioluminescence-dedicated inverted fluorescence microscope (Axiovert 200M; Carl Zeiss) with a Plan Apochromat 63×/1.40 oil M27 objective at room temperature. Trans-fected cells were first identified using a monochromatic light and an appro-priated filter to excite YFP (exciter HQ480/40 no. 44001 and emitter HQ525/50 no. 42017; Chroma Technology Corp.). The light source was then switched off until the end of the experiment. 20 µM coelenterazine H was applied 5 min before acquisition. Images were collected using a Cas-cade 512B camera (Photometrics). Sequential acquisitions of 20 s were performed at 5 MHZ (gain of 3,950 and binning of 1, with emission filters D480/60 nm [no. 61274; Chroma Technology Corp.] and HQ535/50 nm [no. 63944; Chroma Technology Corp.]) to select Em480 and Em535 wavelengths, respectively, using MetaMorph software (Molecular Devices). The pixel-by-pixel 535-nm/480-nm ratios were calculated by dividing the