HAL Id: hal-00935443
https://hal.archives-ouvertes.fr/hal-00935443
Submitted on 30 Jan 2014
HAL is a multi-disciplinary open access
archive for the deposit and dissemination of
sci-entific research documents, whether they are
pub-lished or not. The documents may come from
teaching and research institutions in France or
abroad, or from public or private research centers.
L’archive ouverte pluridisciplinaire HAL, est
destinée au dépôt et à la diffusion de documents
scientifiques de niveau recherche, publiés ou non,
émanant des établissements d’enseignement et de
recherche français ou étrangers, des laboratoires
publics ou privés.
Genome-wide detection of sRNA targets with rNAV
Jonathan Dubois, Amine Ghozlane, Patricia Thebault, Isabelle Dutour,
Romain Bourqui
To cite this version:
Jonathan Dubois, Amine Ghozlane, Patricia Thebault, Isabelle Dutour, Romain Bourqui.
Genome-wide detection of sRNA targets with rNAV. Symposium on Biological Data Visualization, Oct 2013,
Atlanta, United States. pp.81 - 88. �hal-00935443�
Genome-wide detection of sRNA targets with rNAV
Jonathan Dubois∗ LABRI UMR CNRS 5800,
Universit ´e Bordeaux 1, France
Amine Ghozlane† DSIMB, INSERM UMR-S 665, Universit ´e
Paris 7, INTS, France
Patricia Th ´ebault‡ CGFB - CBiB and LABRI
UMR CNRS 5800, Universit ´e Bordeaux 2,
France
Isabelle Dutour§ LABRI UMR CNRS 5800,
Universit ´e Bordeaux 1, France Romain Bourqui¶
LABRI UMR CNRS 5800, Universit ´e Bordeaux 1,
France
ABSTRACT
The central dogma in molecular biology postulated that ’DNA makes RNA makes protein’, however this dogma has been recently extended to integrate new biological activities involving small non-coding RNAs, called sRNAs. Accordingly, an increasing attention has been given to these molecules over the last decade and related experimental works have shown a wide range of functional activ-ities for these molecules. In this paper, we present rNAV (for rna NAVigator), a new tool for the visual exploration and analysis of sRNA-mediated regulatory networks. rNAV has been designed to help bioinformaticians and biologists to identify, from list of thou-sands of predictions, pertinent and reasonable sRNAs and target candidates for carrying out experimental validations. We propose a list of dedicated algorithms and interaction tools that facilitate the exploration of such networks. These algorithms can be gath-ered into pipelines which can then be saved and reuse over several sessions. To support exploration awareness, rNAV also provides an exploration tree view that allows to navigate through the steps of the analysis but also to select the -sub-networks to visualize and com-pare. These comparisons are facilitated by the integration of mul-tiple and fully linked views. We demonstrate the usefulness of our approach by a case study on Escherichia coli bacteria performed by domain experts.
Index Terms: I.3.6 [Computer Graphics]: Methodology and Techniques—Interaction techniques; J.3 [Computer Applications]: Life and Medical Sciences—Biology and genetics
1 INTRODUCTION
The central dogma in molecular biology postulated that ’DNA makes RNA makes protein’. More precisely, a first process called transcription creates a mRNA (messenger RNA) copy from one spe-cific region of the DNA molecule, called gene. Then, the mRNA is used to synthesize a protein through a process called translation. This dogma has been recently extended to integrate new biological activities [33] involving, for instance, the small noncoding RNAs (sRNAs). Accordingly, an increasing attention has been given to these molecules over the last decade and related experimental works have revealed a wide range of new functional activities for these molecules [31, 39]. Among them, RNAs are involved in regulating biological processes like transcription, translation, mRNA stabil-ity and DNA maintenance or silencing [30]. Of particular interest,
∗e-mail: jonathan.dubois@labri.fr †e-mail:amine.ghozlane@inserm.fr ‡e-mail:patricia.thebault@labri.fr §e-mail:isabelle.dutour@labri.fr ¶e-mail:romain.bourqui@labri.fr
these molecules are known to rapidly modulate the cell behavior and fitness according to environmental stimuli. The single-stranded molecule structure of a sRNA allows some regions of its sequence to form base-pairing with another RNA molecule [41]. That fold-ing between one sRNA and its mRNA targets modify the structure and the stability of mRNAs to positively or negatively regulate their translation into protein or even their stability.
With the extraordinary increase in sequencing capacity through new sequencing technologies (NGS), in combination with special-ized mRNA enrichment and tiling array techniques [35, 40], many prokaryotic transcriptomes (e.g. Escherichia coli or Bacillus sub-tilis) have been explored and have revealed the existence of a plethora of small regulatory RNAs. The identification/inference of theses sRNAs functions, investigating their mRNA targets, im-plies to carry out time-consuming and expensive experimental ap-proaches. This is especially true for bacteria that are fastidious to grow and have a highly divergent genome composition. Hence, the bioinformatics community focuses on the design of fast and inex-pensive in silico approaches to prioritize gene candidates before de-signing an experimental protocol. However, the development of these approaches is still challenging as classical bioinformatics ap-proaches are often poorly efficient in term of sensitivity and the number of false predictions can be consequent. To address this is-sue and reduce the number of sRNA-mRNA interactions to inspect, it is crucial to exploit biological knowledge through appropriate fil-ters.
In this paper, we present rNAV, a visualization tool designed to help bioinformaticians and biologists to identify, from list of thou-sands of predictions, pertinent and reasonable sRNAs and their tar-get candidates for carrying out experimental validations. We intro-duce an integrative approach that fuses sRNA-mRNA relationships with multi-purposed annotation databases. In other words, we pro-pose to visually exploit the mRNA-target information to filter out the false-positive predictions using:
• their functional activity when known
• the pairing region involved within the mRNA or the sRNA • the neighborhood information in the entire network
Our combined approach, exploiting the information of interacting duplexes, eases the task of characterizing the regulatory role of newly discovered sRNAs. While some research has been done for the visual mining of biological networks, like signaling network [5], protein-protein network [18] or metabolic network [32] (for a re-view see [27]) , there has been, to the best of our knowledge, no previously published work on providing visual support for the pre-diction of sRNA-mRNA interactions at a genome scale. Integration of biological databases is currently one the main challenges in the data mining community, and many works have focused on enrich-ment analyses for driving the integration of multipurpose omics or
Domain problem/question Data/Task abstraction Visual Encoding/Algorithm/Interaction P1 Analyse the entire regulatory
net-work
Provide a visualization of the net-work
Nodelink diagram representation of the network P2 Detection of regulatory (SIM or
DOR) motifs
Visualize node’s neighborhood ; Detect common neighborhood of nodes of the network
Suppport the visualization of neighborhood with our dedicated Bring & Go interaction tool ; Provide shortest paths algorithm and support extraction of subnetwork of interest
P3 Exploitation of experts biological knowledge (e.g. mRNAs name, database, annotations)
Provide elementary filters based on attributes
Provide filter/selection algorithm to filter out ele-ments according to their name, annotations and/or database including them
P4 Identification of evolutionary con-strained regions, i.e. regions with an high number of interactions
Identify nodes based on their adja-cent edges information
Provide filter/selection algorithm to identify RNAs according to their interacting regions ; For each edge, show as label the interacting regions of its ex-tremities ; Support selection of a RNA’s neighbor-hood according to the region of interest ; Support the visualization for a given RNA of the number of interactions each base is involved in ; Provide a clus-tering algorithm to group for each node its adjacent edges and visually render it as a glyph
P5 Reproduce the analysis while mod-ifying some parameters
Keep track of previous analysis pipeline
Save/Reuse analysis pipelines P6 Observe/Study/Compare different
filters and pipelines
Apply filters/pipelines several times on the same -sub-network ; Detect common elements in the resulting subnetworks
Provide multiple linked views
P7 Very long analysis Keep track of previous analysis Import/update/save an exploration tree view to give access to previous states of the analysis within/across multiple sessions
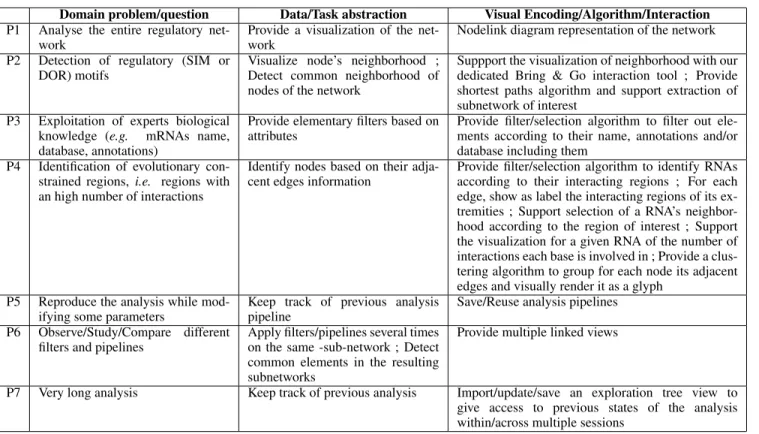
Table 1: Questions/requirements for visual mRNA-targets identification with corresponding data/task abstractions and visual encodings, algo-rithms and interaction tools
annotated data (for a review see [15]). However few of them in-tegrate visualization approaches (for examples see [29]), and if so they are dedicated to specific biological networks with a single database (e.g. [3, 14, 23, 7, 21]). Keeping in mind that one of the advantages of visualization is based on filtering processes to itera-tively reduce the scope of the analysis, the integration of enriched methods to incorporate as much biological knowledge as possible is of great importance to drive more realistic analyses.
The remainder of this paper is structured as follows. In section 2, we first introduce the network construction and then present the underlying analytic process and requirements needed by our alization software to fulfill. We next describe rNAV, a new visu-alization tool integrating all these requirements in section 3. We then explain how rNAV helped our bioinformatician collaborators to identify pertinent sRNA-mRNA interactions in the Escherichia colibacteria. Finally, we draw a conclusion and give directions for future work in section 5.
2 GENOME-WIDE DETECTION OF SRNA TARGETS: DATA GENERATION AND REQUIREMENTS
In this section, we first describe the prediction pipeline for the data generation. We then describe the main biological questions and related tasks, and we provide a list of requirements our tool try to satisfy.
2.1 An integrative prediction pipeline to build regula-tory RNA networks
The main objective of the prediction pipeline is to provide sRNA-mRNA interaction networks that will guide biologists in prioritizing gene and target candidates. As a first step, putative sRNA-mRNA interactions are predicted and then additional functional informa-tion are assigned to mRNAs molecules. To carry out this two steps pipeline, we combined two well-known tools, respectively
IntaRNA [8] and DAVID [17, 16]. While IntaRNA supports the detection of putative sRNA-mRNA interactions, DAVID [17, 16] performs gene annotation enrichments using statistical approaches. For a given organism, we first use as input sRNAs sequences (de-rived from the results of RNA-Seq experiments), and the complete list of mRNAs of the corresponding genome.
For computing the first level of predicted data, we choosed In-taRNA [8] as it offers a good trade-off between specificity and sen-sibility. This software integrates two algorithms for the detection of putative interactions. While the first method has a O(n2m2) time
complexity (where n and m are the lengths of the two interacting RNAs) and is not suitable for genome-wide predictions, the heuris-tic version has a quadraheuris-tic time complexity. To further improve computation times, we developed a multi-core implementation of this algorithm. At the end of this step, we have for each input sRNA a collection of putative interacting mRNAs as well as the positions of the sequences involved in these interactions.
The second stage aims to propose a functional annotation to each sRNA on the basis of their putative mRNA targets. To do so, we uses DAVID [17, 16], a single gene-term enrichment analysis soft-ware. This approach takes as input the collections of mRNAs cor-responding to each sRNA and calculates mRNAs sub-groups based on the presence of a statistically significant over-represented anno-tation. DAVID also offers the advantage to exploit several biologi-cal knowledge databases to provide different annotation concepts:
• GO (Biological Process, Molecular Function and Cellular Component) http://www.geneontology.org
• COG/KOG Ontology http://www.ncbi.nlm.nih.gov/COG/new • SMART Domains http://smart.embl-heidelberg.de
A
B
C
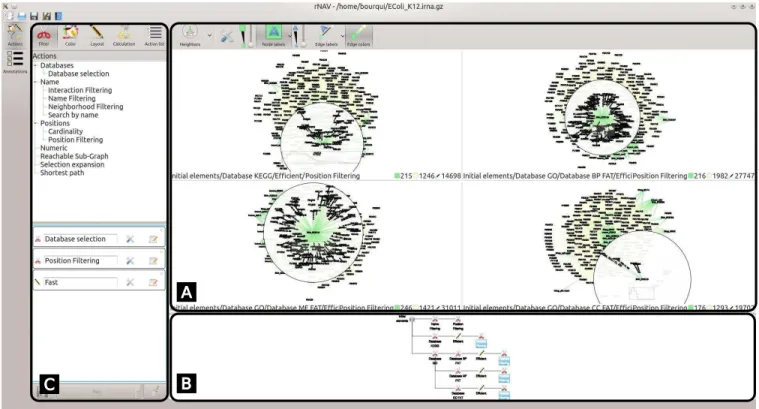
Figure 1: Screenshot of our software after few analysis steps. Panel (A) contains the visualization widget and interaction tools, here four subnetworks are represented and our dedicated Bring & Go is used on an element. The neighborhood of that element is highlighted in all views. Panel (B) contains the exploration tree view. In that tree, the root node corresponds to the orginal data and each time an algorithm is applied on a node (i.e. a subnetwork), we create a son in the tree corresponding to the output of the algorithm. The exploration tree view is used to select the -sub-networks to visualize in Panel (A). In Panel (C), one can see the list of available algorithms (top) categorized into Filter, Color, Layout and Calculation and the algorithms pipeline editor (bottom). Saved algorithms pipelines can be retrieved from the Action list tab. Clicking on the Runbutton will run all the algorithms of the pipeline editor on each visualized/selected -sub-network (from the exploration tree view).
• KEGG Pathways http://www.genome.jp/kegg • UniProt Sequence Features http://www.pir.uniprot.org • PIR SuperFamily Names http://pir.georgetown.edu/iproclass For instance, KEGG annotations [20] are helpful to understand the metabolic function of proteins that encodes for enzymes. An other example is the Gene Ontology database [1] where biological infor-mation associated to a gene is defined by a set of functional terms related by relationships within a directed acyclic graph. For a group of mRNAs related to a given sRNA, the over-represented biological annotation might be considered as a putative sRNA’s annotation. These annotations are thus not related to the sRNA but rather to the combination of sRNA-mRNA interactions with an enrichment score for significance of these annotations.
The data generated by the combination of IntaRNA and DAVID tools are naturally modelized by a bipartite graph where the two sets of nodes are respectively the sRNAs and the mRNAs. Two RNAs are linked by an edge if and only if they were predicted as interact-ing molecules. Edges of that graph, linkinteract-ing sRNAs and mRNAs, are labeled with the annotations retrieved from various databases (e.g. GO, KEGG or UniProt). Another information of utmost impor-tance is given by the base-pairing region of the sequences involved in each putative sRNA-mRNA interaction.
2.2 Domain problems and Requirements
Focusing on a very local level of the sRNA-mediated regulatory network, Beisel and Storz [4] have suggested a classification de-scribing regulatory motifs according to their topology but also their
biological impact for the cell. The SIM motif, required by a single external perturbation, corresponds to one sRNA regulating several mRNAs. Conversely, the DOR motif represents a coordinated re-sponse of the cell to several stress conditions. It therefore involves the regulation of mRNAs towards several sRNAs, and vice versa. Moreover Modi et al [24] have modeled the sRNA-mediated reg-ulatory network of Escherichia coli. They provided in addition to their model, predictive metabolic information and identified sRNA-centred clusters where interacting mRNAs showed an enriched an-notation with a similar function. Co-evolution information might also be exploited to predict functions of sRNAs. As evolution of these regions may have been constrained, biologists believe them to have an high number of interactions.
Based on discussions with our collaborators, we identified 7 main domain problems and questions, and formulated the corre-sponding visualization requirements. Table 1 provides the domains questions, task abstractions and the corresponding features our tool integrates to fulfill these requirements.
One of the aims is to generalize the methodology of [4, 24] to entire networks, our tool therefore needs to support the visualiza-tion of the whole network (P1 in Table 1). Then, to perform similar analyses, bioinformaticians have to first focus on few RNAs to in-vestigate, and second to combine topology information (P2 in Ta-ble 1) with biological knowledge (P3 in TaTa-ble 1). Dedicated selec-tion/filtration algorithms have to be integrated to extract elements of interest based on topology (e.g. the shortest paths between two RNAs) but also on biological knowledge to initiate the exploration and/or to validate the resulting motifs. Concerning co-evolution information (P4 in Table 1), the detection of such regions can be
achieved by identifying regions with an high number of interac-tions. It requires to visualize the interacting regions for single edge as well as the number of interactions for each base of a RNA. To further facilitate the identification of such regions, we also propose a clustering algorithm which groups for each RNA its putative in-teractions according their interacting regions. Problems P5 and P6 are due to the reproducibility and the exploratory aspect of such analyses. In order to reproduce an analysis pipeline while modify-ing parameters, it is important to support their edition and the reuse of these pipelines. Modifying the parameters may produce different results that need to be compared. At last, carrying out such a long analytic process at once can be tedious (P7 in Table 1) and may require multiple analysis sessions. To remind the user his previous analysis steps, it is thus necessary to keep track of them.
Category Description
Filter Provides methods to filter out uninteresting el-ements / to select elel-ements of interest; Selec-tion/Filtration can be done using interacting re-gions, RNAs names, shortest path between node RNAs, number of putative interactions on a sin-gle RNA, ...
Coloration Provides nodes/edges color mapping according to input data (e.g. sRNA/mRNA, p-values asso-ciated to edges) or according to graph measures (e.g. degree, betweenness centrality, ...) Layout Provides algorithms to lay out the graph;
In-cludes force directed methods (GEM [11] and FM3 [13]), circular layout algorithm as well as dedicated hierarchical drawing algorithms Calculation Provides graph theoretical measures like degree,
betweenness centrality [10] and excentricity [6] ; Provides a clustering algorithm to classify inter-actions of each individual RNA.
Table 2: The four different categories of algorithms integrated in rNAV and a short description.
3 RNAVSOFTWARE
In this section, we present rNAV, a visualization sotware that is ded-icated to the visual exploration of the sRNA-mediated regulatory network generated by a combination of experimental/predictive data. rNAV has been developed in C++ with the Tulip frame-work [2]. It can therefore take full advantage of the the Tulip plu-gins management system and its list of features can be extended if necessary.
3.1 Network visualization
As mentioned above, the input of rNAV is a list of sRNA and mRNA as well as putative interactions linking them. In that data, we can distinguish two sets of elements: the set of all mRNAs and the set of all sRNAs. An intuitive data modeling is therefore a bipartite graph modeling where the two sets of elements correspond to the two types of RNAs. In addition, our predictive pipeline provides enriched annotations for the putative interactions. In Panel (A) of Figure 1, one can see nodelink diagram views on the Escherichia coli K12network. In each view, sRNAs are represented by green squircles while mRNAs are represented by yellow circles. Edges labels (respectively nodes labels) allow to show the enriched an-notations (respectively RNA names). However labels can be used to display any other input information, like the p-values associated to the putative interactions or the interacting regions. Furthermore, nodes sizes and nodes labels sizes can be interactively modified to fit them with the current layout of the network (see Section 3.2).
3.2 Algorithms and analysis pipelines
To answer the domain questions or problems (P2, P3 and P4 in Table 1), rNAV provides a list of algorithms. To simplify the access to the differents algorithms, we classified them into four categories: Filter, Coloration, Layout and Calculation. The four categories can be accessed by clicking on the corresponding button on top of the algorithms widget (see top of Panel (C), Figure 1).
Filter: These algorithms allow to perform both selection and filtration. Each of these algorithms can either select the elements of interest or it can filter the other elements out. The default behaviour of that category is to filter out all elements that are not of interest. In Figure 1 Panel (C), one can see a cisors icon which means that run-ning the algorithm will filter out uninteresting elements. Clicking on that icon turns it into a select icon which means that elements will only be highlighted in the visualization.
Coloration: rNAVprovides a list of color mapping algorithms. These mappings can be done on network nodes (i.e. the RNAs) as well as on the edges (i.e. the putative interactions). Among them, one can colorize the elements (nodes and edges) according to input data such as the p-value associated to the putative interactions or the type of RNA (sRNA and mRNA). In addition, the coloring can be done according to simple theoretical measures like node’s degree, betweenness centrality [10] or centrality [6].
Layout: As rNAV uses nodelink diagrams representation of the network, we obviously need to provide graph drawing algo-rithms. Our software supports four layout algorithms, two of them are force directed and are called Efficient and Fast in the graphic interface and correspond to the GEM [11] and the FM3[13] algo-rithms. We also provide a dedicated hierarchical drawing algorithm and a basic circular drawing one.
Calculation: These algorithms allow to compute simple however useful graph theoretical measures like degree, between-ness [10] or centrality [6]. In addition we also support, for each RNA, the clustering of its putative interactions. That clustering groups putative interaction according to the regions these interac-tions happen. To do so, we first compute the Jaccard’s index [19] where the input for comparing two interactions is the region where these interactions happen. Then the MCL clustering [42] is per-formed to group similar interactions, i.e. according to the involved regions of the sequences.
Given the list of available algorithms, running an algorithm re-sults in a modification of either the element color, selection, posi-tioning or in the removal of elements. Each time an algorithm is run on a graph, we maintain user’s mental map by smoothly animating the transition between the input and the ouput graph representa-tion. For instance, when a Filter algorithm is applied to filter out elements, then we turn their colors to a fully transparent ones and finally remove them from the visualization.
To extract interesting candidates from the list all the putative interactions, the user often needs to perform several and succes-sive filters (P5 in Table 1). rNAV supports the edition of algorithm pipelines as an ordered sequence of algorithms of any category (bot-tom of Panel (C) in Figure 1). In that sequence, the output of an al-gorithm is the input of the next one. For a reproducibility purpose, our tool also supports saving of algorithms pipelines. These saved pipelines are then reachable from the Action list button in the user interface (see top of Panel (C) in Figure 1).
3.3 Exploration awareness and multiple sessions anal-ysis
As mentioned above, the exploration of the entire network can be fastidious and may even require an analysis over multiple sessions (P7 in Table 1). Our software has therefore to help the user to remember his previous analyses. This is achieved by a combina-tion of features developed in rNAV. First of all, based on the work
(a) (b) (c)
Figure 2: Different steps of our dedicated Bring & Go [25] interaction tool. (a) When the mouse pointer is over a RNA, an augmented display emphasizes its neighborhoods. (b) Clicking on that RNA set it as focused and its neighbors are all laid at the same distance, (c) finally the neighbors are uniformly laid out on that circle while preserving the order of the neighbors to avoid edge crossings and maximize the area available to show annotations.
of Shrinivasan and van Wijk [37], we propose an exploration tree view (see Panel (B) of Figure 1). The root node of the tree is as-sociated to the entire network. When running an algorithm on a -sub-network associated to a node u of the tree, we add a new child to u corresponding to the output of the algorithm. To help the user to remember the algorithms which lead to a given state, the user can add information to each node of the exploration tree (by de-fault, the information is the name of the corresponding algorithm). That information can then be modified by double-clicking on the exploration tree node. Running a pipeline of algorithms creates a new branch in the tree where each node of the branch correspond to an algorithm of the pipeline.
Then, to support multiple sessions analysis, the user can save the current state of his analysis. In particular, rNAV can save the network as well as all the exploration tree. During the next ses-sions, the user will be able to access each graph corresponding to each node of the exploration tree. Multiple sessions analysis is also eased by saving algorithms pipelines as the user can then reuse the same algorithms pipelines and their parameters as they were during a previous sessions.
3.4 Interaction tools
(a) (b)
Figure 3: Selection of RNAs according to their interacting regions with our dedicated Bring & Go [25] interaction tool. Once a node of interest have been clicked, the user can select a region of interest (a) or, if the interactions have been clustered, selectable rectangles are used to show up the corresponding interacting regions (b).
First of all, rNAV provides classical zoom and pan and box se-lectioninteraction tools to support usual exploration of graph.
We also implemented a dedicated interaction tool to fit with the tasks of our users (P2 and P4 in Table 1). That interaction tool, in-spired from the Bring & Go of Moscovich et al. [25], allows to ef-ficiently visualize the neighborhood of a given RNA (see Figure 2). The basic of the original method is to bring the neighbors of a node of interest and then clicking on one of these neighbors changes the focus to that clicked node (go step).
In rNAV, the annotation information is of upmost importance, we therefore modified the layout of the neighbors to ensure all edges labels to be readable (see Figure 2). Instead of laying out the neigh-bors on several concentric circles indicating the relative distances, we decided to lay them out on a single one (see Figure 2.(b)). As we preserve the direction of the neighbor positions, some node overlaps can occur. These overlaps are removed during that step which lay the neighbors on the circle in a regular manner (see Figure 2.(c)). To preserve as much as possible the user mental map, we ensure dur-ing that animation that no edge crosses another. This is achieved by keeping the order of the neighbors around the focus node un-changed during the animation.
Another important information is the regions of the focused RNA which interact with other RNAs (P4 in Table 1). Indeed, a region interacting with many other RNAs may be considered as an evolu-tionary constrained region. That interaction tool therefore supports, for each base of that focused RNA, the visualization of the number of interactions each of its bases are involved in. That information is displayed as a curve inside a new glyph we have designed (see in Figure 3.(a)). In case where interactions have been clustered (see section 3.2), then the resulting clustering is displayed with that glyph. Each cluster is represented by a colored rectangle spanning the region of the corresponding interactions. Even if the MCL algo-rithm produces a partition of the putative interactions, the regions of interactions of these clusters can overlap. In that case, we ensure the visibility of each cluster by reducing the height of its box by the number of its overlapping clusters (see Figure 3.(b)). The last feature of that interaction tool is the selection within the glyph it-self. The user can either select neighbors of the focused RNA using a box selection on the glyph or by simply clicking on one of these boxes once the interactions have been clustered (see Figure 3).
3.5 Multiple/linked views
To compare the results of different filters or of different filter pa-rameters (P6 in Table 1), rNAV supports multiple and linked views. The visualized -sub-networks are selected by the user in the explo-ration tree. Using the Ctrl key and clicking on an exploexplo-ration tree node, the user can add or remove the view on the corresponding -sub-network.
As mentioned above, all displayed views are linked. In particu-lar, any interaction on a view will affect the others. Selecting ele-ments with the box selection tool in one view will also select these elements in all the views (if present in the corresponding networks). When using the pan and zoom interaction tool to navigate within a given view, the user can focus on a particular subset of RNAs. In that case, we compute the set of RNAs of interest and automatically perform a combination of pan and zoom as defined by van Wijk and Nuij [43] to focus in the other views on the same RNAs (again if these RNAs are present in these views). Finally, any action per-formed with de dedicated Bring & Go interaction tool (focus, bring or go) impacts the other views as well. For instance, in Figure 1, the focus has been set on a RNA of the bottom right view and the corresponding neighborhood is highlighted in the three others. 4 USE CASE: ANALYSIS OFEscherichia coliBACTERIA
To demonstrate the usefulness of rNAV, we experimented the soft-ware for the analysis sRNA regulatory network of Escherichia coli K12. This bacteria, easily cultivable under laboratory conditions, is a bacterial model organism that has been extensively analyzed over the last decades. Whereas transcription factors are presents in this bacteria, several publications have demonstrated the crucial role carried out by sRNA regulation. An interesting hypothesis relies on the benefit gained by the cell from sRNA regulation. Hence, sRNA synthesis needs less energy than protein synthesis and may allow the cell to quickly adapt itself to an external stressful condition. Moreover, such type of regulation has been recently pointed out by several publications when bacterial cells have to increase their sur-vival behavior during a stressful situation (for a review see [39]). Recent experimental works have led to the discovery of 85 sRNAs in Escherichia coli K12. We collected the experimental validated sRNA data from [28] to predict, for each of them, their potential mRNA targets, by using our prediction protocol (described in sec-tion 2). First, the Escherichia coli K12 sRNAs have been requested using IntaRNA versus the complete mRNAs list of Escherichia coli K12(4142 mRNAs) to predict potential targets (downloaded from the EMBL database, accession number: U 00096). We generated a regulatory network with 60346 edges modeling the predictive inter-actions between the 85 sRNA and 4142 mRNA nodes. Considering the lack of specificity given by IntaRNA, we then further analyzed the predictions by adding enriched annotations using DAVID. At last, we exploited rNAV to guide the data analysis by taking into account multi-purpose types of biological constraints.
The well characterized small RNA gcvB was first investigated, as more than 10 targets have been experimentally validated in the Salmonella genome. A comparative analysis between a gcvB Salmonella mutant and a wild Salmonella strain have shown a vari-ation in the expression of more than 70 genes. Regarding these results, Sharma and Storz [36] have suggested the involvement of gcvB in the regulation of more than 1% of the Salmonella genes and the ability to play the role of a strong pervasive regulator. A gcvB secondary structure composed of five stems and two single strand regions (namely R1 and R2) was proposed by Sharma et al[34]. Both regions R1 and R2 are interacting with mRNAs. For the R1 region, experimental works have shown the gcvb regulatory role with seven mRNAs involved in the peptide transport or/and the acid stress response [34, 26]. Concerning the second region (R2), three targets have been validated so far [36, 9]. In regard of these biological informations about the Salmonella genome and the
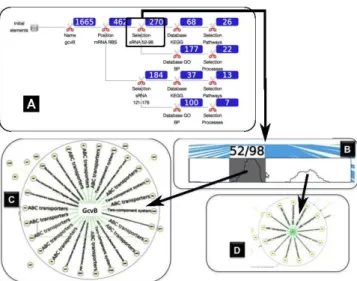
pres-Figure 4: Illustration of the gcvB sRNA hub analysis. Panel (A) de-picts the analysis process that was applied to the regulatory network, while (B)-(D) are screen captures of the different filtering steps. On Panel (A), for each filtration step, the resulting number of target can-didates is shown within a blue rectangle. On panel (B), a graphical representation of the number of gcvB targets, according to their inter-acting localizations on the sRNA (given by the x-axis). The highest values of the curve delimit two sRNA regions that correspond to the R1 and R2 regions, proposed for the Salmonella gcvB sRNA. Panels (C) et (D) are computed by selecting R1 and R2 through the curve on Panel (B).
ence of the gcvB sRNA in the Escherichia coli K12 genome, the two following questions have been addressed with rNAV:
1. Can we transpose what is experimentally known from one genome to a relative one? (i.e. from Salmonella to Es-cherichia coli)
2. Can we expand the previous gcvB target list by exploiting bi-ological knowledge of multiple targeting features?
To answer both questions, we have carried out the following data-driven bioinformatics approach which combines experimen-tal Salmonella knowledge with predictive results compiled for Es-cherichia coli K12(Panel (A), Figure 4). First, we focused on a subnetwork by selecting the name of the sRNA of interest, gcvb in the present case, as well as its direct neighborhood. Second, we applied several combinations of filters and interactions:
• A constrained interval for the mRNA interacting region was set: sRNAs may regulate the translation of mRNAs by com-peting with ribsosome on its mRNA fixation region, usually ranged in an interval of positions of (-20,+10) regarding the position of the initiation codon of the mRNA.
• We then selected, using the dedicated Bring & Go interac-tion tool, regions of the gcvB strand and filtered out from gcvB neighborhood, mRNAs not interacting on one of these regions. The evolutionary conservation of one sRNA region interacting with multi-targets is a feature that has been already exploited. In that case, two regions were identified, the first one from the position 52 to 98 and the second one from the po-sition 121 to 178 (see Panel (B), Figure 4). These regions cor-respond respectively to the R1 and R2 strand regions and have been already identified for 10 validated targets. From both of them, exploiting the specific selection tool, two branches were created in the exploration tree.
• Two additional filters were applied to filter out targets accord-ing to their annotations in the KEGG and the Gene Ontol-ogy databases. The first filter aimed at selecting pathways involved in amino acid transport and two-component system (see Panel (C), Figure 4 for the R1 region). The second one involved the Gene Ontology database by requiring specific an-notations related to the same biological processes (see Panel (D), Figure 4 for the R2 region).
Exploiting this procedure, two prioritized lists of target candidates have been proposed for the two interacting regions onto gcvB (R1 and R2), with respectively 37 and 18 mRNAs. These two gene lists come from the combination of two filters (specific enriched anno-tations from GO and KEGG) after removing redundant candidates that were found with both databases. The filters that we have ap-plied satisfy several constraints that may help to easily argue their selection for experimental validations. Among them, it is notewor-thy that the R1 and R2 regions in the Salmonella genome are ob-servable on the Escherichia coli K12 gcvB as most of the mRNA candidates are interacting on both regions (Panel (B), Figure 4).
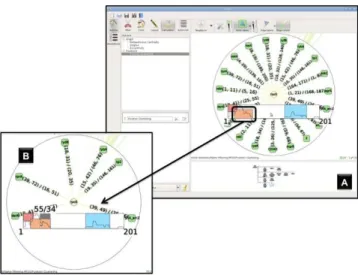
A second analysis has been carried out by focusing on the rpoS mRNA as a starting point. The main objective of this investigation was to analyse a DOR motif where a mRNA can be regulated by several sRNAs, i.e. when the cell needs to coordinate an answer to several stress sources. The rpoS mRNA has been reported to encode for a major stress sigma factor which is involved in stressful condi-tions. Furthermore 4 regulating sRNAs have been reported to base-pair the 5′ region of rpoS mRNA [22]. Using rNAV, we selected the rpoS sub-network and compiled, with the clustering algorithm, the groups of targets according to their interacting positions. The in-teraction clustering provided 3 clusters represented by colored rect-angles in Panel (A) of Figure 5. We selected the UTR overlapping region cluster to interactively emphasize the corresponding inter-acting sRNAs (Panel (B), Figure 5). After analysing it, we noticed the presence of 3 out of the 4 experimentally validated sRNAs, as well as 3 new putative interacting sRNAs (rydB, rybA and tp2), for which there is no known targets [28]. Interestingly, these 3 sRNAs are presents in the 27 genome shigella-coli clade like the 4 already validated ones. This feature follows the Gottesman et al hypoth-esis [12, 38] where sRNAs sharing targets are more likely to be conserved in the shigella-coli clade as they may be derived from a common sRNA ancestor.
5 CONCLUSION
While RNA-Seq technologies provide an increasing number of non coding RNA sequences for different bacteria, in silico studies of their functional activities is still challenging. Indeed such studies require the use of bioinformatics tools dedicated to the prediction of potential mRNA targets, and these tools are known to provide a prohibitive number of false-positive candidates. In this paper, we presented rNAV, a new visualization software designed for the anal-ysis of sRNA-mediated regulatory networks. rNAV allows experts to drive bioinformatics analysis while exploiting the complete or pertinent sub-part of the network. Its features are designed to guide the analysis by integrating multi-purposed biological knowledge in order to help experts to explore hypotheses. rNAV allows to explore large sRNA-mediated regulatory network by gradually reducing the scope of the study. Providing appropriate filtration algorithms is therefore one of the key features of rNAV. Exploiting enriched an-notations, rNAV allows to identify pertinent sRNA candidates as well as reasonnable putative interacting mRNAs. Using this in-formation, bioinformaticians can then determine sRNA’s functional activities to be confirmed by experimental validations. rNAV also integrates a dedicated Bring & Go interaction tool to highlight a given RNA’s neighborhood in the whole network but also to visu-ally identify the evolutionary conserved interacting regions of that RNA.
Figure 5: Illustration of the rpoS mRNA hub analysis. sRNA nodes are represented as green circles and mRNA nodes are in yellow cir-cles. Panel (A) represents the rpoS subnetwork and the visualization of the clustering algorithm for grouping potential base-pairing sRNAs. Each group are represented by a colored rectangle and one can uses this representation to carry out a selection to define a pertinent sub-network. Panel (B) depicts the subnetwork of the sRNAs interacting with the 5′ region of rpoS.
We applied our software to the analysis of the Escherichia coli K12 sRNA-mediated regulatory network to address two issues. First, we exploited biological known features for the gcvb sRNA to expand its list of mRNAs targets, in accordance to their involve-ment in amino acid transport and its potential pervasive regulatory function as suggested for Salmonella. Second, we focused on a pu-tative mRNA hub, identified as a transcription factor, and exploit rNAV to argue the proposition of 3 new interacting sRNAs.
An interesting direction for future work is to integrate new bio-logical constraints from future experimental research work, that is facilitated by the modular implementation of rNAV. In rNAV, we consider as input data the regulatory network together with the in-teracting regions and the enriched annotations. Another direction is to give more flexibility to the user and to allow the import of all these data separately, and on demand, retrieve annotations from DAVID for instance. Last direction is to support the comparison of different organisms’ networks. Such comparisons can be done according to different concepts, for instance, biological knowledge (e.g. functional annotations) or topological information.
ACKNOWLEDGEMENTS
This work was partially done under the EVIDEN project (ANR 2010 JCJC 0201 01), supported by the ANR (France); and under the MycoRNA project, PEPS CNRS/IdEx Bordeaux, 2013. REFERENCES
[1] M. Ashburner, C. A. Ball, J. A. Blake, D. Botstein, H. Butler, J. M. Cherry, A. P. Davis, K. Dolinski, S. S. Dwight, J. T. Eppig, M. A. Har-ris, D. P. Hill, L. Issel-Tarver, A. Kasarskis, S. Lewis, J. C. Matese, J. E. Richardson, M. Ringwald, G. M. Rubin, and G. Sherlock. Gene ontology: tool for the unification of biology. the gene ontology con-sortium. Nat Genet, 25(1):25–29, May 2000.
[2] D. Auber. Graph Drawing Software, chapter Tulip- A Huge Graph Visualization Framework. Springer-Verlag, 2003.
[3] J. Baumbach, T. Wittkop, K. Rademacher, S. Rahmann, K. Brinkrolf, and A. Tauch. Coryneregnet 3.0–an interactive systems biology plat-form for the analysis of gene regulatory networks in corynebacteria and escherichia coli. J Biotechnol, 129(2):279–289, Apr 2007.
[4] C. L. Beisel and G. Storz. Base pairing small rnas and their roles in global regulatory networks. FEMS Microbiol Rev, 34(5):866–882, Sep 2010.
[5] S. I. Berger, R. Iyengar, and A. Ma’ayan. Avis: Ajax viewer of in-teractive signaling networks. Bioinformatics, 23(20):2803–2805, Oct 2007.
[6] U. Brandes and D. Wagner. Visone – Analysis and Visualization of Social Networks, pages 321–340. Springer-Verlag, 2003.
[7] K. R. Brown, D. Otasek, M. Ali, M. J. McGuffin, W. Xie, B. Devani, I. L. v. Toch, and I. Jurisica. Navigator: Network analysis, visual-ization and graphing toronto. Bioinformatics, 25(24):3327–3329, Dec 2009.
[8] A. Busch, A. S. Richter, and R. Backofen. Intarna: efficient prediction of bacterial srna targets incorporating target site accessibility and seed regions. Bioinformatics, 24(24):2849–2856, Dec 2008.
[9] A. Coornaert, C. Chiaruttini, M. Springer, and M. Guillier. Post-transcriptional control of the escherichia coli phoq-phop two-component system by multiple srnas involves a novel pairing region of gcvb. PLoS Genet, 9(1):e1003156, Jan 2013.
[10] L. Freeman. A set of measures of centrality based on betweenness. Sociometry, 40(1):35–41, March 1977.
[11] T. M. J. Fruchterman and E. M. Reingold. Graph drawing by force-directed placement. In Software-Practice and Experience, volume 21(11), pages 1129–1164. SoftwarePractice & Experience, nov 1991. [12] S. Gottesman and G. Storz. Bacterial small rna regulators: versatile roles and rapidly evolving variations. Cold Spring Harb Perspect Biol, 3(12), Dec 2011.
[13] S. Hachul and M. Jnger. Drawing large graphs with a potential-field-based multilevel algorithm. In Proc. Graph Drawing 2004 (GD’04), pages 285–295, 2004.
[14] Z. Hu, E. S. Snitkin, and C. DeLisi. Visant: an integrative framework for networks in systems biology. Brief Bioinform, 9(4):317–325, Jul 2008.
[15] D. W. Huang, B. T. Sherman, and R. A. Lempicki. Bioinformatics enrichment tools: paths toward the comprehensive functional analysis of large gene lists. Nucleic Acids Res, 37(1):1–13, Jan 2009. [16] D. W. Huang, B. T. Sherman, and R. A. Lempicki. Systematic and
integrative analysis of large gene lists using david bioinformatics re-sources. Nat Protoc, 4(1):44–57, 2009.
[17] D. W. Huang, B. T. Sherman, Q. Tan, J. Kir, D. Liu, D. Bryant, Y. Guo, R. Stephens, M. W. Baseler, H. C. Lane, and R. A. Lempicki. David bioinformatics resources: expanded annotation database and novel al-gorithms to better extract biology from large gene lists. Nucleic Acids Res, 35(Web Server issue):W169–W175, Jul 2007.
[18] F. Iragne, M. Nikolski, B. Mathieu, D. Auber, and D. Sherman. Proviz: protein interaction visualization and exploration. Bioinfor-matics, 21(2):272–274, 2005.
[19] P. Jaccard. Distribution de la flore alpine dans la bassin de dranses et dans quelques r´egions voisines. Bulletin de la Soci´et´e Vaudoise des Sciences Naturelles, 37:241–272, 1901.
[20] M. Kanehisa, S. Goto, Y. Sato, M. Furumichi, and M. Tanabe. Kegg for integration and interpretation of large-scale molecular data sets. Nucleic Acids Res, 40(Database issue):D109–D114, Jan 2012. [21] A. Lysenko, A. Lysenko, M. M. Hindle, J. Taubert, M. Saqi, and
C. J. Rawlings. Data integration for plant genomics–exemplars from the integration of arabidopsis thaliana databases. Brief Bioinform, 10(6):676–693, Nov 2009.
[22] P. Mandin and S. Gottesman. Integrating anaerobic/aerobic sensing and the general stress response through the arcz small rna. EMBO J, 29(18):3094–3107, Sep 2010.
[23] M. J. McGuffin and I. Jurisica. Interaction techniques for selecting and manipulating subgraphs in network visualizations. IEEE Trans Vis Comput Graph, 15(6):937–944, 2009.
[24] S. R. Modi, D. M. Camacho, M. A. Kohanski, G. C. Walker, and J. J. Collins. Functional characterization of bacterial srnas using a network biology approach. Proc Natl Acad Sci U S A, 108(37):15522–15527, Sep 2011.
[25] T. Moscovich, F. Chevalier, N. Henry, E. Pietriga, and J.-D. Fekete. Topology-Aware Navigation in Large Networks. In A. Press, editor, SIGCHI conference on Human Factors in computing systems, pages
2319–2328, Boston, ´Etats-Unis, 2009. ACM.
[26] V. J. Papenfort K. Multiple target regulation by small noncoding rnas rewires gene expression at the post-transcriptional level. Research in Microbiology, 160(4):278–287, 2009. cited By (since 1996) 4. [27] C. Pastrello, D. Otasek, K. Fortney, G. Agapito, M. Cannataro,
E. Shirdel, and I. Jurisica. Visual data mining of biological networks: One size does not fit all. PLoS Comput Biol, 9(1):e1002833, 01 2013. [28] A. Peer and H. Margalit. Accessibility and evolutionary conserva-tion mark bacterial small-rna target-binding regions. J Bacteriol, 193(7):1690–1701, Apr 2011.
[29] R. Pesch, A. Lysenko, M. Hindle, K. Hassani-Pak, R. Thiele, C. Rawl-ings, J. Khler, and J. Taubert. Graph-based sequence annotation using a data integration approach. J Integr Bioinform, 5(2), 2008. [30] P. Romby and E. Charpentier. An overview of rnas with regulatory
functions in gram-positive bacteria. Cell Mol Life Sci, 67(2):217–237, Jan 2010.
[31] P. Romby and E. G. H. Wagner. Exploring the complex world of rna regulation. Biol Cell, 100(1):e1–e3, Jan 2008.
[32] M. Secrier, G. A. Pavlopoulos, J. Aerts, and R. Schneider. Arena3d: visualizing time-driven phenotypic differences in biological systems. BMC Bioinformatics, 13:45, 2012.
[33] J. A. Shapiro. Revisiting the central dogma in the 21st century. Ann N Y Acad Sci, 1178:6–28, Oct 2009.
[34] C. M. Sharma, F. Darfeuille, T. H. Plantinga, and J. Vogel. A small rna regulates multiple abc transporter mrnas by targeting c/a-rich el-ements inside and upstream of ribosome-binding sites. Genes Dev, 21(21):2804–2817, Nov 2007.
[35] C. M. Sharma, S. Hoffmann, F. Darfeuille, J. Reignier, S. Findeiss, A. Sittka, S. Chabas, K. Reiche, J. Hackermller, R. Reinhardt, P. F. Stadler, and J. Vogel. The primary transcriptome of the major human pathogen helicobacter pylori. Nature, 464(7286):250–255, Mar 2010. [36] C. M. Sharma and G. Storz. Interesting twists on small rna themes in pseudomonas aeruginosa. Mol Microbiol, 80(4):855–859, May 2011. [37] Y. B. Shrinivasan and J. J. van Wijk. Supporting Exploration Aware-ness in Information Visualization. IEEE Computer Graphics and Ap-plications, 29(5):34–43, 2009.
[38] E. Skippington and M. A. Ragan. Evolutionary dynamics of small rnas in 27 escherichia coli and shigella genomes. Genome Biol Evol, 4(3):330–345, 2012.
[39] G. Storz, J. Vogel, and K. M. Wassarman. Regulation by small rnas in bacteria: Expanding frontiers. Mol Cell, 43(6):880–891, Sep 2011. [40] A. Toledo-Arana, O. Dussurget, G. Nikitas, N. Sesto, H.
Guet-Revillet, D. Balestrino, E. Loh, J. Gripenland, T. Tiensuu, K. Vaitke-vicius, M. Barthelemy, M. Vergassola, M.-A. Nahori, G. Soubigou, B. Rgnault, J.-Y. Coppe, M. Lecuit, J. Johansson, and P. Cossart. The listeria transcriptional landscape from saprophytism to virulence. Na-ture, 459(7249):950–956, Jun 2009.
[41] A. Toledo-Arana, F. Repoila, and P. Cossart. Small noncoding rnas controlling pathogenesis. Curr Opin Microbiol, 10(2):182–188, Apr 2007.
[42] S. van Dongen. Graph Clustering by Flow Simulation. PhD thesis, Universiteit Utrecht, 2000.
[43] J. J. van Wijk and W. A. A. Nuij. Smooth and efficient zooming and panning. In Proceedings of the Ninth annual IEEE conference on In-formation visualization, INFOVIS’03, pages 15–22, Washington, DC, USA, 2003. IEEE Computer Society.

![Figure 2: Different steps of our dedicated Bring & Go [25] interaction tool. (a) When the mouse pointer is over a RNA, an augmented display emphasizes its neighborhoods](https://thumb-eu.123doks.com/thumbv2/123doknet/14310473.495261/6.918.98.834.80.342/figure-different-dedicated-interaction-pointer-augmented-emphasizes-neighborhoods.webp)