HAL Id: hal-03095419
https://hal.archives-ouvertes.fr/hal-03095419
Submitted on 4 Jan 2021
HAL is a multi-disciplinary open access
archive for the deposit and dissemination of sci-entific research documents, whether they are pub-lished or not. The documents may come from teaching and research institutions in France or abroad, or from public or private research centers.
L’archive ouverte pluridisciplinaire HAL, est destinée au dépôt et à la diffusion de documents scientifiques de niveau recherche, publiés ou non, émanant des établissements d’enseignement et de recherche français ou étrangers, des laboratoires publics ou privés.
Brushite (Ca,M)HPO4, 2H2O doping with bioactive
ions (M = Mg2+, Sr2+, Zn2+, Cu2+, and Ag+): a
new path to functional biomaterials?
Moufida Sayahi, Jerran Santos, Hafed El-Feki, Cédric Charvillat, Françoise
Bosc, Ipek Karacan, Bruce Milthorpe, Christophe Drouet
To cite this version:
Moufida Sayahi, Jerran Santos, Hafed El-Feki, Cédric Charvillat, Françoise Bosc, et al.. Brushite (Ca,M)HPO4, 2H2O doping with bioactive ions (M = Mg2+, Sr2+, Zn2+, Cu2+, and Ag+): a new path to functional biomaterials?. Materials Today Chemistry, Elsevier, 2020, 16, pp.100230. �10.1016/j.mtchem.2019.100230�. �hal-03095419�
Original manuscript
Brushite (Ca,M)HPO
4, 2H
2O doping with bioactive ions
(M = Mg
2+, Sr
2+, Zn
2+, Cu
2+and Ag
+): a new path to
functional biomaterials?
Moufida Sayahi 1,2, Jerran Santos3, Hafed El-Feki2, Cédric Charvillat1, Françoise Bosc1, Ipek Karacan3, Bruce Milthorpe3, Christophe Drouet1,*
1
CIRIMAT, Université de Toulouse, CNRS, INP-Ensiacet, 4 allée E. Monso, 31030 Toulouse cedex 4, France.
2
Materials Sciences and Environment Laboratory, Faculty of science of Sfax, BP 802 3018, Tunisia.
3
Advanced Tissue Regeneration & Drug Delivery Group, School of Life Sciences, Faculty of Science, University of Technology Sydney, NSW, Australia
*Corresponding author: Dr. Christophe Drouet , PhD CIRIMAT Institute
“Phosphates, Pharmacotechnics, Biomaterials” research group
Postal address: CIRIMAT, Ensiacet, 4 allée Emile Monso, 31030 Toulouse cedex 4, France
Phone: +33 (0)5 34 32 34 11
Abstract
Dicalcium phosphate dihydrate, DCPD (CaHPO4.2H2O), brushite, is an important CaP
compound encountered in mineralized tissues and used in medicine, especially in bone cement formulations. However, the use of DCPD as direct implantable biomaterial has not received dedicated attention. Also, the possibility to dope DCPD with biologically-active ions to modulate its performances was not systematically explored. We have investigated in depth the doping of DCPD with Mg2+, Sr2+, Zn2+, Cu2+ and Ag+ ions. Clear modifications in terms of chemical composition, particle size, pore distribution, crystal morphology and affinity for water were pointed out. Then, the samples were cultured with human adipose-derived stem cells (ADSCs) to explore cytotoxicity and proliferation. Various behaviors were noticed dependent on the incorporated metal ions. Such DCPD compounds associated with bioactive metal ions, and particularly Ag+ and Zn2+, appear promising as a new family of reactive materials for use, as such or in combination, in bone-related applications.
Keywords: Brushite, DCPD, ion substitution, human stem cells, bone biomaterial,
1. Introduction
Calcium phosphates (CaP) are important biominerals occurring in calcified tissues, whether in normal biomineralizations like dentin, enamel and bone [1-3] or in pathological processes (e.g. kidney and salivary calculi) [4,5]. Due to this natural occurrence, CaP compounds are particularly well adapted to biomedical applications, especially in the field of regenerative medicine like in bone regeneration. Intense research has been dedicated to obtain biomaterials at least as efficient as autologous bone to achieve osseous tissue regeneration; one advantage of synthetic bio-inspired CaP compounds versus bone graft is the unlimited amount of available matter, a reproducibility of physicochemical characteristics dictated by the synthesis conditions, and the absence of a second surgery to extract the bone graft. CaP biomaterials are now widely used for bone repair, either in the form of self-supported scaffolds and granules (porous or dense) [6,7] – sometimes associated to an organic counterpart leading to composite materials [8], or as coatings on prosthetic devices [9,10] (e.g. hip and dental implants) or else in the form of injectable bone cements [11].
Implanted CaP biomaterials may not only provide a biocompatible substrate suited for cell activity (adhesion, proliferation, differentiation), but their intrinsic bioactivity can also be exploited to activate bone tissue repair by providing (via dissolution processes) ionic building block, i.e. calcium and phosphate ions, beneficial to the construction of new bone matter. The intrinsic bioactivity of CaP compounds can however be further promoted by tailoring their chemical composition. Indeed, ionic substitution of calcium or phosphate ions by biologically-active ions has been shown, for some CaP compounds, to modulate favorably their biological response, e.g. in terms of activated osteoblastic activity, refrained osteoclastic action, neo-angiogenesis, etc.: some ions are for example known to exhibit biological activity, such as magnesium, silver, strontium, copper, zinc, iron, and silicate ions, among others [12-19]. For example, silicated hydroxyapatite (SiHA) was shown to improve bone regrowth [17, 20]. CaP compounds doped with Ag+, Cu2+ or Zn2+ were for example reported for their antibacterial properties [18,21-24]. Mg2+ or Sr2+ were shown to promote osteoblasts cell proliferation, differentiation and collagen synthesis, and the latter also limits osteoclastic resorption [25-27]. In addition, strontium may allow increasing the radio-opacity of the implanted material (strontium being a heavier alkali-earth element than calcium) for an easier follow-up after surgery [28]. The physicochemical properties, and in particular the solubility, of substituted CaP compounds are also bound to be modified due to changes in the thermodynamics of the substituted phases, as was shown recently in the case of apatites [29].
If a large amount of studies have been dedicated to incorporating biologically-active ions in apatite compounds (hydroxyapatite (e.g. [30, 31]) and biomimetic nonstoichiometric apatites (e.g. [19],[32]), only a limited number of reports dealt with ion substitutions in other CaP phases: magnesium-containing tricalcium phosphate is a natural mineral known as whitlockite, and magnesium and strontium doping in octacalcium phosphate, OCP, was reported [33].
Within CaP phases of interest in bone regeneration applications, brushite CaHPO4 .
2H2O (also known as DCPD for dicalcium phosphate dihydrate) appears as an increasingly
appealing biomaterial-making compound. Brushite is a crystalline hydrated acidic form of calcium phosphate that may occur, at least transiently, in physiological and pathological biomineralizations [34]. It can be used in medicine to supply calcium and is one of the main constituents of mineral bone cements for which the setting reaction is based on a hydrolysis process in a multi-component system e.g. in association with amorphous CaP or tricalcium phosphate [35]. This hydrolysis is due to the fact that brushite is metastable under physiological conditions and progressively converts into hydroxyapatite under physiological pH ~7.4 [36-39]. As such, it may thus be seen as a precursor for the crystallization of biomimetic apatite directly in vivo. However the use of DCPD as implantable biomaterial in bone sites – except for cement formulations (e.g. ref [40]) – has not received great attention so far. Also, the possibility to dope DCPD with biologically-active ions, for example in view of improving its biological performances, deserves a specific focus. Salimi et al. [41] have reported that magnesium has no effect on the rate of brushite formation, but that it can inhibit/retard brushite dissolution. In contrast, potassium substitution for calcium was shown [42] to increase brushite transformation rates to HA. Zhao et al. [22] discussed Zn doping of a DCPD coating on magnesium substrate, pointing out antibacterial added properties. However, so far, only few data are available on substituted brushite compounds, and they were not obtained via an identical synthesis route which does not allow direct comparisons of physicochemical features.
The present investigation was aimed at synthesizing and characterizing pure and doped brushite with cationic elements relevant to the biomedical field, and exploring cell behavior in terms of cytotoxicity and proliferation using human adipose-derived stem cells (ADSCs). Several metal ions have been considered: divalent (Mg2+, Sr2+, Cu2+ and Zn2+) and monovalent Ag+. In each case, the possibility to substitute calcium by these cations has been explored, and the characteristics of the obtained compounds have been explored by a set of complementary techniques (X-Ray Diffraction (XRD), Fourier Transform Infrared
Spectroscopy (FTIR), Raman spectroscopy, scanning electron microscopy (SEM), atomic absorption spectroscopy (AAS), thermal analyses TGA/DTA), as well as particle size distribution analyses.
2. Materials and methods
2.1. Synthesis of unsubstituted and substituted (doped) brushite samples
Pure brushite (DCPD) crystals were obtained by precipitation at room temperature in acidic aqueous medium, starting from solutions of calcium nitrate tetrahydrate Ca(NO3)2.4H2O (87 g in 600 ml) and ammonium dihydrogen phosphate NH4H2PO4 (42 g in
1400 ml). After rapid mixing, the final pH was adjusted around 5.5 via ammonia addition, then the medium was stirred 2 h and left to mature 3 h without stirring. The precipitate was finally filtered, washed with DI water and freeze-dried. The preparation of DCPD samples doped with Mn+ cations (representing Mg2+, Sr2+, Cu2+, Zn2+ or Ag+) was carried out by following the same protocol but replacing part of the calcium nitrate by the doping ion nitrate, maintaining a constant cations-to-phosphorus molar ratio of (Ca+M)/P=1. In the text, the samples produced will be referred to as Mx where M represents the doping ion and x the mole percent of doping in the initial precipitating solution relatively to calcium. For example, Sr5 represents the sample precipitated in the presence of 5 mol% Sr in substitution of calcium.
2.2. Physicochemical Characterization
The solid compounds prepared were subjected to complementary physicochemical techniques. X-ray diffraction (XRD) analyses were performed on a Bruker D8 Advance diffractometer using the CuKα radiation (λ=1.5418 Å) with the following parameters: 10 to
55°, step 0.015°, time 2s at room temperature. The micro structural parameters were determined by XRD pattern refinement using the DICVOL 06 option of the FullProf® suite, based on Rietveld profile fitting procedure. The diffraction profiles were modeled by analytical functions [42].The estimation of the average crystallite size and microstrains was derived from the isotropic model, and the experimental profiles were fitted using a pseudo-Voigt function. The Diamond® software was then used for crystal structure visualization (Diamond Version 3.0, crystal impact GbR Boon Germany). Firstly, an automatic peak search (and background selection) was run, in which peaks can also be added manually. The system was set to a monoclinic unit cell. The final combined peaks were saved as DICVOL *.dic file. The background was modeled using a linear interpolation function with manually and/or
automatic selected points. Secondly, the atomic positions of the resolved structure CaHPO4.2H2O were incorporated in a combined refinement of the XRD using a PCD
(Pearson‘s crystal data) software. The scale factor was refined initially, followed by the cell parameters and atomic positions. The background parameters were also simultaneously refined.
FTIR spectra were recorded on Nicolet 5700 spectrometer in the mid-IR 400-4000 cm-1 domain, using the KBr pellet method and a resolution of 4 cm-1. Complementary vibrational information was obtained by Raman spectroscopy (LABRAM HR 800), with a laser wavelength of 633nm.
The cationic composition of doped and undoped samples was determined by atomic absorption spectroscopy (AAS, in flame mode) using an Analytik Jena AG –contrAA 300 high-resolution continuum source spectrometer. Initial dissolution of the compounds was undergone by acidification with nitric acid addition until a pH close to ~ 2.
Thermal analyses (TG-DTA) were performed in synthetic air, using a Setaram SETSYS evolution system, typically with a heating rate in the range 5-7°C/min, from 30°C to 900°C.
Morphological analyses for pure and doped brushite samples with different amounts of cationic substituent were carried out by scanning electron microscopy (SEM) using a LEO 435 VP at a voltage of 8-10 kV equipped with an IMIX EDX elemental analyzer.
Dynamic Light Scattering (DLS) measurements were carried out after re-suspension in water, using a Malvern Nano-Zetasizer ZS Instrument operated at a wavelength of 633 nm and using a fixed scattering angle of 137°.
2.3. Cell culture
All in vitro tests performed in this work were run on powder-consolidated pellets (15mm in diameter and 5mm height).
2.3.1. Stem cells isolations
The procedure described below is adapted from Santos et al. [58]. Briefly, previous cryogenically stored ADSCs were revived in 5 ml of Delbucco’s modified eagle medium (D-MEM) Glutmax/F12 (Gibco) with 10% Fetal bovine serum (FBS) (Invitrogen) and 1% antibiotics/antimycotics (ABAM) (Invitrogen) and incubated at 37°C at 5% CO2 for 48 hours
until ADSCs adhered to the culture flask. Non-adherent cells were eliminated by replacing the media. ADSCs were passaged 3-5 times by detaching cells with TrypLE Express (Gibco) and
before being utilized in experiments. This research was conducted under the University of Technology human research ethics committee approval (UTS HREC 2013000437).
2.3.2. DCPD samples in cell culture
All DCPD samples, with and without metal ion substitution, were UV sterilized on all surfaces then were placed into sterile 24-well cell culture dish. Once DCPD was prepared for tissue culture the ADSCs were seeded at a density of 20000 cells/ml. Cells were incubated at 37°C at 5% CO2 for 14 days with media changed every 84 hours (~3.5 days). The aspirated
media was collected in 1.7 ml Eppendorf tubes and placed in -80°C storage until further cytoxocity and alkaline phosphatase analysis.
2.3.3. Cytotoxicity assay
Briefly, media collected at 84-hour intervals, at 0, 84, 168, 252 and 336 hours (i.e. respectively 0, 3.5, 7, 10.5 and 14 days) were analyzed in triplicates of 100 µl as placed in a 96 well dish with 10 µl of resazurin from the Alamar Blue kit and incubated for 2 hours at 37°C. The plate was then scanned on a Tecan spectrophotometer at a measurement wavelength of 575nm with a 9 nm bandwidth and a reference wavelength scan at 600 nm with a 9 nm bandwidth. Absorbance vs. time graphs were generated to examine relative cytotoxicity for each DCPD sample with ADSCs.
2.3.4. Alkaline Phosphatase activity assay
Alkaline Phosphatase (ALP) is widely used as a measure of stem cell proliferative capacity as well as a marker to show pluripotency. From the collected conditioned media at the chosen time points, 50 μl of media was combined with 50 μl of p-nitrophenyl (p-NNP) the substrate for the colorimetric assay and absorbance measured at 405 nm and recorded on a Tecan spectrophotometer. As ALP is continuously expressed in dividing stem cells, a relative abundance of secreted ALP can be utilized to determine the cell population’s proliferation in the presence of cell culture additives in this case the DCPD variants. A steady increase in ALP detection across time points indicates a continuous cell growth, increases can be attributed to higher cellular activity and osteo-differentiation, while a decrease levels may be correlated to lower cellular activity.
2.3.5. Scanning electron microscopy (SEM) of ADSCs on sample surfaces
At the final timepoint of 14 days, the Zn5 DCPD sample with ADSCs was rinsed briefly in 1x phosphate buffered saline and fixed in 4% formaldehyde for 30 min. The sample was then sequentially dehydrated with a 10% incremental increase of ethanol in a graded ethanol series of 20%, 30%, 50%, 70%, 80%, 90%, 96% and two exchanges of 100% ethanol. A 1:1 mixture of absolute ethanol : hexamethyldisilazane (HMDS) was then added followed by two exchanges in 100% HMDS (Sigma-Aldrich), allowing the final volume to dry completely for at least 24 h in a vacuum chamber. The scaffold was then mounted onto specimen stubs with adhesive carbon tape and silver paint (ProSciTech, Australia) and optionally coated in a ~10 nm layer of carbon using a MED 010 Balzers Union Carbon Coater. Images were taken using a Zeiss Supra 55VP microscope equipped with an in-lens detector, at accelerating voltage of 5 kV.
3. Results and discussion
In a first stage, the physicochemistry of brushite samples doped with the various metal ions was investigated in detail. In a second stage, in vitro cell tests were carried out.
3.1. Unsubstituted brushite CaHPO4.2H2O
The XRD pattern corresponding to the unsubstituted CaP powder prepared here at room temperature confirmed that the product obtained was highly crystalline and composed of a unique DCPD phase (see Supplementary Information, Figure SI1, with reference to JCPDS datafile #72-0713). No secondary crystallized phases or impurities were detected. Maximum peak intensities were found for example for 2 values around 11.66°, 20.95° and 29.28°, attributable respectively to the diffracting planes (020), (12 ) and (11 ) of DCPD.The XRD pattern shows an exacerbated (020) line indicating significant preferred orientations of stacked constitutive crystallites, as is common with brushite crystals.
In a subsequent step, crystal structure refinement has been performed. Indexation of the powder XRD data was confirmed for the unsubstituted brushite using the auto-indexing program DICVOL implemented in the FullProf program [43] as described in the experimental section. The present compound was confirmed to be single-phased, all peaks being identified in the monoclinic structure of brushite. Refinement was done using the atomic positions in the P2/m (Z = 4) space group, injecting as initial parameters those obtained via the Pearson’s
crystal Data software (PCD). From the first Search-match procedure the CaHPO4.2H2O phase
was found with all peaks identified thus the structure was quickly confirmed as monoclinic with P2/m space group. A suitable solution was obtained, and the resulting refined lattice parameters are given in Table 1. These results are in good agreement with structural data reported for DCPD [44]. As Supplementary Information, Figure SI1 reports the calculated and observed peaks profile and Bragg-positions for unsubstituted DCPD recorded in this work. The very strong reflection at 211.50 can be attributed to the existence of preferential orientation of the crystallites of the sample. In the refinement, it was assumed that our compound was anisotropic; this assumption was indeed confirmed by the successful fitted converged crystal structure.
Complementary characterization was provided by FTIR analyses and Figure 1a reports the spectrum obtained in the mid-IR region 400-4000 cm-1. Again, a typical shape assignable to brushite was evidenced [45]. In particular, the O-H stretching modes of structural water were observed with the high frequency doublet at ~ 3500 cm-1 attributed to the antisymmetric and symmetric stretching of loosely hydrogen-bonded water molecules [46], beside lower frequencies contributions around 3300 cm-1 ascribed to the vibrations of water molecules stronger hydrogen-bonding environment [47]. The H-O-H bending of water is also visible around 1640 cm-1. Then, between 500 and 1400 cm-1 a series of bands can be distinguished and ascribed essentially to the ʋ3 PO4 and ʋ4 PO4 as well as the P-OH band around 874 cm-1
(see Figure 2 and ref. [48]).
To complement further the vibrational spectroscopy analysis, a Raman spectrum was also recorded in the range 400-4000 cm-1 as well as zooms in the 650-1200 cm-1 and 300-650 cm-1 region (Figure 1b). Between 650 and 1200 cm-1 (zoom a), various Raman bands are observed in particular at 987 (ʋ1 PO4), 901 (P-OH str. of HPO42-), and at 1062 and 1086 cm-1
(ʋ3 PO4). In the 300-650 cm-1 region, the Raman spectrum exhibits bands especially at 587
cm-1assignable to the ʋ4 PO4 bending mode. In addition, Raman bands are detected at 380 and
411 cm-1 and are assigned to the ʋ2 PO4 bending [48]. Similar results were observed for pure
DCPD by [46].
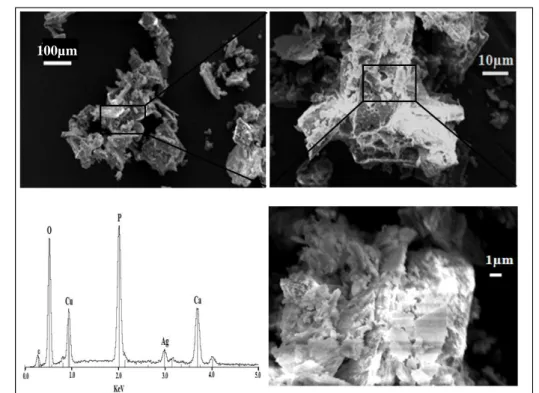
The above XRD, IR and Raman spectra confirm the brushitic nature of the prepared compound. The morphology of the obtained unsubstituted DCPD crystals was then investigated by SEM. Micrographs revealed (Supplementary Information, Figure SI2a) the well-defined elongated platelet morphology characteristic of brushite [48], with micron size dimensions typically of the order of 3-10 µm. EDX spectra confirmed the presence of Ca, O, and P elements, as expected. In order to follow the thermal behavior of the synthetic DCPD
precipitated, and especially determine the amount of water associated to the produced sample, thermogravimetric (TG) and differential thermal (DTA) analyses were carried out (Supplementary Information, Figure SI2b). The TG curve points out the existence of four different weight losses, with three successive mass losses in the temperature range 90-300°C (peak maxima around 120, 136 and 190°C) followed by a fourth weight loss from 370 to 470°C.The three first losses are associated to endothermic events on the DTA curve, and can be linked to the departure of water with final obtainment of monetite CaHPO4. In contrast, the
fourth weight loss, also endothermic, is related to the condensation of HPO42- ions into
pyrophosphates P2O74-. An exothermic event can also be noticed around 565°C with no
associated weight loss, which can be assigned to the crystallization of calcium pyrophosphate. The observation of several thermal events during brushite dehydration is in accordance with previous data [49,50]. The total water loss reaches -24.4 wt.% (corresponding to ~2.4(4) moles H2O) which may be compared to the theoretical -20.9 wt.% corresponding to 2 moles
of structural water per unit formula. These findings remind those of Yasue et al. [50] relative to the dehydration of synthetic brushite, which pointed out the presence of additional H2O
(about 0.5 moles in their conditions) referred to as “condensation water”. Our results agree with this observation, thus suggesting also for the synthetic pure DCPD phase precipitated in this work the presence of additional water, possibly confined in the large inter-platelet spaces formed between adjacent crystals. This condensation water most probably accounts for (at least a good part of) the first endothermic peak at 120°C, with an onset as low as ~ 90°C.
This whole set of characterization data showed a very good match with published data on brushite and allowed a complete characterization, confirming the validity of the protocol used here to precipitate pure DCPD. All the above data will then serve as reference in the following, where potential modifications due to the presence in the precipitating medium of cations Mn+ other than calcium will be examined.
3.2. Brushite doping with bioactive metal ions
In the following part, different cationic species (Mg2+, Sr2+, Zn2+ or Ag+) have been added in the precipitating medium, at increasing concentrations (given in mole % of the initial ionic contents in the precipitation medium), so as to unveil possible modifications of the physicochemistry of precipitated crystals. Table 2 reports the initial and experimental amounts of doping ion relative to the prepared samples, the latter being determined from atomic absorption spectrometry (AAS). These findings indicate that, in our synthesis conditions, some elements (strontium, copper, silver and to a lesser extent zinc) were present
in quantifiable amounts, up to 24 mole %, in the precipitated solids while others (especially magnesium) were significantly less detectable.
In the following, to facilitate the reading, the samples will continue to be referenced using the initial molar doping %, experimental values being accessible in Table 2.
3.2.1. X-Ray diffraction/structural analysis
In the next stage, powder XRD analyses were run on each sample to determine the nature of crystallized phases in presence.
In the case of Mg doping, the obtained XRD patterns of brushite and Mg-doped samples, denoted (Ca,Mg)HPO4.2H2O, are shown in Figure 2a. Samples with initial molar
ratios up to 20% (Mg5 to Mg20) where found to exhibit XRD patterns corresponding to the brushite phase with slight variations in peak position and/or width, suggesting some degree of incorporation of Mg2+ions into the DCPD lattice. For larger Mg concentrations in the precipitation medium, e.g. at substitution ratio of 50%, a secondary phase appears especially detectable at 2θ = 15.86° and 21.50°, which could be identified as struvite, MgNH4PO4 . 6H2O
(JCPDS file #00-015-0762). Rietveld refined unit cell parameters are gathered in Table 3, unveiling nearly constant values up to 20% initial doping rate. Incorporation of magnesium into DCPD thus does not seem to be effective in our experimental conditions, as only traces appear to substitute for calcium, in agreement with the AAS data.
The XRD patterns obtained for doping with another alkali-earth element, strontium, are depicted in Figure 2b. Well defined peaks corresponding to the brushite phase are observed in all cases. However, the presence of a secondary phase identified as SrHPO4 (JCPDS file
#00-012-0368) progressively appears from Sr20 and becomes clearly visible for Sr50. Up to 20%, these samples exhibited very similar line profiles with a small shift in position and variation in intensity. Results obtained from Rietveld refinement have been added in Table 3, indicating unit cell parameters with a general increasing tendency of parameters a, b and c when compared to those of pure DCPD, and these results agree well with reported data [51]. This observation, coupled to the AAS data of Table 2 pointing to the presence of Sr as doping element in all samples, confirms the Sr incorporation into brushite crystal lattice, and these findings agree well with the larger ionic radius of strontium (~1.16Å [52]) than that of calcium (~1.00Å). Such Sr-doped DCPD compounds could prove helpful for increasing
bone-forming ability due to the promoting effect of Sr2+ ions on osteoblast cells and their inhibition role on osteoclastic resorption.
In a similar approach, doping with transition metal ions was also investigated. Zinc substituted brushite samples were tentatively prepared, and the obtained XRD patterns are shown in Figure 2c. For initial doping rates up to 10%, detected peaks correspond to a brushite phase. In contrast, sample Zn20 clearly showed the co-presence of zinc phosphate Zn3(PO4)2.4H2O (JCPDS file #01-070-1908). Intermediate doping rates between 5 and 20%
start to show increasing traces of this secondary phase. The unit cell parameters of the Zn-doped DCPD phase in these samples were shown to exhibit values close to those of pure DCPD as shown in Table 3. These findings along with the AAS data from Table 3 indicate that zinc incorporation into the DCPD phase is possible, while preserving a single phase system for initial doping rates up to 5%. It may however be noted that for 50% Zn in the initial mixture, the obtained precipitated became totally amorphous and DCPD was no more detectable, which tends to point out then a significant crystal growth inhibition played by Zn2+ ions for the DCPD phase. Since the Zn2+ cation exhibits biological effects such as antibacterial and anti-inflammatory properties, the compounds obtained typically up to 5% may find applications for tuning the properties of DCPD-based formulations for biomedical applications.
Another element exhibiting antibacterial properties is copper in the form of Cu2+ ions, for which a possible incorporation in DCPD was then explored. Comparison of XRD patterns for pure DCPD and various copper doping rates is illustrated in Figure 2d. The presence of a secondary phase, namely Cu3(PO4)2.3H2O (JCPDS file #00-022-0548), was noticed for all
prepared samples, including as traces for sample Cu5. Indeed, additional reflections appeared in the diffractogram especially at 2 = 11.37° and 12.84° whose intensities increase with the addition of Cu2+ ions in the medium. All samples including Cu5 were also found to exhibit the light blue color characteristic of the presence of copper ions. These findings suggest that our experimental conditions do not allow copper incorporation solely into a DCPD lattice, even for very low copper concentrations. Attempts have been made to modulate the synthesis conditions, especially by replacing starting reagents (NaH2PO4 instead of NH4H2PO4) and/or
increasing the temperature up to 60°C and/or the maturation time up to 20h. However, in all cases, the presence of copper phosphate was detected even for 5 mole % of copper in the medium. These observations show that Cu incorporation exclusively in the DCPD lattice could not be achieved even for low copper concentrations, despite the panel of experimental
parameters that have been tested in this study. Nonetheless, Rietveld refinements point out a general decrease tendency for the a, b and c unit cell parameters compared to pure DCPD (Table 4), supposing a contraction of the brushite unit cell in this case. This significant effect, well beyond the standard deviation, thus suggests that in addition to the formation of copper phosphate, Cu2+ ions have also been incorporated into the DCPD lattice (although the exact distribution of these ions between the two phase cannot be precisely given here). This unit cell shrinkage effect can be explained by the fact that Cu2+ ions exhibit a smaller ionic radius (~ 0.73Å) compared to Ca2+. A similar contraction effect was reported by Guerra-Lopez and al. [48] on brushite doped with Ni2+ ions exhibiting a radius (~ 0.70 Å) close to that of Cu2+. If desired for biological reasons (e.g. for conferring copper-related antimicrobial activity or for favoring neo-angiogenesis for bone applications), the presence of Cu2+ ions in a DCPD-based formulation would also involve the formation of copper phosphate as secondary phase.
Besides the investigation of a possible substitution of Ca2+ ions by other divalent cations, as mentioned above, interaction with monovalent Ag+ ions was also considered in this work. Indeed, these ions are known to exhibit strong antimicrobial potential even at low doping rates (which was for example shown in nanocrystalline apatites by Vandecandelaere [53]). Such Ag+-for-Ca2+ substitution should necessarily be accompanied by a charge compensation mechanism so as to retain overall electroneutrality. Although the possible occurrence of cationic vacancies in DCPD has not been demonstrated to our knowledge, an eventual additional protonation of some HPO42- anions into H2PO4- may hypothetically be
envisioned, which justifies this study. Changes in phosphate protonation upon cationic substitutions have for example been recently shown in the case of Ca-doped EuPO4
compounds [54]. The XRD patterns of samples precipitated in the presence of silver are displayed in Figure 2e with starting percentage from 2% up to 50%. The presence of the DCPD phase as main phase is confirmed by the observed diffractions peaks. However, a secondary phase was also identified (see Figure 2e), in increasing amounts for increasing Ag doping rates, which is especially detectable at 2θ = 29.70, 33.30° and 33.66°. This secondary phase, even present as traces in sample Ag2, could be identified as silver phosphate Ag3PO4
(JCPDS file #01-089-7399). This fact is also probably related to the observation of a yellow tint for all samples precipitated in this work in the presence of silver. These results indicate that the incorporation of silver into brushite lattice did not prove to be effective, and silver doping thus appears to be only feasible in the form of an intimate association with a Ag3PO4
[55,56]. Moreover, silver phosphate was also used in recent advances on injectable bone cement formulations based on brushite and vaterite so as to convey an antibacterial activity to the starting precipitation medium [21,57]. The present study shows that it is possible to obtain an intimate mixture of the DCPD and Ag3PO4 phases in a one-pot synthesis, which could
enhance existing cement formulations by allowing better/easier mixing of starting ingredients. The above section allowed exploring the crystallochemistry of the DCPD samples obtained by precipitation in the presence of various foreign elements, to point out the actual doping rates, and determine the location of these doping ions either in substitution site in the brushite lattice or as a secondary phase that was systematically identified.
3.2.2. FTIR spectroscopy
FTIR spectroscopy was used here to complement the characterization of the precipitated compounds (Figure 3). The bands characteristic of the DCPD phased were systematically detected; moreover, for some compositions, spectral modifications were also observed, which can be related to the previous XRD results.
In the case of Sr substitution (Figure 3b), typical vibration bands of brushite are detected but a clear modification of spectral features are detected, e.g. in the 800-1300 cm-1 domain, which can be related to the occurrence of the strontium hydrogenphosphate secondary phase as shown by XRD.
In the case of Mg (Figure 3a), all spectra remain very similar, which is in good agreement with the XRD data showing only a very low Mg incorporation. For Mg50 however, spectral modifications are essentially seen in the 3000-3500 and 1300-1500 cm-1 domain, which are in accordance with the presence of struvite (detected by XRD) giving absorption bands in this region.
For zinc-substitution (Figure 3c), for Zn2, 5 and 10 the characteristic bands of DCPD were obtained with only a slight displacement in positions and intensities. In contrast, strong spectral modifications occur beyond 10% Zn initial doping. These alterations can be especially visible in the vibration domains around the O-H stretching modes (range between 2500 and 4000 cm-1) and in the 500-1300 cm-1 region. Although for doping rates lower than 10%, the doublet related to water is clearly visible at 3550 cm-1and 3490 cm-1, these bands intensities progressively decrease for larger doping rates until being only detectable as shoulders. The P-O vibrations modes (500-1300 cm-1) also show significant modifications with the progressive formation of very broad bands with low resolution, especially around
1070 cm-1. These changes are likely related to the formation of zinc phosphate detected by XRD from Zn 10, which seems confirmed by the appearance of the band centered around 1070cm-1 characteristic of this phase [48].
Silver-doped brushite samples exhibited also all the main vibrational peaks characteristic of the brushite phase (Figure 3e), except for Ag50 where significant spectral modifications were observed, especially with the progressive addition of bands in the range 3300-3700 cm-1 (see zoom “b” on Figure 3e) and around 500 and 1000 cm-1 (see zoom “c” on
Figure 3e). These bands can be explained on the basis of the formation of silver phosphate
[48].
Concerning brushite samples precipitated in the presence of copper (Figure 3d), the spectra remained in all cases very similar to that of pure DCPD, and no significant changes could be evidenced.
These FTIR observations thus give additional features for the doped samples produced in this work, and are in good agreement with our conclusions drawn above from XRD data.
3.2.3. Morphological features
To complete the physicochemical study of the precipitated solids, SEM observations were realized on relevant selected compounds. As mentioned in the first section of this paper, analysis of pure DCPD pointed out the characteristic plate-like morphology of the brushite phase with particles typically in the range 3-10 µm in size and with a tendency for the formation of stacked superstructures. In contrast, a less homogeneous morphology seems to be noticed on ion-doped precipitates. Figure SI2 reports, as Supplementary Information, typical morphological features observed for each type of substituting ion. The most contrasting effect was found with copper and zinc doping where the general plate-like aspect was mostly lost in favor of disordered aggregated particles (Figure 4a and Figure SI2(f)). Other doping ions had intermediate effect: Mg and Sr in particular led to an overall smaller particle size (see Figure 4b and Figure SI2(b-d)) and the 3D organization of the particles was also found to be affected, with less parallel stacking and more concretion-like spherical aggregates. In the case of silver doping (Figure SI2(e)), the platelet morphology of regular brushite was globally retained, with however a general smaller particle size and the additional presence of smaller aggregates that could be related to the secondary silver phosphate phase detected previously and responsible of the yellow coloration of the powder.
The above findings point out on the doped DCPD samples a general tendency for obtaining smaller particles. In order to explore further this point and confirm on a quantitative basis this SEM-derived conclusion, particle size distributions were also analyzed in the illustrative example of the Sr-doping series. Results (Supplementary Information, Figure SI4) show that the suspension of unsubstituted DCPD as well as the first strontium percentage Sr5 has a single fairly large size distribution centered around of 397 nm. By increasing the strontium concentration, the monomodal distribution remained uniform but shifted toward smaller sizes around 140 nm for Sr10 and Sr20 and with a notable decrease down to 90 nm for Sr50. Therefore, the incorporation of strontium, in this illustrative example, leads to a quantifiable decrease of the global particle size of the samples, thus confirming our conclusions based on direct SEM observations.
3.2.4. Thermal decomposition/dehydration behavior
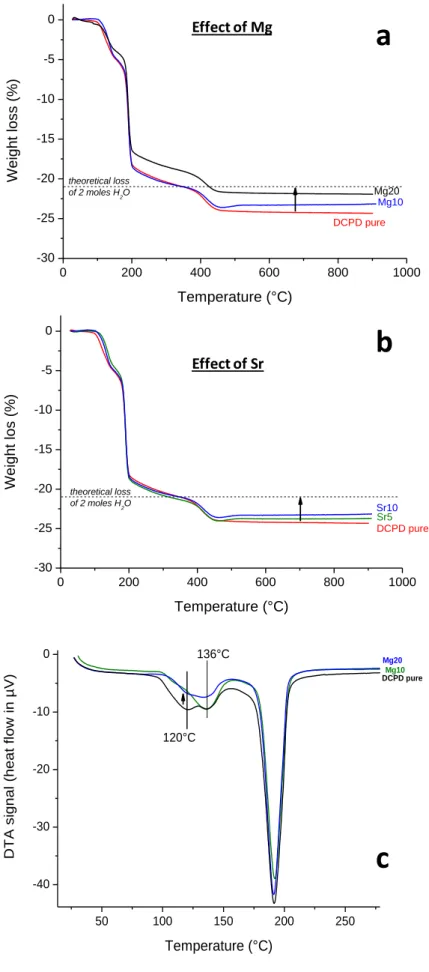
Ion-doped DCPD samples have also been investigated by way of TG/DTA so as to evidence other possible physicochemical modifications compared to pure DCPD. In particular, Mg- and Sr- doped samples have been analyzed to complement the above discussion. All characteristic thermograms are given on Figure SI5 as Supplementary Information. Although the global shape of the curves remained very close to that of pure DCPD with sequential dehydration/decomposition steps, a general trend could be noted on these two series of samples (Figure 5a and b), with a total weight loss progressively approaching the theoretical value of -20.9 wt% (corresponding to 2 moles of structural H2O
per unit formula), while undoped DCPD exhibited also additional ~0.4(4) moles assigned to condensation water. These observations thus suggest that less additional water is associated to the ion-doped brushite crystals compared to raw DCPD, which is supported by the observation of a clear decrease of the 120°C endotherm upon doping as illustrated for Mg on
Figure 5c. Taking into account the results and discussion of the rest of the paper, these
findings are likely related to the noticeable alteration of crystal morphology, size and 3D organization (leading to different pores distributions) noticed upon ion doping, and susceptible to affect the affinity for water of the DCPD crystal surfaces.
The above findings thus indicate that, upon contact with the cationic elements studied in this work, a variety of physicochemical modifications occur. In a subsequent step, first intention in vitro tests were run using human adipose-derived stem cells with the view to assess cytotoxicity and proliferative patterns (through ALP assay).
3.3. In vitro cell behavior
Adipose-derived stem cells (ADSCs) are mesenchymal stem cells that are sourced from the adipose tissue and possess a multi-lineage potential. They are phenotypically similar to MSCs as they express CD29, CD44, CD71, CD90, CD105/SH2, and SH3. The aim of these experiments was to explore the effect on ADSCs induced by metal ion doping of DCPD. The effects examined here were cellular responses to the scaffolds in terms of cytotoxicity, proliferation and cellular adherence to the surface.
3.3.1. Cytotoxicity of doped DCPD on ADSCs during in vitro tissue culture
Alamar blue cell viability reagent is a ready-to-use resazurin-based solution that functions as a cell health indicator by using the reducing power of living cells to quantitatively measure viability. Resazurin, the active ingredient of Alamar blue reagent, is a non-toxic, cell-permeable compound that is blue in color and virtually non-fluorescent. The reagent was directly added to the cells or to collected conditioned media to measure relative cell viability. Due to the DCPD sample surface variability and sample height and the continuous culture, secreted media was collected at 0, 3.5, 7, 10.5 and 14 days for analysis. Generally an absorbance between 0.18 and 0.28 is the average window for normal cell viability with ADSCs displaying normal cell death. A variation up to higher absorbance levels indicates cytotoxicity as a function of cellular distress and/or higher cell death. Each sample triplicate mean was plotted as absorbance vs time points. Figures 6 and 7 present the controls of no scaffold, the silicon disk (Si) and our pure DCPD sample as well as some doped DCPD with Ag+, Cu2+ Mg2+, Sr2+ and Zn2+. These data allow us to draw comparative conclusions.
Figure 6a revealed that pure DCPD, like the non-cytotoxic controls, had a negligible
effect on ADSCs viability, with a low cellular cytotoxicity for most of the time points. Similarly Figure 6b corresponding to the Ag-doped DCPD samples reveals a congruent graph evolution between the control and the Ag-DCPD. The Ag2 sample following a closer pattern to the non-scaffold and Si controls whereas the Ag10 graph reflects a similar pattern to DCPD control. In any case, all Ag-doped compounds tested here exhibited a low cytotoxicity toward ADSCs.
For Zn doping (Figure 6c), the Zn5 sample is associated to a ~ 0.4 absorbance maximum level reached in our experimental conditions, revealing a low degree of cytotoxicity. In contrast, at least at 252 hours, the relative cytotoxicity in the Zn10 sample increased significantly, pointing out a toxicity effect of Zn2+ in these conditions.
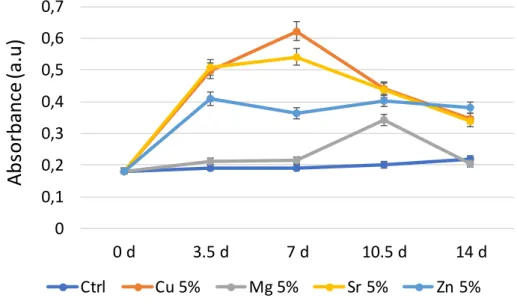
All other tested compositions, containing Mg2+, Cu2+ and Sr2+ exhibited some higher degree of cytotoxicity toward ADSCs, with absorbance levels above 0.4. Figure 7 reports, for an illustrative purpose, a comparison for all samples doped with an initial amount of 5%. Up to 168 h of contact, the following relative cytotoxicity order may be drawn for these compounds: Ctrl < Mg5 < Zn5 < Sr5 < Cu5; at higher contact times Mg5 exhibited a noticeable increase in toxicity. This conclusion should however be considered with precaution since the actual metal ion contents were shown in the previous physicochemistry section to differ from the initial 5% doping rate of the precipitation medium. These data nonetheless allow, from a practical point of view, to determine the level of toxicity that is reached for the various dopings realized in this work. In turn, this allows to pre-determine the “acceptable” ranges of doping rates leading to non-toxicity whenever biomedical applications of such doped DCPD compounds will be envisioned. The different behaviors noticed here are thought to be directly linked to thermodynamic modifications undergone by calcium substitution in DCPD with these different ions.
In order to explore further the biocompatibility and cell/material interactions involving these compounds, alkaline phosphatase (ALP) assays were also realized versus contact time. ALP assays are widely used as a test for cellular proliferation. A consistent linear increase over several timepoints theoretically presents a proportional growth of cells and secretion of ALP. ALP can also be used to monitor cells in non-transparent culture systems, as the ALP levels can be directly correlated to proliferation in normal cellular conditions and cellular response to environments.
For a comparative purpose, Figure 8 presents the relative panel of ADSCs growth via the obtained ALP titrations for the controls and doped DCPD samples. The controls Ctrl and Si have very shallow linear-like gradients, a standard for normal ADSC proliferation over time. The undoped DCPD control also shares a very close linear-like relationship to the controls. Similarly, both 2% and 10% Ag-DCPD and 5% and 10% Zn-DCPD share shallow ALP gradients with insignificant variance when compared to the controls. Cu, Mg and Sr DCPD variable doping compositions exhibit in contrast substantial changes in their ALP detection. The most notable increase in ALP levels compared to the ADSCs are detected for the samples Cu5 at 7 days, Mg20 at 7 days, Sr5 at 10.5 days, Sr10 at 3.5, 7 and 10.5 days. As Supplementary Information, Figure SI6 reports a Euclidean single linkage hierarchical clustering of ALP assay results. Generally speaking, this type of representation groups together samples that have a similar effect on the cells over all timepoints. The closer the lines or grouping of each sample, the more similar the cellular response. The heatmap clustering
identifies a stacked order of ADSCs ALP secretion level similarities between controls and doped DCPD samples. The hierarchical clustering over all timepoints graded into groups (i-v) reveals the samples in Group i are Cu5, Mg20 and Sr5 being the most variable with the highest ALP levels. Group ii (ctrl and Si) share close branch lineage to group iii sharing the least fluctuations in ALP levels.
The global ALP response appears in good general agreement with the cytotoxicity assays performed above. ALP and Alamar blue values seem to be more pronounced for certain metal ions such as Cu2+, Mg2+ and Sr2+. Doping with Ag+ (for which we showed in the physicochemistry section that it was mainly in the form of Ag3PO4) and to a lesser extent with
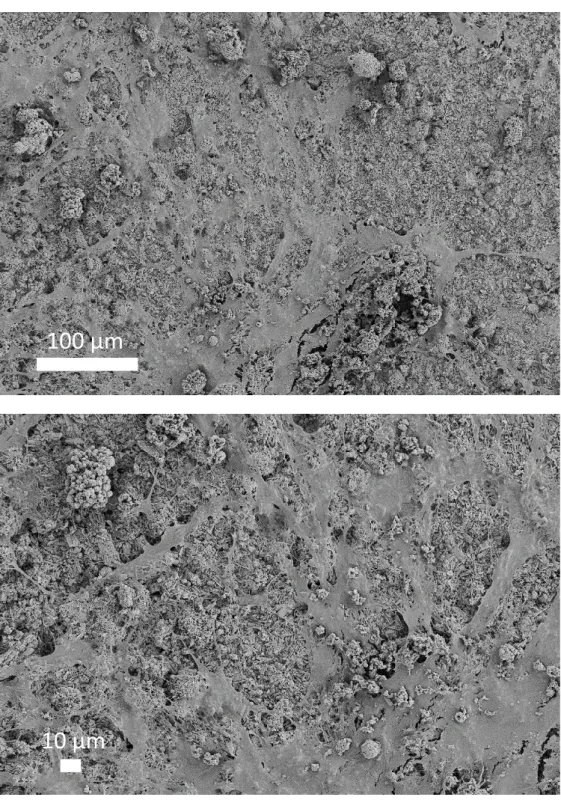
Zn2+ leads to DCPD compounds significantly less stressful for ADSCs. In order to confirm the cell-biocompatible surface features of Zn-doped DCPD, additional observations were made by SEM after cell contact at the t = 336 h timepoint (Figure 9). Despite the fixation and dehydration procedure for SEM analysis, ADSCs were clearly found to adhere on the Zn5 sample, where a high cellular attachment and proliferation of cells on the surface of the structure were observed. The cells seem to have a thick spiderweb-like morphology adhered to multiple anchor points on the surface of this Zn-containing DCPD sample pointing to a non-toxic situation for the cells.
4. Conclusions and perspectives
The potentiality of doping DCPD (brushite) crystals – a precursor of apatite in physiological conditions – with several biologically-relevant elements such as magnesium, strontium, zinc, copper and silver was investigated from a physicochemical and an in vitro viewpoint. Some of these elements were shown to be incorporated (Sr, Zn), in various amounts, into the DCPD phase while the formation of selected secondary phases was noticed on other cases (Mg, Cu, Ag) depending on the nature and concentration of doping ions. In our experimental conditions, secondary phases of struvite MgNH4PO4 . 6H2O was clearly
identified for a substitution rate in the initial mixture of 50% for Mg-doped DCPD, SrHPO4 was detected beyond 20% of Sr substitution, Zn3(PO4)2 . 4H2O was identified beyond 5% of
Zn substitution; finally, Cu3(PO4)2 . 3H2O and Ag3PO4 were systematically detected in all
sample prepared in the presence of copper and silver ions, respectively. However, in instances where the metal ions remained essentially outside of the DCPD structure, such as silver, the “crystal scale” intimate mixtures obtained could prove helpful for better homogenizing
existing bone cement formulations where DCPD is used as precursor. In addition, the secondary phases themselves might also exhibit bioactive properties favorable to bone regrowth. In other cases where the metal ions were found to be accommodated in the DCPD structure, the single-phased “activated” DCPD compounds should prove promising for future biomedical uses: depending on the clinical application envisioned, the nature and amount of doping ion can then be selected.
Several characters of the precipitated DCPD crystals were found to be modified upon doping such as their chemical composition, crystal morphology, particle size, pore distribution, but also their affinity for water.
Such ion-substituted DCPD systems may be envisioned as reactive calcium phosphate-based compounds for use in bone repair applications, alone or in association with other components such as polymers or other mineral ingredients. A modulation of their biological activity thanks to such ionic doping (e.g. to fight infections, to control inflammation, to promote angiogenesis, etc.) is expected, although this is dependent on the aimed clinical application. As a preliminary biological survey, we investigated here the biocompatibility of such doped DCPD compounds vs. human ADSC: cytotoxicity and proliferative behaviors were found to depend directly on the nature and amount of doping metal ion. These data allow pre-determining the order of magnitude of doping to select while avoiding the occurrence of toxic events for such cells, in view of future biomedical uses aiming at exploiting for example the antibacterial, anti-inflammatory, pro-angiogenic, anti-resorptive and/or other biological properties of metal ions among Ag+, Cu2+, Zn2+, Mg2+ and Sr2+. A particular attention might be paid to Ag- and Zn-doped DCPD samples which were found here to be the least stressful for ADSCs.
Acknowledgement
M. Sayahi wishes to thank the University of Sfax, Tunisia, for providing support for travel to France.
The raw/processed data required to reproduce these findings cannot be shared at this time due to technical or time limitations. Authors remain available for providing them upon request after publication.
Figure 1 : Vibrational spectroscopy analysis of unsubstituted brushite: a) FTIR spectrum with
main band assignments and b) Raman sprectum
4000 3500 3000 2500 2000 1500 1000 500 0.2 0.4 0.6 0.8 1.0 1.2 1.4 1.6 1.8 A b s o rp ti o n ( a .u .) Wavenumber ( cm -1) Unsubstituted DCPD
and Magnesium substituted DCPD.
Unsubstituted Brushite Assignments 3500 O-H Stretching 3490 - 3300 - 2930 - 1642 H2O bending 1218 PO stretching (3) 1132 - 1070 - 1004 - 987 PO stretching (1) 874 P-O(H) stretching
663 Vibration of physically bonded of
water 573 526 PO-Bending ( 4) - 500 1000 1500 2000 2500 3000 3500 4000 0 500 1000 1500 2000 In te n si ty (u .a ) Wavenumber (cm-1) Unsubstituted DCPD CaHPO4, 2H2O 700 800 900 1000 1100 1200 0 500 1000 1500 2000 3 PO4 1 PO4 In te n si ty (u .a ) Wavenumber (cm-1) P-(OH) zoom a 300 350 400 450 500 550 600 650 500 1000 1500 4 PO4 2 PO4 In te n si ty (u .a ) Wavenumber (cm-1) zoom b
a)
b)
Figure 2: XRD patterns of doped DCPD samples: a) Mg-DCPD from 5 to 50% (initial
doping rate in precipitation medium), b) Sr-DCPD from 5 to 50%, c) Zn-DCPD from 2 to 50%, d) Cu-DCPD from 5 to 20% and e) Ag-DCPD from 5 to 20%
a) Mg
b) Sr
10 15 20 25 30 35 0 50000 100000 150000 200000 250000 300000 350000 400000 + + + + + Mg50 Mg20 Mg10 In te n s it y ( a .u .) 2 + struvite DCPD Mg5 + 10 15 20 25 30 35 0 100000 200000 300000 400000 500000 600000 In te n s it y ( a .u ) 2 DCPD Sr5 Sr10 Sr20 Sr50 + + + + + + + Strontium hydrogenphosphatec) Zn
d) Cu
10 15 20 25 30 35 40 45 50 55 -200 0 200 400 600 800 1000 1200 In te n si ty ( a .u ) 2(°) Zn20 Zn50 10 15 20 25 30 35 40 45 50 55 0 10000 20000 30000 40000 50000 60000 70000 A b s o rb a n c e (a .u ) 2°) Pure DCPD Zn2-DCPD Zn5-DCPD Zn10-DCPD Zn15-DCPD Zn20-DCPD Zn50-DCPD * zoom 10 15 20 25 30 35 40 45 50 55 0 100000 200000 300000 400000 500000 600000 A b s o rp ti o n (a .u ) 2(°) pure DCPD Cu5 Cu10 Cu20 + + + Copper phosphate 10 15 20 25 30 35 40 45 50 55 0 50000 100000 150000 200000 250000 In te n s it y (a ,u ) 2 DCPDAg2 Ag5 Ag10Ag15 Ag20 Ag50 * * * * *Ag3PO4e) Ag
Figure 3 : FTIR spectra for samples precipitated in the presence of a) Mg2+ ions, b) Sr2+, c) Zn2+ (with delimitation of the O-H stretching (left) and P-OH stretching (right) regions), d) Cu2+, and e) Ag+ (with a zoom on the O-H stretching (left) and P-OH stretching (right) regions)
a) Mg
b) Sr
c) Zn
d) Cu
e) Ag
4000 3500 3000 2500 2000 1500 1000 500 -0,5 0,0 0,5 1,0 1,5 2,0 Ab so rb a n ce (a .U ) Wavenumber(cm-1) pure DCPD Sr5 Sr10 Sr20Sr50 4000 3500 3000 2500 2000 1500 1000 500 0,0 0,5 1,0 1,5 2,0 Ab so rb a n ce (a .u ) Wavenumber (cm-1 ) pure DCPD Mg5 Mg10 Mg20 Mg50 Struvite 4000 3500 3000 2500 2000 1500 1000 500 -0,5 0,0 0,5 1,0 1,5 2,0 2,5 Ab so rb a n ce (a .u ) Wavenumber (cm-1) pure DCPD Ag2Ag5 Ag10 Ag15 Ag20 Ag50 4000 3800 3600 3400 3200 3000 2800 2600 2400 -0,5 0,0 0,5 1,0 1,5 2,0 2,5 1400 1200 1000 800 600 400 -0,5 0,0 0,5 1,0 1,5 2,0 2,5 a b c 4000 3500 3000 2500 2000 1500 1000 500 0,0 0,6 1,2 1,8 A b s o rb a n c e ( a .u ) Wavenumber (cm-1 ) Pure DCPD Zn2 Zn5 Zn10 Zn15 Zn20 Zn50 a b c 4000 3500 3000 2500 2000 1500 1000 500 0,0 0,7 1,4 A b s o rb a n c e (a .u ) Wavenumber (cm-1) pure DCPD Cu5 Cu10 Cu20Figure 4 : SEM images and EDX spectrum for samples a) Cu20 and b) Sr20
a)
b)
Figure 5: TG/DTA analysis on Mg (a,c) and Sr (b) doped DCPD samples 0 200 400 600 800 1000 -30 -25 -20 -15 -10 -5 0 Mg10 DCPD pure W eight los s (%) Temperature (°C) Mg20 theoretical loss of 2 moles H2O Effect of Mg 0 200 400 600 800 1000 -30 -25 -20 -15 -10 -5 0 Sr10 Sr5 DCPD pure W eight los (%) Temperature (°C) theoretical loss of 2 moles H2O Effect of Sr 50 100 150 200 250 -40 -30 -20 -10 0 Mg20 Mg10 D T A s ignal (heat f low in µV) Temperature (°C) DCPD pure 120°C 136°C
a
b
c
Figure 6: Cytotoxicity evaluation (Alamar blue resazurin assay) for controls, Ag- and
Zn-doped DCPD compounds. Samples collected at 0, 3.5, 7, 10.5 and 14 days (color figure accessible online) 0 0.1 0.2 0.3 0.4 0.5 0.6 0.7 0 d 3.5 d 7 d 10.5 d 14 d
Ctrl
Si
DCPD
0 0.1 0.2 0.3 0.4 0.5 0.6 0.7 0 d 3.5 d 7 d 10.5 d 14 dAg 2%
Ag 10%
0 0.1 0.2 0.3 0.4 0.5 0.6 0.7 0 d 3.5 d 7 d 10.5 d 14 dZn 5%
Zn 10%
a)
b)
c)
Ab
so
rb
an
ce
(
a.u
.)
Ab
so
rban
ce (
a.
u
.)
Ab
so
rb
an
ce
(
a.u
.)
Figure 7: Cytotoxicity evaluation (Alamar blue resazurin assay) for DCPD samples doped
with 5% (initial %) Mg, Cu, Sr and Zn and for the empty control. Samples collected at 0, 3.5, 7, 10.5 and 14 days (color figure accessible online)
0 0,1 0,2 0,3 0,4 0,5 0,6 0,7 0 d 3.5 d 7 d 10.5 d 14 d
Abs
or
bance
(a
.u)
Ctrl Cu 5% Mg 5% Sr 5% Zn 5%Figure 9: SEM observation of ADSC cells in contact with the Zn5 DCPD sample. Initial
magnifications: x200 (top picture) and x400 (down picture). EHT 5kV. The cells are visible as a continuous monolayer covering most of the surface of the sample.
100 µm
Table 1: Refined parameters from XRD data on unsubstituted brushite
Chemical formula
Crystal system
Space group
Unit cell parameters
Unit cell volume
Multiplicity Z Reliability Factors Zero-shift CaHPO4.2H2O Monoclinic P 2/m a = 5.816 ± 0.001 Å b = 15.193 ± 0.003 Å c = 6.244 ± 0.002 Å = 116.393 ± 0.015° 494.222 ± 0.015 Å3 4 Bragg R-factor : 0.971 RF- Factor :1.59 Rp = 8.75, R wp = 8.38, R exp = 2.82 0.005
Table 2: Initial and experimental chemical analysis from AAS for doped and selected
undoped DCPD
% initial (synthesis) (Ca+M)/P M/(Ca+M) % exp
DCPD (pure) 0.99 0 0 Mg doping (M = Mg) 5% 1.1 0.00(0) 0 10% 1.11 0.00(1) 0.1 20% 1.09 0.00(7) 0.7 Cu doping (M = Cu) 5% 0.90 0.04(7) 4.7 10% 0.96 0.10(8) 10.8 20% 1.19 0.24(2) 24.2 Sr doping (M = Sr) 5% 1.04 0.02(8) 2.8 10% 1.03 0.04(7) 4.7 20% 1.03 0.12(4) 12.4 Zn doping (M = Zn) 2% 1.19 0.01(2) 1.2 5% 1.17 0.03(2) 3.2 10% 1.22 0.07(7) 7.7 Ag doping (M = Ag) 2% 1.11 0.02(5) 2.5 5% 1.08 0.05(6) 5.6 10% 1.09 0.11(0) 11
Table 3: Refined unit cell parameters from XRD data (Rietveld approach) for doped and
undoped DCPD (SD stands for Standard Deviation)
% synthesis % exp a (Å) SD b (Å) SD c (Å) SD (°) SD V (Å3 ) DCPD (pure) 0 5.816 0.001 15.193 0.003 6.244 0.002 116.393 0.015 494.2 Mg doping 5 0 5.810 0.004 15.180 0.007 6.237 0.004 116.369 0.048 493.1 10 0.1 5.811 0.003 15.176 0.008 6.240 0.004 116.403 0.035 493.7 20 0.7 5.816 0.003 15.187 0.007 6.242 0.003 116.402 0.025 494.3
50 n.d. presence of secondary phase (struvite)
Cu doping 5 4.7 5.816 0.002 15.190 0.003 6.245 0.002 116.392 0.017 494.2* 10 10.8 5.817 0.005 15.186 0.006 6.244 0.005 116.386 0.062 494.0* 20 24.2 5.818 0.008 15.158 0.017 6.229 0.008 116.389 0.076 490.8* Sr doping 5 2.8 5.819 0.002 15.199 0.007 6.253 0.003 116.376 0.023 495.5 10 4.7 5.821 0.001 15.209 0.004 6.256 0.002 116.360 0.012 496.4
20 12.4 presence of secondary phase (strontium hydrogenphosphate)
50 n.d. presence of secondary phase (strontium hydrogenphosphate)
Zn doping
2 1.2 5.814 0.001 15.189 0.004 6.242 0.001 116.379 0.013 493.8
5 3.2 5.813 0.001 15.190 0.003 6.241 0.001 116.378 0.008 493.7
10 7.7 5.812 0.006 15.190 0.016 6.245 0.005 116.361 0.056 493.0**
15 n.d. 5.809 0.006 15.183 0.020 6.255 0.006 116.023 0.023 494.6**
20 n.d. presence of secondary phase (zinc phosphate)
Ag doping
2 2.5 5.809 0.002 15.185 0.003 6.239 0.003 116.342 0.010 493.3***
5 5.6 presence of secondary phase (silver phosphate)
10 11 presence of secondary phase (silver phosphate)
*with additional traces of copper phosphate **with additional traces of zinc phosphate ***with additional traces of silver phosphate
REFERENCES
[1] R.Z. LeGeros, Chemical Reviews 108 (2008) 4742-4753.
[2] C. Rey, C. Combes, C. Drouet, M.J. Glimcher, Osteoporos Int 20 (2009) 1013-1021. [3] J. Gomez-Morales, M. Iafisco, J. Manuel Delgado-Lopez, S. Sarda, C. Drouet, Progress in Crystal Growth and Characterization of Materials 59 (2013) 1-46.
[4] J.F. Sabot, M.P. Gustin, K. Delahougue, F. Faure, C. Machon, D.J. Hartmann, Analyst 137 (2012) 2095-2100.
[5] F.L. Coe, A. Evan, E. Worcester, Journal of Clinical Investigation 115 (2005) 2598-2608. [6] I. Sopyan, M. Mel, S. Ramesh, K.A. Khalid, Science and Technology of Advanced Materials 8 (2007) 116-123.
[7] E. Meurice, A. Leriche, J.-C. Hornez, F. Bouchart, E. Rguiti, L. Boilet, M. Descamps, F. Cambier, Journal of the European Ceramic Society 32 (2012) 2673-2678.
[8] M. Vallet-Regí, M. Gordo, C.V. Ragel, M.Y. Cabañas, J.S. Román, Solid State Ionics 101 (1997) 887-892.
[9] D. Buser, R.K. Schenk, S. Steinemann, J.P. Fiorellini, C.H. Fox, H. Stich, J Biomed Mater Res 25 (1991) 889-902.
[10] M. Jarcho, Dent Clin North Am 30 (1986) 25-47.
[11] M. Bohner, U. Gbureck, J.E. Barralet, Biomaterials 26 (2005) 6423-6429.
[12] A. Bigi, G. Cojazzi, S. Panzavolta, A. Ripamonti, N. Roveri, M. Romanello, K.N. Suarez, L. Moro, Journal of Inorganic Biochemistry 68 (1997) 45-51.
[13] J. Christoffersen, M.R. Christoffersen, N. Kolthoff, O. Barenholdt, Bone 20 (1997) 47-54.
[14] S.P. Nielsen, Bone 35 (2004) 583-588.
[15] O.D. Schneider, S. Loher, T.J. Brunner, P. Schmidlin, W.J. Stark, Journal of Materials Chemistry 18 (2008) 2679-2684.
[16] C.S. Ciobanu, S.L. Iconaru, P. Le Coustumer, D. Predoi, Journal of Spectroscopy (2013) 5.
[17] Z.-Y. Qiu, I.-S. Noh, S.-M. Zhang, Frontiers of Materials Science 7 (2013) 40-50.
[18] V. Stanić, S. Dimitrijević, J. Antić-Stanković, M. Mitrić, B. Jokić, I.B. Plećaš, S. Raičević, Applied Surface Science 256 (2010) 6083-6089.
[19] M. Iafisco, C. Drouet, A. Adamiano, P. Pascaud, M. Montesi, S. Panseri, S. Sarda, A. Tampieri, Journal of Materials Chemistry B 4 (2016) 57-70.
[20] A.E. Porter, S.M. Best, W. Bonfield, Journal of Biomedical Materials Research Part A 68A (2004) 133-141.
[21] A. Ewald, D. Hösel, S. Patel, L.M. Grover, J.E. Barralet, U. Gbureck, Acta Biomaterialia 7 (2011) 4064-4070.
[22] C. Zhao, H. Wu, P. Hou, J. Ni, P. Han, X. Zhang, Materials Letters 180 (2016) 42-46. [23] T.N. Kim, Q.L. Feng, J.O. Kim, J. Wu, H. Wang, G.C. Chen, F.Z. Cui, Journal of Materials Science: Materials in Medicine 9 (1998) 129-134.
[24] L. Yang, X. Ning, Q. Xiao, K. Chen, H. Zhou, J Biomed Mater Res B Appl Biomater 81 (2007) 50-56.
[25] X. Li, Y. Sogo, A. Ito, H. Mutsuzaki, N. Ochiai, T. Kobayashi, S. Nakamura, K. Yamashita, R.Z. LeGeros, Materials Science & Engineering C-Biomimetic and Supramolecular Systems 29 (2009) 969-975.
[26] P.J. Marie, P. Ammann, G. Boivin, C. Rey, Calcif Tissue Int 69 (2001) 121-129.
[27] T.J. Webster, E.A. Massa-Schlueter, J.L. Smith, E.B. Slamovich, Biomaterials 25 (2004) 2111-2121.
[28] S. Pors Nielsen, Bone 35 (2004) 583-588.
[30] I.V. Fadeev, L.I. Shvorneva, S.M. Barinov, V.P. Orlovskii, Inorganic Materials 39 (2003) 947-950.
[31] S.C. Cox, P. Jamshidi, L.M. Grover, K.K. Mallick, Materials Science & Engineering C-Materials for Biological Applications 35 (2014) 106-114.
[32] C. Drouet, M.-T. Carayon, C. Combes, C. Rey, Materials Science and Engineering: C 28 (2008) 1544-1550.
[33] E. Boanini, P. Torricelli, M. Fini, F. Sima, N. Serban, I.N. Mihailescu, A. Bigi, Journal of Inorganic Biochemistry 107 (2012) 65-72.
[34] R.Z. LeGeros, J.P. Legeros, Phosphate Minerals in Human Tissues, in: J.O. Nriagu, P.B. Moore (Eds.), Phosphate Minerals, Springer Berlin Heidelberg, Berlin, Heidelberg, 1984, pp. 351-385.
[35] F. Theiss, D. Apelt, B.A. Brand, A. Kutter, K. Zlinszky, M. Bohner, S. Matter, C. Frei, J.A. Auer, B. von Rechenberg, Biomaterials 26 (2005) 4383-4394.
[36] G. Vereecke, J. Lemaitre, Journal of Crystal Growth 104 (1990) 820-832. [37] R.R. Kumar, M. Wang, Materials Letters 49 (2001) 15-19.
[38] M. Kumar, H. Dasarathy, C. Riley, Journal of Biomedical Materials Research 45 (1999) 302-310.
[39] B.R. Constantz, B.M. Barr, I.C. Ison, M.T. Fulmer, J. Baker, L.A. McKinney, S.B. Goodman, S. Gunasekaren, D.C. Delaney, J. Ross, R.D. Poser, Journal of Biomedical Materials Research 43 (1998) 451-461.
[40] G. Cama, F. Barberis, R. Botter, P. Cirillo, M. Capurro, R. Quarto, S. Scaglione, E. Finocchio, V. Mussi, U. Valbusa, Acta Biomaterialia 5 (2009) 2161-2168.
[41] M.H. Salimi, J.C. Heughebaert, G.H. Nancollas, Langmuir 1 (1985) 119-122. [42] M. Kumar, J. Xie, K. Chittur, C. Riley, Biomaterials 20 (1999) 1389-1399.
[43] T. Toshima, R. Hamai, M. Tafu, Y. Takemura, S. Fujita, T. Chohji, S. Tanda, S. Li, G.W. Qin, Journal of Asian Ceramic Societies 2 (2014) 52-56.
[44] J.C. Elliott, Structure and Chemistry of the Apatites and Other Calcium Orthophosphates, Elsevier Science, Amsterdam, 1994.
[45] C. Drouet, Biomed Research International (2013) 12.
[46] I. Petrov, Soptraja.B, N. Fuson, J.R. Lawson, Spectrochimica Acta Part a-Molecular Spectroscopy A 23 (1967) 2637-&.
[47] A. Hirsch, I. Azuri, L. Addadi, S. Weiner, K.S. Yang, S. Curtarolo, L. Kronik, Chemistry of Materials 26 (2014) 2934-2942.
[48] T. Sopcak, L. Medvecky, M. Giretova, R. Stulajterova, J. Durisin, V. Girman, M. Faberova, Materials Characterization 117 (2016) 17-29.
[49] T. Miyazaki, K. Sivaprakasam, J. Tantry, R. Suryanarayanan, J Pharm Sci 98 (2009) 905-916.
[50] T. Yasue, T. Suzuki, Y. Arai, Nippon Kagaku Kaishi 1983 (1983) 494-500.
[51] M.H. Alkhraisat, C. Rueda, E.L. Cabarcos, Journal of Functional Biomaterials 2 (2011) 31-38.
[52] R.D. Shannon, C.T. Prewitt, Acta Crystallographica Section B 25 (1969) 925-946.
[53] N. Vandecandelaère, Élaboration et caractérisation de biomatériaux osseux innovants à base d'apatites phospho-calciques dopées, CIRIMAT-Ensiacet, PhD thesis, INPT, Toulouse France, 2012.
[54] J. Gomez-Morales, C. Verdugo-Escamilla, R. Fernandez-Penas, C.M. Parra-Milla, C. Drouet, M. Iafisco, F. Oltolina, M. Prat, J.F. Fernandez-Sanchez, J Coll Interf Sci 538 (2019) 174-186
[55] Y. Seo, B.-E. Yeo, Y.-S. Cho, H. Park, C. Kwon, Y.-D. Huh, Materials Letters 197 (2017) 146-149.
[56] V. Stanić, D. Janaćković, S. Dimitrijević, S.B. Tanasković, M. Mitrić, M.S. Pavlović, A. Krstić, D. Jovanović, S. Raičević, Applied Surface Science 257 (2011) 4510-4518.
[57] S. Jacquart, R. Siadous, C. Henocq-Pigasse, R. Bareille, C. Roques, C. Rey, C. Combes, J Mater Sci Mater Med 24 (2013) 2665-2675.
[58] J. Santos, B.K. Milthorpe, B.R. Herbert, M.P. Padula, Int J Stem Cells 10 (2017) 193-217.


![[PDF] Suite bureautique pour mac os guide de formation | Cours Bureautique](data:image/gif;base64,R0lGODlhAQABAIAAAP///wAAACH5BAEAAAAALAAAAAABAAEAAAICRAEAOw==)