HAL Id: halshs-02115908
https://halshs.archives-ouvertes.fr/halshs-02115908
Submitted on 30 Apr 2019
HAL is a multi-disciplinary open access
archive for the deposit and dissemination of
sci-entific research documents, whether they are
pub-lished or not. The documents may come from
teaching and research institutions in France or
abroad, or from public or private research centers.
L’archive ouverte pluridisciplinaire HAL, est
destinée au dépôt et à la diffusion de documents
scientifiques de niveau recherche, publiés ou non,
émanant des établissements d’enseignement et de
recherche français ou étrangers, des laboratoires
publics ou privés.
VigiFlood: a serious game for understanding the
challenges of risk communication
Carole Adam, Éric Andonoff
To cite this version:
Carole Adam, Éric Andonoff. VigiFlood: a serious game for understanding the challenges of risk
communication. ISCRAM, May 2019, Valencia, Spain. �halshs-02115908�
VigiFlood: a serious game for understanding
the challenges of risk communication
Carole Adam
Eric Andonoff
February 2019
Abstract
Emergency managers receive communication training about the importance of being ’first, right and credible’, which is not easy. For instance, in October 2018, the Aude department in the South-West of France was hit by intense rain. Flash floods were hard to forecast and only the ’orange’ level of vigilance could be raised initially, but the population dismissed this very usual warning in that season. The ’red’ level was then raised too late, leading to high criticism. The main problem here is the loss of trust induced by too many ’false alarms’. In this paper we propose a serious game called VigiFlood for raising awareness in the population about the difficulty of crisis communication and their own responsibility for reacting to the alerts. The implemented game still has limited functionality but already shows interesting results in helping the user to visualise and understand the trust dynamics.
Keywords: Flash floods, early warning, crisis communication, trust, agent-based modelling and simula-tion, serious game
1
Introduction
Nowadays, our societies are exposed to multiple risks: natural disasters, epidemics, terrorist attacks, industrial accidents, etc. During such disasters, the population has access to multiple sources of information (including images, videos or field information shared by other citizens), leading to possible confusion and information overload. As a result, they do not always listen to or trust official messages, and might not react appropriately. Emergency managers are therefore trained in risk communication and learn how to communicate in a timely and credible manner, while taking into account the psychology of their audience, in order to refute misinformation, and maintain trust and good relationships [20].
The question of when to raise an early warning about a predictable natural disaster is crucial: too late, and there might be many victims; but too early, and the clues might not be very reliable, leading to possible false alarms and subsequent loss of trust [18, 12]. For instance in October 2018, serious flash floods hit the Aude department in the South-West of France1. The day before, the level of vigilance was set to ’orange’ (level 3 out of 4) for heavy rain and risk of flood, but the population did not react to that very usual warning for that season. When the vigilance was risen to ’red’ (level 4 out of 4) early the next morning, it was too late and many towns and villages were already flooded. As a result, several people died and the authorities received severe critics.
There are several ways of addressing this problem: training the alert services to use the orange and red vigilance cautiously in order to avoid false alarms [12]; providing them with decision-support systems to help raising timely early warnings [11, 7]; or making the population aware of the difficulty of risk prediction and communication, and of their responsibility for still responding even after several false alarms. Here we focus on the population, and aim at providing them with a serious game, VigiFlood where they can play the role of an emergency communicator. They will have to set the vigilance level based on the (uncertain) weather forecast, and observe reactions in the simulated population. Our hypothesis is that this change of perspective will increase their awareness.
This paper is structured as follows: the first section provides some background about flash floods, crisis communi-cation, trust dynamics, and existing simulators; the next section then describes our conceptual agent-based model; we follow up with exposing the implemented game and first experimental results, before concluding the paper.
2
Background
2.1
Flash floods
Flash floods generally occur due to rapid rain on an already saturated soil (after a particularly wet period) or on a soil with a poor absorption capability (such as concrete, as is often the case in urbanised settings), or due to extensive rain because of a storm or hurricane. They can also occur from more occasional events such as a glacier melting after a 1See for instance: https://www.bbc.com/news/world-europe-45861428
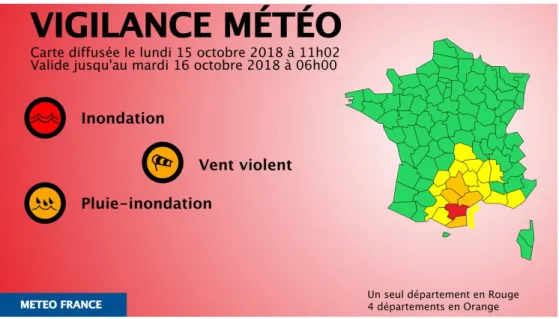
Figure 1: MeteoFrance vigilance map, 15 October, 11am (source: MeteoFrance)
volcanic eruption, an ice dam melting, or a man-made dam failing. In this paper we focus on rain-induced flash floods, whose prediction depends on the meteorological services.
The indicators used by forecast services include: forecast quantity of rain (radar or satellite or model based), soil absorption capacity, soil moisture or dryness level, topography, basin or catchment capacity, etc [8]. In France, the agency in charge of forecasting the expected amount of rain is Meteo France2. Weak rain is defined as 1 to 3 mm/h, moderate rain is between 4 and 7 mm/h, and heavy rain is over 8 mm/h. Another agency is in charge of monitoring the main waterways and broadcast their expected height and debit 3 to 6 hours ahead of time: Vigicrues3. However, only part of the waterways are monitored, and the European Flood Risk Prevision Center (CEPRI4notices that half of the 63 victims in the Languedoc-Roussillon region (south of France) alone between 1996 and 2006 died on catchment basins that were not monitored by flood vigilance services.
The meteorological services in charge of the area then analyses these clues (rain forecast, waterway height and debit, etc) to define and announce a level of vigilance on a 4-colour scale, from green (no problem), yellow, orange, to red (higher risk). This level of vigilance is publicly available online5 (example map on Figure 1). Each region has its particularities and can be more or less used to receiving heavy rain in a short amount of time, so that the vigilance thresholds are not the same everywhere. The Aude department in France (see map on Figure 2) depends on the CNP center in Toulouse; its critical rain threshold for the orange vigilance is 50-100 mm in 24 hours, with a regional record of 551 mm in 24 hours. On Sunday 14 October 2018 the meteorological station of Carcassonne received 139.8 mm of rain. However the vigilance level was first only set to orange, until Monday 15 October morning at 6am when it was finally raised to red. As a result, MeteoFrance vigilance system was harshly criticised in the media [16]. The representative of the Ministry of the Interior, Fr´ed´eric de Lanouvelle, interviewed on LCI-TV, evoked a “weakness in the orange vigilance level which is used very often and when there is a real problem, people do not take it into account anymore” (our translation). He adds that based on residents’ statements, the red vigilance level was indeed raised too late, but explains it is due to the difficulty in forecasting such a powerful episode.
2.2
Flood simulations
Axelrod ([5]) defines 7 purposes of simulations, including prediction (simulate a system very realistically to predict its future behaviour, e.g. meteorology), training (provide a believable interactive environment to rehearse actions, e.g. flight simulator), or education (let the user learn by trying in a virtual world). Predictive simulations require a high degree of realism to lay valid predictions, while training and education simulations can be simpler and less realistic (they “need not be rich enough to suggest a complete real or imaginary world”). Besides, Axelrod also claims that “the simpler the model, the easier it may be to discover and understand the subtle effects of its hypothesized mechanisms”; educational simulations are therefore often quite simple.
Simulations have often been used in crisis management for various purposes. For instance [24] provide a very 2http://www.meteofrance.com/previsions-meteo-france/previsions-pluie
3
www.vigicrues.gouv.fr
4https://www.cepri.net/
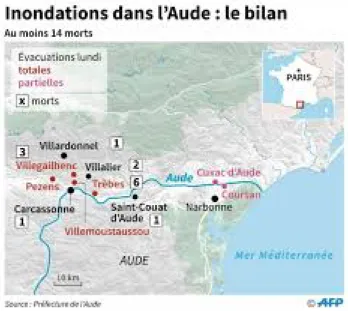
Figure 2: Map of the flooded area, with victim counts, and evacuated towns. Source: Pr´efecture de l’Aude
realistic model based on field data, to predict the impact of early warnings on population behaviour in terms of reducing material losses from floods. Others focus on realistically modelling the physical flood phenomenon in order to support decisions regarding early warnings for tsunamis [11], based on data from multiple sensors [7].
Other simulations are aimed at education, often in the form of a serious game. Anycare is a table-top role-playing game to involve stakeholders [23]. LittoSIM [6] is very realistic and aimed at emergency managers; SPRITE [22] teaches risk management to engineering students; however both games focus on longer-term management and protection against coastal submersion (e.g. building dykes) rather than communication.
Other simulations focus on communication, but not necessarily during floods. [4] study if the population should be alerted or not of an ongoing crisis (e.g. terrorist attack), depending on the anticipation of their potential reaction (e.g. crowd panic), which is based on a psychological model. Since events considered are ongoing, they do not deal with false alarms and their potential impact on long-term trust. [2] study the propagation of awareness in the Australian population after a bushfires warning, depending on its channel and (familiar vs unfamiliar) source. Since they consider a single event, they do not deal with long-term dynamics of trust over multiple (right and wrong) alerts. [1] also proposed a serious game for trying various communication strategies to alert the population (focused vs wide targeting, information vs recommendations) before and during fires, but they do not deal with the timing of alerts nor the impact of false alerts. Indeed, they report no habituation phenomenon to fire alerts, which could be due to the easier predictability of fires compared to flash floods, or to normative and cultural differences.
2.3
Crisis communication
Reynolds ([19]) identifies 6 principles of efficient crisis emergency and risk communication (CERC):
• Be First: in times of crisis, people need information fast, and will often stick with the first source they get information from.
• Be Right: information should be accurate and transparent, explaining what is known or not, and what is being done to get more information.
• Be Credible: communicators should be honest and trustful, and avoid to promise what they cannot deliver, at the risk of losing the public’s trust.
• Express Empathy: communicators should acknowledge the population feelings and challenges to build trust and a good relationship.
• Promote Action: messages should not only be informative but also action-oriented, to empower the population, give them a feeling of control, and release their anxiety.
• Show Respect: communicators should account for the vulnerability of people during crises, their messages should be respectful and promote cooperation and rapport.
[14] review the literature to explain the “complex and unpredictable ways that individuals perceive risk”, and find that risk communication is influenced by socio-cultural, environmental and linguistic factors. Covello et al. ([9, 10]) identify 4 factors of risk communication:
• Risk perception is subjective, influenced by socio-cultural and cognitive factors (e.g. the individual feeling of agency or control).
• Mental noise created by stress and threat reduces the ability to process information: technical and scientific concepts must be “translated [...] into understandable messages”, which should be visual and repeated.
• Negative dominance: upset people focus more on negative (losses) than positive (gains) information, so com-munication must counter-balance negative messages with many more positive, action-oriented messages, and focus on progress rather than failures.
• Trust determination: upset people tend to not trust authority, so trust must be created well ahead of any crisis, through proactive community communication.
Further, [13] discuss the importance of the locus of control of individuals: if external (i.e. they believe they have no control) they will feel helpless, and be less likely to take preventative action or react to warnings than if internal (i.e. they believe they can do something). This is in line with the CERC principle to ’promote action’ and give people something to do so that they feel (more) in control. Similarly, [15] discusses the lack of response of the population when the perceived risk is either too high (fatalism) or too low (“blas´e effect”): in both cases, people feel powerless. He concludes by recommending to pay careful attention to the level of risk that is communicated to the population in the warnings to avoid undesirable reactions or inertia.
The American Center for Disease Control and Prevention issued a report about Crisis and Emergency Risk Com-munication [20] focusing on specific psychological factors of information processing during a crisis, and how messages should be adapted subsequently:
• People simplify messages, might not hear, not remember, or misinterpret them. Logical reasoning is impaired and decisions might rely more on habits, routines or imitation. Messages should therefore be simple.
• People hold on to their current beliefs, and prefer trusted and familiar sources of information even if inaccurate and non-expert, to reputable experts who might disagree with each other. Messages should therefore come from credible sources.
• People try to confirm information before acting, via complementary information and additional opinions. Mes-sages should therefore be consistent between the different channels.
• People believe the first message, and compare any further message with it; lack of information creates anxiety, leading to speculation and rumors. Accurate messages should therefore be released as early as possible.
These findings are in line with research showing the importance of cognitive biases in disasters [17, 3].
2.4
Trust and risk
According to Slovic ([21]), risk management has become much more “contentious”, with risk managers blaming the public for being irrational, and the public blaming the stakeholders for their poor management. In his view risk communication, aiming at aligning population and experts’ perceptions with experts, has failed due to the lack of trust: “if trust is lacking, no form or process of communication will be satisfactory” (p. 410).
Slovic also explains that trust is “fragile”, builds up slowly but can be destroyed instantly and is then hard or impossible to regain (p. 319). He provides several reasons for this asymmetry:
• Negative events are more visible than positive ones (one missed alarm stands out in many days of correct predic-tions);
• Negative events have more weight because they have lower probability and higher consequences (a flood is rarer than a “normal day” and can do serious damage);
• The media also tends to give more coverage to bad news than good news;
• Sources of bad news are seen as more credible, less likely to lie, than sources of good news;
• Distrust strengthens itself, by limiting further interactions and biasing future interpretations towards the rein-forcement of existing (distrustful) beliefs.
2.5
Conclusion
Existing simulators are most often aimed at training or supporting decisions of emergency managers. We adopt a different approach where we propose a serious game aimed at changing the population’s perspective by letting them play the role of an emergency manager confronted with difficult decisions.
This approach is in line with the risk communication principles advocating transparency and empowerment of the population [19], and is currently lacking research. Our claim is that such a game will improve the population’s awareness of the difficulty to predict and announce natural disasters, and their responsibility to react despite a certain rate of (unavoidable) false alarms.
Our serious game is based on a conceptual agent-based model of human behaviour in flash floods. The validity of the underlying behaviour model is ensured by its grounding in psychological and sociological theories of trust and risk communication described above. The physical model of flood on the other hand need not be extremely realistic to reach our educational goal, in line with [5]. This conceptual model is described in the next section.
3
Conceptual agent-based model
3.1
The hazard: flash flood
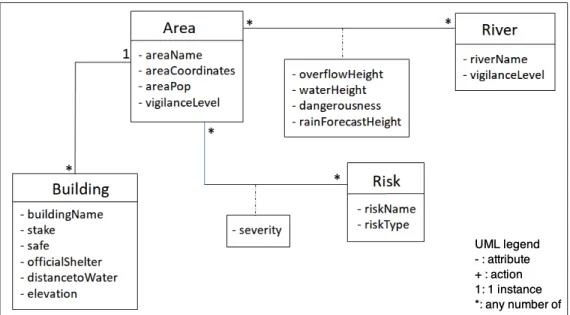
Among the many available clues used by hydrologists and meteorologists to forecast floods, we selected only clues understandable by non-specialists players. As discussed above, this simplified model is more likely to be understood, and sufficient for educational purposes [5]. Figure 3 provides a representation of our environment model in the Unified Modelling Language (UML). Each area has various attributes: its name, geographical coordinates, population, rain forecast, vigilance level; rivers in this area (name, dangerousness, overflow height, water height and vigilance level); buildings (name, type, are they safe, are they official shelters, distance to water, altitude); history of hazards and their severity.
Figure 3: UML conceptual representation of the environment in which flash floods occur. Boxes are the classes, linked by relations with numbers indicating the number of instances. For instance the link between ’building’ and ’area’ states that a building can be in 1 area only; an area can contain any number of buildings.
The weather forecast services (MeteoFrance) is represented as an agent having a precision attribute (0-100%); it predicts the expected amount of rain (in mm). The emergency manager (human-piloted agent) relies on this rain forecast to sets the vigilance colour that is communicated to the population.
3.2
Population
The population is composed of a number of heterogeneous civilian agents, whose attributes are listed in Table 1. Civilians receive vigilance alerts from the emergency manager, and observe real rain. The core of their behaviour is their subjective evaluation of risk (i.e. expected rain) based on their (dynamic) trust in the vigilance alerts, their memory depth (how many past events they can remember), and their update strategy. This strategy reflects their personality: optimistic (consider the minimum amount of rain observed during past events where the same vigilance colour was raised; if a false alarm was raised in the past this can lead to expect no or very little rain); pessimistic (consider the maximum amount of rain; this is very forgiving to false alarms); rational (consider an average of observed rain on past occurrences); or short-memory (consider only the last occurrence). This process is in line with psychological theories saying that humans evaluate risk based on previous experience and emotions [20].
Trust then mediates the relative importance of the official vs personal forecast: if trust is 100%, the civilian will expect exactly the amount of rain corresponding to the vigilance colour; if it is 0% they will expect the subjective value resulting from their past experience, which can be quite low after many false alerts.
Finally the civilians’ decision to evacuate is based on the comparison of this subjective value with a personal risk aversion threshold (initialised randomly), which can lead to delays in evacuation if expected rain is under-estimated. Civilians can also evacuate after directly observing high amounts of rain (exceeding their aversion threshold), but this often happens too late.
Attribute name Range of values Initialisation
Initial trust 0-100% Parameter
Subjective risk 0-?? mm 0 (no risk)
Update strategy min, max, avg, last Parameter
Memory depth 5-10 events Random uniform
Evacuated True, False False
Risk aversion threshold 50-100 mm Random uniform
Table 1: Attributes of civilian agents
4
Implementation
4.1
Goal of the game
The VigiFlood serious game is targeted at the population, with the goal of raising their awareness about the difficulty of choosing the right level of alert under uncertainty and high stakes. This is done by changing the player’s perspective, getting normal citizens to play the role of an emergency manager having to set the level of flood vigilance based on uncertain rain forecast before facing the population reaction. Our hypothesis is that this change of perspective will improve awareness of risk communication challenges.
4.2
Real data
4.2.1 Getting the data
We implemented 2 Python scripts to extract two types of meteorological data useful to our serious game (rain and vigilance level) from websites where archives are publicly available.
• Rain data: Infoclimat6 provides archives of daily, monthly and yearly meteorological data since 1973: tempera-tures, wind, rain, etc. The earlier years can be incomplete. We have implemented a Python parser getraindata (300 lines) to extract the following data: normal monthly rain (seasonal norms computed by Infoclimat between 1981-2010), number of days of rain (at least 1 mm) per month, and actual daily readings of rain amounts. We used this parser for Carcassonne-Salvaza (station number 07635) for the years 2010-2018.
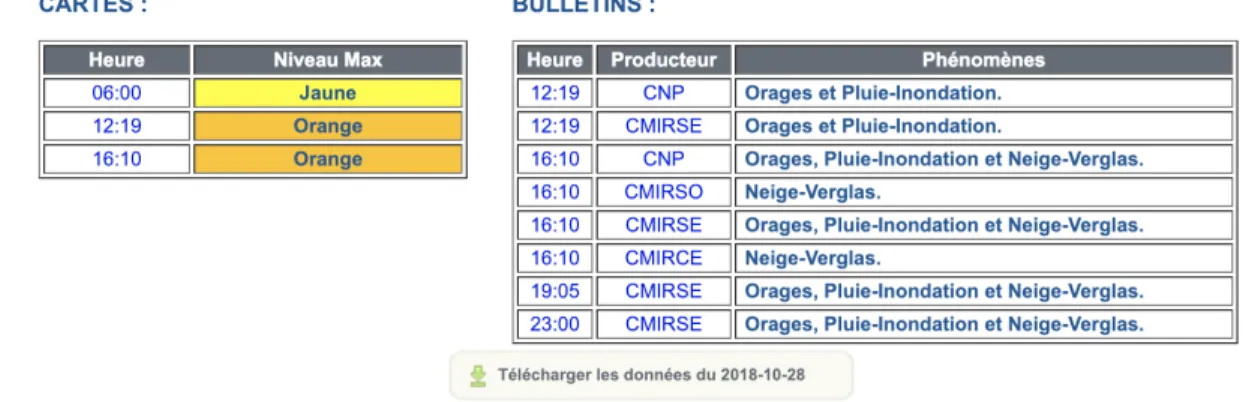
• Vigilance data: Vigilance Public Meteo7
provides a PHP interface (see Figure 4) letting users search for a specific date to get information about vigilance alerts in the entire country that day: time, level (green, yellow, orange, red), emitting agency (each covering a different region; Aude department depends on the CNP agency in Toulouse), and phenomenon concerned (floods, high winds, waves and coastal submersion, snow and black ice, etc). We implemented another parser, getvigidata (300 lines) that can query this website for a series of dates (we used it between 2010 and 2018), download the alert bulletins (XML files), select only relevant ones (emitted by CNP, concerning floods). We searched each bulletin for the vigilance colour associated with rain and floods only. When there was no bulletin for a date, we set the colour to green; when there were several, we kept the highest colour. The output of both scripts is a dictionary dumped to a binary file (with the pickle module) that can be loaded from any other Python script to recover the entire dataset.
4.2.2 Difficulties and limitations
Our main difficulty was handling missing and inconsistently formatted data. First, some daily rain data was missing, in particular for the earlier years, which is why we only extracted data after 2010, but some days are still missing. Also the format of the vigilance bulletins was not always consistent, making it hard to extract the exact colour of the flood alert. Besides, on yellow vigilance days, no bulletin was issued. This means that for these days, in the absence of information, our parser will extract a green vigilance instead of yellow. In fact out of 3294 vigilance values, we have 3009 green days, 274 orange days, 11 red days, and no yellow days. To improve this, we need to find another source of 6https://www.infoclimat.fr. For instance, archives for Carcassonne-Salvaza for the entire month of January 2010: https://www.
infoclimat.fr/climatologie-mensuelle/07635/janvier/2010/carcassonne-salvaza.html and for a specific day 2 January 2010: https: //www.infoclimat.fr/observations-meteo/archives/2/janvier/2010/carcassonne-salvaza/07635.html
Figure 4: Example of Vigilance Public Meteo output for 28 October 2018
vigilance information that also provides yellow alerts; however this is not too much of a problem in this paper since we are mainly interested in the habituation to orange alerts.
Finally, the vigilance level that we extract concerns the entire area covered by the CNP agency, while our daily rain values concerns the Carcassonne-Salvaza meteorological station. This means that the vigilance level is not always consistent with the actual rain amount, when the floods are located in a different part of the South-West region. In our model, this might be interpreted by the residents as a false alarm because an orange vigilance is raised but the observed amount of rain does not match; in reality, humans would understand which area is concerned with the vigilance; to improve this we would need to mine the text of the bulletin for the locations concerned.
4.2.3 Genericity
Data could be recovered from the same sources for other regions with minimal adjustment of the scripts. Data from any source and in any format can also be fed to the game provided it is saved in the expected input dictionary format, making the game generic and easily adaptable to different areas. We are indeed currently discussing with Grenoble township to get local flood data and provide them with an adaptation of VigiFlood. What might change however is the human reaction to floods, that are much less frequent in Grenoble than in Carcassonne.
4.2.4 More realistic hydrological data
Our current model only relies on the forecast height of rain to set the level of vigilance. To improve scenarios realism without undue complexification of the model, we intend in future versions to add a few more relevant clues, namely soil saturation and river capacity. We will use real hydrological data from various national waterways monitoring agencies8. This will require implementing new data extraction scripts and working with hydrologists to design a realistic model of the flash flood process and its prediction.
4.3
Implemented game
4.3.1 Technical details
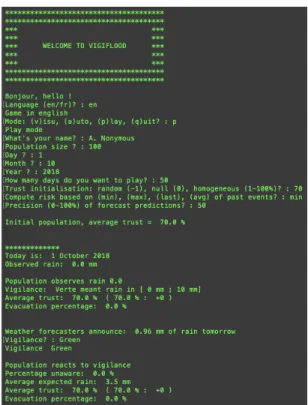
Our current program is a 1800-line Python script. It uses the pickle module to load the data created by our previous scripts (getraindata and getvigidata) from local dump files. This is done only once at the start of the program, and the object created can then be used for the duration of the game. The game has a textual (screenshot on Figure 5) or graphical (screenshot on Figure 6) interface, in either French or English. A batch simulation (no output) over 1 year of simulated time, with 10 repeats and a population of 100 agents, runs in about 120 seconds; with a population of 10000 agents one repeat runs for almost 20 minutes.
4.3.2 Game parameters
Before playing, the user can set a number of parameters: • Population size: number of residents in the population.
• Starting date: between 1st of January 2010 and December 2018, which is the range covered by our data. 8In particular http://www.hydro.eaufrance.fr/ and https://www.vigicrues.gouv.fr/
• Duration of the game: in days (at the latest the game stops on December 31st, 2018).
• Trust initialisation: either heterogeneous with random initial trust for each resident; or homogeneous with a set initial trust value for all residents (between 0 and 100%).
• Risk update strategy: residents can update their subjective risk (expected amount of rain) based on the minimum, maximum, average, or last amount of rain observed on the past occurrences (that they can remember) of the same vigilance level. This strategy is chosen as a parameter and is the same for the entire population. • Precision of rain forecast: the weather forecaster agent computes forecasted rain based on monthly norm of
rain, real observed rain for the next day, and precision parameter (0-100%). With higher precision, the forecast is closer to real rain, while lower precision predicts values closer to the norm, potentially missing exceptional events. • Interface parameters: the user can choose between textual or graphical interface, can toggle text feedback
on/off, and can choose between French and English language.
4.3.3 Game loop
The game loop proceeds as follows:
1. The date of the day is displayed, as well as the observed amount of rain that day (in mm).
2. The residents react to the observation of the rain: they compare it with the current vigilance level (set the day before) to update trust, and they might evacuate if needed.
3. The player is provided with feedback about the population: average trust and its explanation (in terms of how much rain they expected based on the vigilance colour); and percentage of evacuated residents.
4. The weather forecast service announces a forecast amount of rain for the next day. 5. The player is asked to set a vigilance colour based on this forecast.
6. The population reacts to this vigilance level: compute subjective expected rain based on previous similar alerts, and might evacuate if this is above their risk aversion threshold;
7. The player receives feedback about the percentage of the population aware of the risk (if any); their average expected rain (in mm); their average trust (in %); and the percentage that evacuated as a result of the alert. 8. Rain and vigilance for the day are stored in game history, and the time moves forward to the next day.
4.3.4 Getting feedback
At the end of the game, final feedback is displayed in the form of statistics about the population and communication: • Population statistics: average percentage that stay unaware of risk; average expected amount of rain for each
vigilance colour; average trust and its evolution before/after the game; and average evacuation percentage. • Communication statistics: total days played; for each colour: number of alarms raised, number of false alarms
(raised but observed rain lower than expected), number of alarms missed (not raised and observed rain higher than expected).
4.3.5 Game modes
We have implemented 4 possible game modes:
• Visualisation: this mode lets the user explore the available data. The user inputs any date since 2010 and obtains the amount of rain in Carcassonne on that day as well as the vigilance level.
• Play: the user chooses the desired parameters, and plays the role of the emergency communicator in charge of setting the vigilance level. The game proceeds along the loop described above for the selected number of days, and final feedback is provided to let the player debrief his actions.
• Automatic: in this mode the human player is replaced with an AI that automatically selects the vigilance level based on the rain forecast (above 10mm: yellow, above 20mm: orange, above 50mm: red). The same final feedback is displayed at the end. This allows to compare human players’ strategies with a predefined static strategy. • Batch: in this mode all displays are disabled and the game is repeated a number of times with the same
initiali-sation to smooth out the randomness. The output is an average of the trust evolution over all games played with these same parameters. This allows to draw statistics and compare the impact of each parameter.
Figure 5: Screenshot of the textual game interface in “play” mode
5
Preliminary results
5.1
Scenario 1: forecast precision
We have run a first scenario in order to explore the positive and negative evolution of population trust in function of the precision of the weather forecast. We have run the simulation for 3 months, starting October 1st 2018, and therefore including the events of October 14-15, on a population of 100 agents. The population was defined with random heterogeneous initial trust (around an average of about 50%) and their algorithm for computing expected rain is based on the average of past rain. With these settings, we only varied the precision of rain forecast and observed the evolution of trust over these 90 days.
• Perfect forecast (100% precision of the rain forecast): trust increased slightly from an average of 52.81% to an average of 58.71%.
• Realistic forecast (80% precision): average trust remained stable around 50% (from 49.76% to 49.65% exactly). • Same but with 50% forecast precision: the average trust dropped from 54.23% to only 22.57%.
First, we observe that trust decreases faster than it increases: lost trust is hard to restore, so it is best to maintain trust. Second, this shows the importance of reliable forecast to set an accurate vigilance level, yet flash floods are hard to predict because they depend on many other factors than just rain. It is therefore very important that the population is made aware of these difficulties and the fact that false alarms are unavoidable. This is part of being transparent in order to maintain trust, as recommended by [19].
5.2
Scenario 2: population reasoning
The scenario above was based on an averaging of past events, and an “objective” update of trust where observed rain was compared with the objective meaning of the vigilance colour. This means that if the vigilance level was set to orange, the observed rain was compared to the official 20-30mm range supposed to be meant by that alert. But the population actually relies on a subjective expected rain based on their previous experience of past orange vigilance days; this is how they get habituated to this orange vigilance meaning “not much”, when it is raised and it does not rain much. We have therefore run another set of games with a subjective update of trust based on comparing observed rain with the individual’s subjective expectation, computed using our various algorithms. We have set the forecast precision to 100% and run 90 days during year 2010 to limit the number of false alarms in history. Results are very sensitive to the period played and which events occurred:
• The averaging of past rain on same-vigilance days: this strategy considers the more different past alerts, and leads to the worst loss of trust when there are many false alarms. However, correct alarms in the past history will improve the subjective prediction and hence the final trust of the population.
• The “last-event only” strategy means that after a false alarm, the next alarm will be inefficient, people will expect it to be just as false. But then only one correct alarm is enough to reset expectations.
• The “maximal last event” strategy makes residents pessimistic, they will expect as much rain as the worst event on record; the player might lose some amount of trust for announcing too much rain, but people will rather react too much than not enough.
• The “minimal last event” strategy on the other hand makes residents more optimistic: they will only expect as much rain as the lowest rain that occurred in the past when vigilance was set to that same level. This means that they are very likely to not react to an orange vigilance, for instance, as long as they have not forgotten that one day when it was raised and it did not rain.
In reality, we expect humans to use combinations of these strategies, possibly dynamic depending on the context and their personality. Changes are therefore needed in our game to improve the residents’ reasoning, and also to make it heterogeneous. However, validating this reasoning strategy would require to find supporting data about how people actually reason about subjective risk, which might be difficult.
5.3
Visualising the dynamics of trust
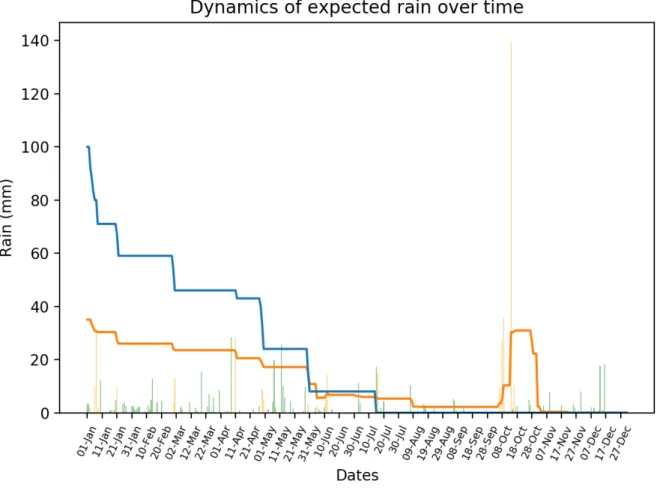
Figure 7 illustrates the dynamics of trust in the population over the real events of year 2018. We initialised the population with full trust (100%), a ’realistic’ update strategy (averaging past rain on orange vigilance days in memory) and a memory depth of 7. One can see that at the start of the year, trust is 100% (blue curve) and the expected amount of rain on orange vigilance days (orange curve) is around 35 (the middle of the official 20-50 mm range).
The bar chart shows the actual amount of rain observed each day, and the colour of each bar shows the associated vigilance colour as announced by the authorities. As the year progresses, various ’false alarms’ are raised where orange vigilance is announced but it does not rain much: as a result, trust goes down, and the average expected rain on orange days also decreases, making the residents more likely to be surprised in case intense rain really occurs. This is the case in October, when the orange vigilance is set on the 14. A positive effect of this surprise is that the expected amount of
Figure 7: Dynamics of trust (blue line), expected rain associated with orange vigilance (orange line), observed rain (bars height), and vigilance (bars colour), over year 2018.
rain on orange vigilance days goes up again (counting that exceptional event in the average), but a negative effect is that trust drops near 0.
We believe such visualisations can be very helpful for people (residents or emergency managers alike) to understand the dynamics of trust in crisis communication. This makes our model already useful as a visualisation, before it is even interactive and playable.
5.4
Discussion
The game exposed here is just a proof-of-concept with limited playability, preventing immediate evaluation. The main obstacle to playability is the repetitiveness of the game that makes it quickly boring. So far the player is asked everyday to set a vigilance colour, while most days almost no rain is forecasted and the vigilance will be green more often than not. This will be improved by creating pedagogical scenarios that do not rely on actual past data, but that trigger more frequent interesting events in order to engage the player. Other ideas for improvement include using an interactive map built from OpenStreetMap data, similar to other serious games used in emergency management (for instance SPRITE [22]); and displaying feedback about emotions of the population.
We would also like to explore other scenarios, in particular assessing the impact of the vigilance thresholds (10mm for yellow, 20mm for orange, 50mm for red) on the average trust of the population and their subjective expected rain, depending on the forecast precision. This will require implementing various (automated) strategies with dynamic vigilance thresholds, and making the choice a parameter of the automated player.
5.5
Prospective evaluation of the game
As discussed above, the underlying behaviour model is grounded on psychological theories and is realistic enough for an educational purpose. What requires evaluation however is the impact of the game. In order to verify our claim that playing this game can improve awareness, we have planned the following evaluation process.
Once the playability of the game has been improved, the first evaluation will be with other researchers and students in our university or at workshops and conferences, in order to refine gameplay and interface; this can happen at medium-term. The second evaluation will require to first implement a logging functionality to store the history of players’ actions, and to analyse logs to draw interesting statistics. We will then be able to analyse players’ strategies to face the different pedagogical scenarios that we define, and observe how they adapt over time to measure the evolution of their awareness.
Finally, a more complex evaluation will be in the form of a survey of people in the affected area (Aude) in order to assess their trust in orange vigilance and will to act on it, before and after playing the game. This survey will also gather their qualitative feedback about the game. This can only happen at longer-term, after finalising the game and carefully designing the experimental protocol and questionnaire.
6
Conclusion
In this paper we have presented the VigiFlood serious game, a disaster alert game based on a real case study, the flash floods in the Aude department in October 2018. Although preliminary, the game is based on real pluviometric and vigilance data from local weather forecast agencies, and already provides interesting insight and novelty compared to previous work. In particular we have shown that it allows the player to visualise the dynamics of trust over time, and the impact of events such as repeated false alarms.
This game is however still a preliminary proof-of-concept and many things remain to improve. The implementation of more roles (journalists, etc) is already ongoing and should be finished at short-term, allowing us to explore more complex pedagogical scenarios. In the longer term we then want to improve playability, evaluate the game and its impact on awareness, and adapt it to other contexts.
References
[1] Carole Adam, Charles Bailly, and Julie Dugdale. Communication during bushfires, towards a serious game for a serious matter. International Journal of Information Systems for Crisis Response and Management (IJISCRAM), 10(2), 2019.
[2] Carole Adam and Julie Dugdale. Agent-based analysis of the spread of awareness in the population in the prodromal phase of bushfires. In Proceedings of the 51st Hawaii International Conference on System Sciences, 2018.
[3] Ma¨el Arnaud, Carole Adam, and Julie Dugdale. The role of cognitive biases in reactions to bushfires. In ISCRAM, Albi, 2017.
[4] Maude Arru, Elsa Negre, and Camille Rosenthal-Sabroux. To alert or not to alert? that is the question. In HICSS-52, pages 649–658, 2019.
[5] Robert Axelrod. Advancing the art of simulation in the social sciences. In Simulating social phenomena, pages 21–40. Springer, 1997.
[6] Nicolas Becu, Marion Amalric, Brice Anselme, Elise Beck, Xavier Bertin, Etienne Delay, Nathalie Long, Nicolas Marilleau, C´ecilia Pignon-Mussaud, and Frederic Rousseaux. Participatory simulation to foster social learning on coastal flooding prevention. Environmental modelling & software, 98:1–11, 2017.
[7] J¨orn Behrens, Florian Klaschka, Lars Mentrup, ULRICH Raape, CHRISTIAN Strobl, SVEN Tessmann, and TORSTEN Riedlinger. Handling uncertainty in tsunami early warning: interaction between decision support and multi-sensor simulation system. In International Conference on Tsunami Warning (ICTW), 2008.
[8] CEPRI. Pr´evision et anticipation des crues et des inondations. Technical report, Centre Europ´een de Pr´evention du Risque Inondation, Paris, France, 2008.
[9] Vincent Covello and Peter M Sandman. Risk communication: evolution and revolution. Solutions to an Environ-ment in Peril, pages 164–178, 2001.
[10] Vincent T Covello. Best practices in public health risk and crisis communication. Journal of Health Communication, 8(1):5–8, 2003.
[11] Monika Friedemann, Ulrich Raape, Sven Tessmann, Thorsten Schoeckel, and Christian Strobl. Explicit modeling and visualization of imperfect information in the context of decision support for tsunami early warning in indonesia. In Symposium on Human Interface, pages 201–210. Springer, 2011.
[12] Bekele Geleta. Community early warning systems: guiding principles. Technical report, Red Cross, 2013. [13] Francisco Hurnen and John McClure. The effect of increased earthquake knowledge on perceived preventability of
earthquake damage. Australas. J. Disaster Trauma Stud., 3, 1997.
[14] JJ. Infanti, J. Sixsmith, MM. Barry, J. Nunez-Cordoba, C. Oroviogoicoechea-Ortega, and F. Guillen-Grima. A literature review on effective risk communication for the prevention and control of communicable diseases in europe. Technical report, European Centre for Disease Prevention and Control, Stockholm, 2013.
[15] Shabana Khan, MJ Crozier, and David Kennedy. Influences of place characteristics on hazards, perception and response: a case study of the hazardscape of the wellington region, new zealand. Natural Hazards, 62(2):501–529, 2012.
[16] Lib´eration-AFP. Aude, 12 morts dans les inondations : la vigilance rouge d´eclench´ee trop tard ? Lib´eration (15 October 2018), 2018.
[17] Atsuo Murata, Tomoko Nakamura, and Waldemar Karwowski. Influence of cognitive biases in distorting decision making and leading to critical unfavorable incidents. Safety, 1(1):44–58, 2015.
[18] Lucy Pearson. Early warning of disasters: Facts and figures. Technical report, Sci Dev Net, 2012.
[19] Barbara Reynolds. Principles to enable leaders to navigate the harsh realities of crisis and risk communication. Journal of Business Continuity & Emergency Planning, 4(3):262–273, 2010.
[20] Barbara Reynolds and Matthew Seeger. Psychology of a crisis. Technical report, US department of health and human services. Center for disease control and prevention., 2014.
[21] Paul Slovic. Perceived risk, trust and democracy. In The perception of risk, chapter 19, pages 316–326. Routledge, 2016.
[22] Franck Taillandier and Carole Adam. A serious game for teaching natural risk management. Simulation & Gaming, 49(4):441–470, 2018.
[23] Galateia Terti, Isabelle Ruin, Milan Kalas, Ilona L´ang, Arnau Cangr`os i Alonso, Tommaso Sabbatini, and Valerio Lorini. Anycare: a role-playing game to investigate crisis decision-making and communication challenges in weather-related hazards. Natural Hazards and Earth System Sciences, 19(3):507–533, 2019.
[24] Liang Emlyn Yang, J¨urgen Scheffran, Diana S¨usser, Richard Dawson, and Yongqin David Chen. Assessment of flood losses with household responses: Agent-based simulation in an urban catchment area. Environmental Modeling & Assessment, 23(4):369–388, 2018.