R E S E A R C H A R T I C L E
Open Access
Never and under cervical cancer screening
in Switzerland and Belgium: trends and
inequalities
Vladimir Jolidon
1*, Vincent De Prez
2, Barbara Willems
2, Piet Bracke
2, Stéphane Cullati
1,3and
Claudine Burton-Jeangros
1Abstract
Background: Research on inequalities in cervical cancer screening (CCS) participation has overlooked the distinction between‘never-’ and ‘under-screeners’ while different socioeconomic and demographic determinants may underlie‘non-’ and ‘under-’ screening participation. This study examines socioeconomic and demographic inequalities in never and under CCS participation. We compare cross-national prevalence and trends among these two groups in Switzerland and Belgium, two countries with similar opportunistic CCS strategy but different healthcare systems.
Methods: Data on 38,806 women aged 20–70 from the Swiss Health Interview Survey (1992–2012) and 19,019 women aged 25–64 from the Belgian Health Interview Survey (1997–2013), both population-based cross-sectional nationally representative surveys, was analysed. Weighted adjusted prevalence ratios were estimated with multivariate Poisson regressions.
Results: Over the studied period, never screening prevalence was about 15% in both Switzerland and Belgium and under screening prevalence about 14.0%. Socioeconomic gradients were found among both never- and under-screeners. Higher income women had lower never and under screening prevalence in Switzerland and a similar gradient in education was observed in Belgium. Importantly, distinct socioeconomic and demographic
determinants were found to underlie never and under screening participation. Never screening was significantly higher among foreign nationals in both countries and this association was not observed in under screening. Never screening prevalence was lower among older age groups, while under screening increased with older age. Over time, age inequalities diminished among never- and under- screeners in Switzerland while educational inequalities increased among never-screeners in Belgium.
Conclusion: Findings revealed that determinants of screening inequalities differed among never- and under-screeners and hence these should be addressed with different public health strategies. Crucially, socioeconomic and demographic inequalities were more pronounced among never-screeners who appeared to face more
structural and persistent inequalities. Differences between the two countries should also be noted. The more liberal-type Swiss healthcare systems appeared to shape income-related screening inequalities, while education appeared to be a stronger determinant of never- and under-screening in Belgium.
© The Author(s). 2020 Open Access This article is licensed under a Creative Commons Attribution 4.0 International License, which permits use, sharing, adaptation, distribution and reproduction in any medium or format, as long as you give appropriate credit to the original author(s) and the source, provide a link to the Creative Commons licence, and indicate if changes were made. The images or other third party material in this article are included in the article's Creative Commons licence, unless indicated otherwise in a credit line to the material. If material is not included in the article's Creative Commons licence and your intended use is not permitted by statutory regulation or exceeds the permitted use, you will need to obtain permission directly from the copyright holder. To view a copy of this licence, visithttp://creativecommons.org/licenses/by/4.0/. The Creative Commons Public Domain Dedication waiver (http://creativecommons.org/publicdomain/zero/1.0/) applies to the data made available in this article, unless otherwise stated in a credit line to the data.
* Correspondence:vladimir.jolidon@unige.ch
1Institute of Sociological Research, University of Geneva, 40 Bd du Pont-d’Arve, 1211 Genève 4, Switzerland
Introduction
Cervical cancer (CC) ranks fourth worldwide for both incidence and mortality [1]. Europe’s overall incidence rate is 11.2 per 100,000 women per year, in age-standardised rate by world population, and Switzerland and Belgium’s incidence rates are lower than the Euro-pean average with 3.8 and 7.8 per 100,000, respectively [1]. CC is the cancer that can most effectively be pre-vented by screening. It was shown that cervical cancer screening (CCS), and particularly organised population-based CCS, reduces both incidence and mortality [2–4]. CCS may have reduced CC incidence and mortality by 80% in different contexts [5]. The beneficial effects of CCS are reflected in the low CC incidence and mortality rates of countries which introduced effective CCS. For example, Western Europe has an average CC incidence rate of 6.8 per 100,000 women, whereas that of Central and Eastern Europe, characterised by lower screening coverage, is of 16.0 per 100,000 [6]. Hence, European and international guidelines recommend that CCS should be organised and population-based [5,7].
Socioeconomic and demographic factors such as edu-cation, income, age, nationality and marital status were shown to be associated with adherence to CCS, and that such disparities persisted over time [8–12]. However, to our knowledge, few studies analysed the distinct social and demographic characteristics of ‘never-’ and ‘under-’ screeners (those who never screened and those who did screen but not within the 3-year recommendation period) and previous research on CCS in Switzerland and Belgium focused on women who screened within the 3-year recommended period [11,13].
This study addresses‘never’ and ‘under’ CCS participa-tion in Switzerland and Belgium using cross-secparticipa-tional data from the Swiss and Belgian national health inter-view surveys spanning from 1992 to 2013. Comparing two countries with similar CCS strategy but different healthcare systems appeared to be particularly relevant. That is, neither country has implemented CCS pro-grammes (although Belgium’s Flemish region started a CCS programme since 2013 [14]) and hence rely on op-portunistic CCS. As opposed to organised CCS, oppor-tunistic CCS leans on the individual’s awareness and initiative to screen and on the doctor’s screening recom-mendation to their patients. In both countries, it is mainly the gynaecologist who recommends a CCS to women during routine examinations [15, 16]. A cross-national perspective on CCS is also relevant since most cancer screening studies tended to focus on specific countries [11,14,17].
The present study distinguishes between ‘never-’ and ‘under-screeners’ and hypothesises that these two groups are affected by different socioeconomic determinants of
cancer screening participation. In contexts of
opportunistic CCS, we expect to find never and under screening inequalities to persist over time in both Switzerland and Belgium. We also expect to find differ-ent patterns and trends of inequalities in CCS participa-tion in the two countries since these vary across contexts and are embedded in health systems. In sum, this study aims to compare the prevalence and trends of never and under CCS in Switzerland and Belgium and investigate socioeconomic and demographic inequalities and the trend of those inequalities over time.
Methods
Our study is based on data collected by the 1992–2012 Swiss Health Interview Survey (SHIS) and the 1997– 2013 Belgian Health Interview Survey (BHIS), both na-tionally representative cross-sectional surveys compris-ing five waves and based on a stratified random selection of residents older than 14 years of age. The former was implemented in 1992, 1997, 2002, 2007 and 2012, and the latter in 1997, 2001, 2004, 2008 and 2013. The SHIS study sample included women aged 20 to 70 years old (N = 38,806) and that of the BHIS included women aged 25 to 64 years old (N = 19,019), based on each country’s CCS age recommendation. After excluding respondents who had missing data on the outcome variable, predic-tors of interest and covariates, and had received cancer treatment/ diagnosis in the past 12 months, 31,800 women were included in the SHIS final sample, and 9442 in the BHIS sample.
National contexts
The Swiss Law on Health Insurance mandated private health insurances to reimburse one CCS every 3 years for women from 18 to 69 years old since 1996 and the Swiss medical guidelines advised to perform the Pap smear test every 3 years on women aged 21–70 years [18]. The Belgian cervical cancer screening policy followed the European guidelines and recommended one CCS every 3 years to 25–64 years old women [14].
Dependent and independent variables
Both the SHIS and the BHIS asked women if they‘ever had a Pap smear’ (yes, no) and, if they answered ‘yes’, when was the last time they had it. The SHIS asked to provide the month and year of the last Pap smear, while the BHIS asked if the Pap smear was undertaken,‘within past 12 months, more than 1 year but not more than 2 years ago, more than 2 years but not more than 3 years ago, more than 3 years but not more than 5 years ago, and not within the past 5 years’. We computed two bin-ary dependent variables to analyse women who ‘never-screened’ (0 = ever screened, 1 = never screened), and women who ‘under-screened’ (0 = screened within the past 3 years, 1 = screened more than 3 years ago).
Predictors of interest and covariates were selected based on their potential association with CCS [9, 11, 16, 19] and their availability in both the SHIS and BHIS. The following predictors of interest were analysed: education (primary, upper secondary, tertiary), monthly household
income (1st to 5th quintile), employment status
(employed, non-employed), partnership status (living, not living with a partner/ spouse), nationality (national citizen, foreign national), area of residence (urban, rural), and age ranges (20–29, 30–39 …). Educational levels followed the International Standard Classification of Education 2011 [20]. Household income was weighted according to the OECD-modified scale in both the SHIS and BHIS (based on the number of adults and children living in the household). Women who were unemployed, at home, retired and out of the labour force were all grouped in the non-employed category. Different age ranges were applied to the SHIS and BHIS samples since CCS recommendations differed in the two countries (Switzerland 20 to 70 and Belgium 25 to 64 years old). To control for potential associations with CCS screen-ing, we included the following covariates in our analysis: self-rated health (very good, good, fair, bad, very bad), self-reported body mass index (underweight < 18.5 kg/ m2, normal weight 18.5 to < 25, overweight & obese 25 to ≥30), a doctor visit (general practitioner or any spe-cialist) in the last 12 months (yes, no) and currently smoking (yes, no). In the BHIS, the “doctor visit in the last 12 months” included a dentist visit whereas it did not in the SHIS.
Statistical analysis
In order to evaluate inequalities in never and under CCS, adjusted prevalence ratios (APR) with 95% confi-dence intervals (CI) were estimated with Poisson regres-sion models and robust variance estimators. Such models were shown to be adequate to analyse binary outcomes, particularly with cross-sectional data, and eas-ier to interpret and communicate with prevalence terms
as the measure of association [21, 22]. The two
dependent variables were analysed in separate models and treated as binary variables. Models presented in Table 2 and TablesS.3a and S.3b (supplementary mate-rials) were adjusted for all the independent variables mentioned above. Models presented in Table2 analysed data from pooled waves and were also adjusted for time (survey wave variable). In order to evaluate the potential time trend of our predictors of interest, we performed one separate multivariate model for each of these with an interaction term between the predictor and the sur-vey wave variable, along with all independent variables. The P-values of the interaction terms for time trend were reported in Table 2. Descriptive statistics and re-gression analyses were weighted for survey sampling and
performed with SPSS 25 and STATA 14. SHIS data were also weighted for non-response bias, as detailed else-where [23]. Collinearity between independent variables was tested with variance inflation factors and did not re-veal any potential collinearity. SHIS and BHIS analysis were performed separately by the authors of this study and results were subsequently compared and discussed. Results
Participants’ characteristics
Swiss and Belgian samples are summarised in Table 1. Some differences between the two samples were partly due to the different age ranges applied; for example, in the Swiss sample, less women achieved primary and ter-tiary education and less women were in the first and sec-ond household income quintiles compared to the Belgian sample. In the Swiss sample, there was a higher proportion of underweight women and foreign nationals, and a lower proportion of women visited a doctor in the last 12 months, compared to the Belgian sample.
Prevalence and trends in never and under cervical cancer screening
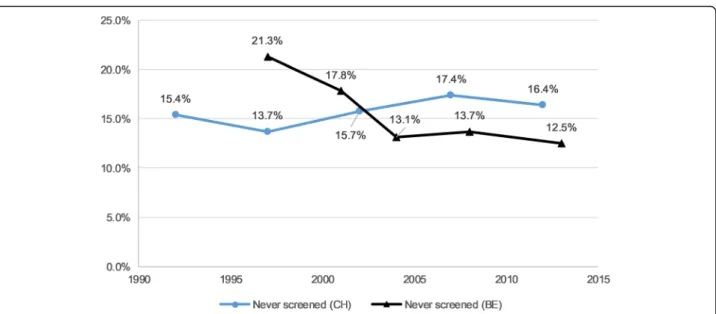
Over the studied period, never CCS prevalence was 15.8% in Switzerland and 15.0% in Belgium (Table 1). The prevalence increased in Switzerland by 6% (APR 1.06, 95%CI 1.04–1.09) and decreased in Belgium by 12% on average by survey wave (APR 0.88, 95%CI 0.84– 0.92) (Table 2). Under CCS prevalence was 13.0% in Switzerland and 14.7% in Belgium. It increased in Belgium by 7% (APR 1.07, 95%CI 1.02–1.13) in average by survey wave and did not show a significant tendency in Switzerland throughout the studied period (APR 1.01, 95%CI 0.98–1.04). Figures 1 and 2 show the prevalence of never and under screening over time for both Switzerland and Belgium.
Inequalities and trends in never and under cervical cancer screening
Never screening
In both Switzerland and Belgium, never screening preva-lence was lower among women with higher levels of education, higher household incomes, living in couple and from older age groups (Table 2). Prevalence was higher among foreign nationals. In Switzerland, never screening prevalence followed a gradient from the 3rd to 5th household income quintiles, i.e. the higher income, the less women never screened. Never screening was higher among women living in a rural area. As showed by the time interaction term, prevalence significantly fluctuated over the 5 waves for partnership status how-ever no clear trend was observed (TableS.3a). The time interaction term for age was also significant and the dif-ference between the APRs of the 20–29 year-old women
Table 1 Characteristics of eligible women in Switzerland (SHIS 1992–2012) and Belgium (BHIS 1997–2013) samplesa
Switzerland (women aged 20–70) N = 31,800
Belgium (women aged 25–64) N = 9442
N % N %
Main independent variables Education
Primary & lower secondary 4716 15 2820 28.8
Upper secondary 21,070 66.7 2925 32.6
Tertiary 6014 18.4 3697 38.6
Monthly household income
1st quintile 7121 23.6 1723 16.2 2nd quintile 6233 20.9 1505 16 3rd quintile 6870 20.6 1776 19.4 4th quintile 6949 21.2 2061 23.1 5th quintile 4627 13.7 2377 25.3 Employment Employed 20,611 64.9 5884 63.7 Unemployed/ non-employed 11,189 35.1 3558 36.3 Partnership status
Single, widow, divorced and separated (and dissolved partnership) 11,830 28.7 2759 24.1
Living with spouse/ partner 19,970 71.3 6683 75.9
Age 20–29 (CH)/ 25–29 (BE) 5097 18.7 1150 11.5 30–39 7593 24.1 2682 29.2 40–49 7066 23.4 2479 27.2 50–59 6025 17.9 2172 22.7 60–70 (CH)/ 60–64 (BE) 6019 15.9 959 9.4 Nationality
National citizen (Swiss / Belgian) 27,653 81.7 8493 93.2
Foreign national 4147 18.3 949 6.8 Area of residence Urban 22,470 72.1 6988 72.4 Rural 9330 27.9 2454 27.6 Covariates Self-rated health Very good 9163 29.1 2403 25.9 Good 18,165 57.5 4833 52.6 Fair 3514 10.6 1798 17.9 Bad 808 2.3 339 3.1 Very bad 150 0.4 69 0.5 BMI Normal weight 18,734 59.3 5538 58.4 Underweight 4502 14.2 425 4.3
Overweight & obesity 8564 26.6 3479 37.3
Doctor visit in the last 12 months
and older age groups reduced from 1992 to 2012. In Belgium, never screening prevalences followed an educa-tion and income gradient as these diminished among more educated and higher income women (Table2). Na-tionality and area of residence had a significant time interaction term but did not show a clear trend (Table S.3a). Education inequality also varied significantly throughout the period, APRs were significant in 1997, 2008 and 2013 and the differences between educational strata slightly increased in 2013. Non-employment also had a significant time trend. At the beginning of the period (1997–2001), non-employed women had a lower never screening prevalence compared to employed women (although APRs were not significant, see Table S.3a, supplementary materials), and this tendency re-versed from 2004 to 2013 with non-employment in-creasing never screening prevalence.
Under screening
In both Switzerland and Belgium, under screening prevalence was significantly associated and diminished with 5th household income quintiles, upper secondary education and living in couple (Table 2). Under screen-ing prevalence increased with the increase of age. In Switzerland, under screening prevalence significantly de-creased following a gradient throughout the 3rd, 4th and 5th household income quintiles. Under screening preva-lence increased with rural area of residence. Time fluctu-ation for household income and age groups was significant. Household income did not show a clear trend and age groups showed a tendency as inequalities between women aged 20–29 and older age groups re-duced over time (see Table S.3b, supplementary mate-rials). In Belgium, under screening prevalence followed a
gradient in education and significantly decreased from upper secondary to tertiary education level. Predictors of interest did not change over the studied period since time interactions were not significant.
Discussion
This study examined trends of never and under CCS prevalence, and socioeconomic and demographic in-equalities, using five waves of the SHIS and BHIS. Over the studied period, both countries had similar preva-lences, about 15% of never screening and 14% of under screening. Although these levels of ‘never’ and ‘under’ CCS participation are relatively low compared to other European countries [24], socioeconomic inequalities were observed as women with higher education and in-come showed lower never screening prevalence in both countries. These inequalities resembled those revealed in other screening tests in other countries which also relied on opportunistic screening [8, 25, 26]. The higher par-ticipation in CCS of highly educated women could be explained by their higher‘health literacy’, a more future-oriented attitude and better risk perception which favour more preventive-focused health decision [27]. Addition-ally, negative attitudes towards cancer screening among lower socioeconomic participants could also be mediat-ing the association between income and screenmediat-ing par-ticipation [17].
Belgium showed a gradient of screening inequalities in education and income levels among never-screeners while this gradient was only evident for income in Switzerland. We may advance that inequalities were shaped by economic determinants in the more liberal-type Swiss healthcare system. Although health insurance is compulsory for all Swiss residents, patient’s healthcare
Table 1 Characteristics of eligible women in Switzerland (SHIS 1992–2012) and Belgium (BHIS 1997–2013) samplesa(Continued)
Switzerland (women aged 20–70) N = 31,800
Belgium (women aged 25–64) N = 9442 N % N % Yes 26,683 83.8 8405 89.4 Smoking No 22,582 71.8 6868 74.3 Yes 9218 28.2 2574 25.7 Dependent variables Never had a CCS Never 5093 15.8 1526 15.0 Ever 26,707 84.2 7916 85.0
Under-screening (subsample: CH: N = 25,680; BE: N = 7788)
Under-screening (overdue CCS) 3581 13.0 1124 14.7
Up-to-date CCS (within the past 3 years) 22,099 87.0 6664 85.3
a
Proportions are weighted for sampling strategy in the SHIS and BHIS, and also for non-response in the SHIS SHIS Swiss Health Interview Survey, BHIS Belgian Health Interview Survey
cost participation and high out-of-pocket payments cause high healthcare forgoing particularly among those with lower incomes [28]. The Swiss healthcare system shortcomings in addressing health inequalities and
implementing more health prevention were already iden-tified and partly attributed to the fragmented nature of the Swiss public health system (with high autonomy of the cantons), which remains an obstacle to coordinate
Table 2 Adjusted prevalence rations (APR) for never and under CCS among eligible women in Switzerland and Belgiuma
Never had a CCS in Switzerland (women aged 20–70) N = 31,800
Never had a CCS in Belgium (women aged 25–64) N = 9442 CC under-screening in Switzerland (women aged 20–70) N = 25,680 CC under-screening in Belgium (women aged 25–64) N = 7788 APR 95% CI
P-values for trend over 5 wavesb
APR 95% CI
P-values for trend over 5 wavesa
APR 95% CI
P-values for trend over 5 wavesb
APR 95% CI
P-values for trend over 5 wavesb Education (ref: primary &
lower secondary) 0.723 0.018* 0.19 0.712 Upper secondary 0.66 0.61– 0.72 0.80 0.68– 0.93 0.90 0.81– 0.99 0.84 0.71– 0.99 Tertiary 0.66 0.59– 0.74 0.59 0.49– 0.70 0.90 0.79– 1.03 0.69 0.56– 0.85 Employment (ref: employed) 0.162 0.001** 0.48 0.834 Unemployed/ non-employed 0.97 0.90– 1.04 1.15 0.97– 1.35 1.03 0.95– 1.13 0.98 0.83– 1.17 Monthly household
income (ref: 1st quintile)
0.214 0.087 0.024* 0.949 2nd quintile 0.81 0.74– 0.89 0.74 0.62– 0.89 0.98 0.88– 1.10 0.87 0.69– 1.08 3rd quintile 0.82 0.75– 0.90 0.73 0.60– 0.89 0.90 0.81– 1.00 0.86 0.69– 1.07 4th quintile 0.78 0.71– 0.86 0.63 0.51– 0.78 0.84 0.75– 0.94 0.92 0.73– 1.16 5th quintile 0.75 0.67– 0.84 0.62 0.49– 0.79 0.80 0.70– 0.92 0.74 0.57– 0.95 Partnership status (ref: no
partner)
0.032* 0.126 0.994 0.843
Living with spouse/ partner (living in couple) 0.71 0.66– 0.76 0.80 0.70– 0.92 0.82 0.76– 0.88 0.86 0.73– 1.00 Age (ref: CH: 20–29 / BE:
25–29) 0.033* 0.977 0.004** 0.524 30–39 0.54 0.49– 0.58 0.62 0.53– 0.74 1.57 1.27– 1.95 1.96 1.28– 3.01 40–49 0.38 0.35– 0.42 0.50 0.42– 0.60 2.70 2.20– 3.30 2.56 1.69– 3.88 50–59 0.39 0.35– 0.44 0.47 0.38– 0.58 3.95 3.23– 4.82 3.26 2.14– 4.97 CH: 60–70 / BE: 60–64 0.56 0.50– 0.62 0.55 0.43– 0.70 6.49 5.31– 7.92 5.18 3.34– 8.04 Nationality (ref: national
citizen) 0.368 0.048* 0.598 0.557 Foreign national 1.65 1.53– 1.78 1.54 1.30– 1.81 0.91 0.80– 1.03 1.15 0.86– 1.53 Area of residence (ref:
urban) 0.88 0.032* 0.705 0.329 Rural 1.14 1.07– 1.22 0.99 0.86– 1.14 1.19 1.11– 1.29 1.03 0.89– 1.20 SHIS / BHIS waves (ref:
wave 1) 1.06 1.04– 1.09 0.88 0.84– 0.92 1.01 0.98– 1.04 1.07 1.02– 1.13 APR Adjusted prevalence ratios. APR are weighted for sampling strategy in the SHIS and BHIS, and also for non-response in the SHIS. Variables used for adjustment: self-rated health, body mass index, doctor visit in the last 12 months, smoking
* =p < 0.05; ** = p < 0.01; *** = p < 0.001 a
SHIS 1992–2012 and BHIS 1997–2013 b
P-values for trend were estimated separately for each predictor of interest with multivariate models including the interaction term (between the predictor of interest and the survey wave variable)
healthcare at the national level [29]. This income gradi-ent of screening inequalities persisted among under-screeners in Switzerland suggesting that lower income women might be foregoing preventive healthcare. As a qualitative study in Switzerland pointed out, women who faced financial hardship either perceived the screen-ing cost to be an “issue” or an “unnecessary expense”, particularly if they considered themselves to be“in good health” [30].
In both countries, education and income inequalities seemed to be less pronounced among under-screeners compared to never-screeners. We hypothesise that
women who screened at least once were more
acquainted with prevention and screening and hence less affected by socioeconomic barriers to screening. Among under-screeners, more practical issues might constitute barriers to screening, such as scheduling a doctor’s ap-pointment during the working week. Conversely, among never-screeners, socioeconomic barriers to undertake a very first screening appeared to be stronger and more persistent over time.
Older age reduced never screening prevalence in both countries and so did living in couple. Women who are in a partnership, and older women, are more likely to visit a gynaecologist, either to conceive or for contracep-tion, and we may expect them to undertake CCS at least once, as they enter their reproductive period [11]. On the other hand, our results interestingly revealed that under screening increased among older women in both countries. We may advance that, as they become older, women start neglecting their routine screening, particu-larly after repeated negative screens, or their doctors
may insist less on screening within the recommended time. Qualitative studies suggested that CCS participa-tion declines as women enter a life stage in which sexu-ality and pregnancy are less central and visits to the gynaecologist less frequent [30]. Older women are also more likely to cite lower levels of concern with CC (or lower perceived risk) and more likely to express embar-rassment and fear of pain [31].
Based on our results, we suggest that never- and under-screeners should be addressed with different strat-egies. A study on CCS uptake in the United Kingdom stressed that policy interventions should consider the CCS non-participants’ heterogeneity of motivations and attitudes. It showed that 51% of CCS non-participants “intended to screen but were overdue” since they failed to translate intention into action, and 28% were unaware of screening [32]. Younger and more disadvantaged women were more likely to be found among those groups. We suggest that measures to reduce inequalities in CCS should focus on never-screeners– with an effort to tackle issues such as screening awareness among the most disadvantaged– while interventions among
under-screeners should pay attention to the
intention-behaviour gap in order to improve participation (for ex-ample, through reminders), access and practical issues (such as in scheduling a doctor’s appointment), although inequalities among under-screeners should not be neglected.
In both countries, screening inequality between na-tionals and foreigners was found among never-screeners, although not among under-screeners which supports our hypothesis that sociodemographic inequalities were
Fig. 1“Never had a CCS” weighted prevalence among eligible women in Switzerland and Belgium1.1Swiss Health Interview Survey (SHIS) 1992– 2012 and Belgian Health Interview Survey (BHIS) 1997–2013; Adjusted APR for time: CH = 95%CI 1.04–1.09, and BE = 95%CI 0.84–0.92 (see Table2). Notes: CH = Switzerland; BE = Belgium
stronger among never-screeners. Living in rural area in-creased both never and under screening prevalence in Switzerland, while such inequalities were not found in Belgium. This is consistent with studies of other cancer screening tests in Switzerland [33] which pointed out that women living in a rural area might under-screen while their urban counterparts are more likely to over-screen [34,35].
Over the studied period, never CCS prevalence in-creased 6% in average by survey wave in Switzerland while it decreased 12% by survey wave in Belgium. Under screening did not show a clear tendency in Switzerland and it increased 7% by survey wave in Belgium. In Switzerland, Burton-Jeangros et al. [11] ob-served a slight decrease of CCS prevalence, based on the same dataset of the present study. Our results suggested that this decrease stemmed from a slight increase of never screening – rather than under screening – over the same period. In Belgium, an invitation programme was in place in Flanders from the mid 1990’s until the early 2000’s and could have contributed to reducing never screening. Nevertheless, no impact of sending invi-tations on screening uptake was found [14].
Inequalities between age groups among both never-screeners and under-never-screeners diminished in Switzerland throughout the studied period. This may have been caused by a cohort effect, i.e. by a generation of women who started to screen more at a younger age than the previous generation, and continued to do so as they
be-came older. In Belgium, we observed increasing
education-based inequalities among never-screeners over time which were explained in previous studies by a
combination of under-screening among women with lower education and over-screening among women with higher education in a context of opportunistic screening [13].
Reliance on opportunistic screening in Switzerland and Belgium may have contributed to the persistence of the CCS inequalities observed in our study. Studies showed that opportunistic screening entailed higher screening inequalities, inconsistent quality and ineffi-ciencies such as over-screening [8, 36–38]. As a Swiss-Belgian comparative study on screening overuse showed, although declining, over-screening is persistent in both countries [35]. An organised approach to CCS, with quality assurance framework and strategies to improve never and under-screeners’ participation, may minimise the adverse effects of unequal screening and maximise benefits from a public health and cost perspective [37,
39]. In Switzerland, a nation-wide CCS programme
would help tackle screening inequalities in the context of a fragmented healthcare system which contributes to reproducing health inequalities. In Belgium, the CCS organised programme which was launched in Flanders should be extended nationwide to avoid reinforcing re-gional inequalities.
Limitations of our study are worth noting. The SHIS and BHIS are cross-sectional surveys hence our results do not measure whether individual respondents com-plied or not across time with the 3-year recommended screening interval. However, from an aggregated (popu-lation) level perspective, our ‘under-screening’ variable allowed us to account for the women who screened ‘more than 3 years ago’ (the ‘under-screeners’), as
Fig. 2“Under-screening” weighted prevalence among eligible women in Switzerland and Belgium1.1Swiss Health Interview Survey (SHIS) 1992– 2012 and Belgian Health Interview Survey (BHIS) 1997–2013; Adjusted APR for time: CH = 95%CI 0.98–1.04, and BE = 95%CI 1.02–1.13 (see Table2). Notes: CH = Switzerland; BE = Belgium
opposed to those who screened within the recom-mended interval. We could not control for related pre-ventive practices of HPV vaccination and HPV testing in our models since this information was not available in the SHIS and the BHIS (only the BHIS 2013 wave col-lected information on HPV vaccine uptake). HPV
vac-cination programmes were implemented among
teenagers and young women in 2008 and 2010 in Switzerland and Belgium respectively (2011 in the French-speaking part of Belgium) [40,41]. Consequently, these could only have affected the CCS practices of the youngest cohort of the SHIS’ and BHIS’ last wave (not-ably, only 25 women aged 25–49 had the vaccine in the BHIS 2013 wave) and, hence, influenced our results in a negligible way. Regarding HPV testing, this test has a 5-year recommended screening interval which is larger than the one of Pap smear. GPs and gynaecologists could have offered this test as an alternative to Pap smear which may have affected our under-screening measure. Nonetheless, CCS recommendation guidelines were based on Pap smear as primary screening in both countries during the studied period [14,18]. Gynaecolo-gists implemented Pap smear as part of the routine check-up in both countries and HPV testing was not re-imbursed by the health insurance in Switzerland, and only partly in Belgium [14, 15, 42–44]. The effects of HPV vaccination and testing on CCS practices are diffi-cult to evaluate. However, our data did not show an in-crease of under screening which would suggest that new preventive techniques had supplanted Pap smear since 2008 in either country. We cannot account for the com-plexity of national contexts and healthcare systems. The healthcare system design (public and private mix), levels of public health expenditures, density of general practi-tioners, payment schemes for general practitioners and specialists, insurance coverage, amount of private out-of-pocket payments, accessibility of care, as well as cultural and environmental factors, affect screening participation and inequalities and may produce confounding despite adjustments [12,45,46]. Self-reported CCS data may be affected by recall bias. Studies showed that women fairly correctly reported CCS uptake, however, they tend to re-port their last CCS more recently than it actually took place - a phenomenon described as“telescoping” - which may cause over-reporting of screening within a specific
timeframe and hence underestimation of
under-screening [47,48]. Women may also over-report CCS by recalling a routine gynaecologic exam without CCS as including a CCS [47]. Additionally, social desirability bias may lead to underestimates of never and under par-ticipation or time since last screening test [47] and re-sponse bias might also affect the data since women with higher education level tend to report screening partici-pation more often [49]. In spite of the SHIS and BHIS
representativeness limitations, the use of the weighting factors allowed for inference from the sample to the total population of Switzerland and Belgium. Finally, fur-ther research is needed to inquire the motivations and attitudes which lie behind ‘never’ or ‘under’ screening participation in order to design policy interventions. Conclusion
Screening inequalities among never- and
under-screeners persisted over time in both Switzerland and Belgium and socioeconomic and demographic determi-nants of screening inequalities differed between these groups. Inequalities appeared to be more pronounced amongst never-screeners compared to under-screeners hence results stressed that the two groups should be ad-dressed with different strategies. Differences were highlighted between the two countries. Inequalities ap-peared to be shaped by economic determinants in the more liberal-type Swiss healthcare system, as showed by the income gradient among never- and under-screeners, while inequalities followed an education gradient in Belgium. Finally, both Switzerland and Belgium could benefit from an organised approach to CCS in order to mitigate the screening inequalities observed in our study and improve efficiency from a public health perspective. Supplementary information
Supplementary information accompanies this paper athttps://doi.org/10. 1186/s12889-020-09619-z.
Additional file 1 : Table S.3a. Adjusted prevalence rations (APR) for never CCS among eligible women in Switzerland and Belgiuma. Table S.3b. Adjusted prevalence rations (APR) for under CCS among eligible women in Switzerland and Belgiuma.
Abbreviations
CC:Cervical cancer; CCS: Cervical cancer screening; SHIS: Swiss Health Interview Survey; BHIS: Belgian Health Interview Survey; CH: Switzerland; BE: Belgium; APR: Adjusted prevalence ratio
Acknowledgements Not applicable.
Authors’ contributions
Conceived and designed the study: VJ, VDP, BW, PB, SC, CBJ. Analysed the data: VJ, VDP. Wrote the manuscript: VJ. Reviewed and were involved in writing the manuscript: VJ, VDP, BW, PB, SC, CBJ. Approved the final manuscript: VJ, VDP, BW, PB, SC, CBJ.
Funding
This work was completed in the framework of a project supported by a grant of the Research Foundation– Flanders (grant number
FWOOPR2018005701), and the Swiss National Science Foundation (grant number 176115). The funding bodies had no involvement in the study design, the collection, analysis, and interpretation of data, the writing of the manuscript, nor in the decision to submit the manuscript for publication.
Availability of data and materials
This study used the data from the Swiss Health Interview Survey and the Belgium Health Interview Survey. The Swiss data are available for fee (1600 Swiss Francs, plus 7.7% tax) and users must request permission from the
Swiss Federal Statistical Office. The Belgian data are available for researchers, but according to the Belgian legislation an authorisation has to be obtained from the Belgian Commission for the Protection of Privacy.
Ethics approval and consent to participate Not applicable.
Consent for publication Not applicable.
Competing interests
The authors declare that they have no competing interests.
Author details
1Institute of Sociological Research, University of Geneva, 40 Bd du Pont-d’Arve, 1211 Genève 4, Switzerland.2Department of Sociology, Ghent University, Korte Meer 5, 9000 Ghent, Belgium.3Population Health Laboratory, University of Fribourg, Rte des Arsenaux 41, 1700 Fribourg, Switzerland.
Received: 5 March 2020 Accepted: 27 September 2020
References
1. Ferlay J, Ervik M, Lam F, Colombet M, Mery L, Piñeros M, et al. Global cancer observatory: cancer today. Lyon: International Agency for Research on Cancer. Available from:https://gco.iarc.fr/today; 2018.
2. Bray F, Loos AH, McCarron P, Weiderpass E, Arbyn M, Moller H, et al. Trends in cervical squamous cell carcinoma incidence in 13 European countries: changing risk and the effects of screening. Cancer Epidem Biomar. 2005; 14(3):677–86.
3. Vesco KK, Whitlock EP, Eder M, Lin J, Burda BU, Senger CA, et al. Screening for Cervical Cancer: A Systematic Evidence Review for the US Preventive Services Task Force. Rockville: U.S. Preventive Services Task Force Evidence Syntheses, formerly Systematic Evidence Reviews; 2011.
4. Peirson L, Fitzpatrick-Lewis D, Ciliska D, Warren R. Screening for cervical cancer: a systematic review and meta-analysis. Syst Rev. 2013;2:35. 5. IARC. (International Agency for Research on Cancer). IARC handbooks of
cancer prevention. Volume 10: cervix cancer screening. Lyon: IARC Press; 2005.
6. Bray F, Ferlay J, Soerjomataram I, Siegel RL, Torre LA, Jemal A. Global cancer statistics 2018: GLOBOCAN estimates of incidence and mortality worldwide for 36 cancers in 185 countries. CA Cancer J Clin. 2018;68(6):394–424. 7. Arbyn M, Anttila A, Jordan J, Ronco G, Schenck U, Segnan N, et al. European
guidelines for quality assurance in cervical cancer screening. Second ed. Luxembourg: Office for Official Publications of the European Communities; 2008.
8. Palència L, Espelt A, Rodríguez-Sanz M, Puigpinós R, Pons-Vigués M, Pasarín MI, et al. Socio-economic inequalities in breast and cervical cancer screening practices in Europe: influence of the type of screening program. Int J Epidemiol. 2010;39(3):757–65.
9. Limmer K, LoBiondo-Wood G, Dains J. Predictors of cervical cancer screening adherence in the United States: a systematic review. J Adv Pract Oncol. 2014;5(1):31–41.
10. Damiani G, Basso D, Acampora A, Bianchi CB, Silvestrini G, Frisicale EM, et al. The impact of level of education on adherence to breast and cervical cancer screening: evidence from a systematic review and meta-analysis. Prev Med. 2015;81:281–9.
11. Burton-Jeangros C, Cullati S, Manor O, Courvoisier DS, Bouchardy C, Guessous I. Cervical cancer screening in Switzerland: cross-sectional trends (1992-2012) in social inequalities. Eur J Pub Health. 2017;27(1):167–73. 12. Willems B, Bracke P. The education gradient in cancer screening
participation: a consistent phenomenon across Europe? Int J Public Health. 2018;63(1):93–103.
13. Willems B, Bracke P. The impact of regional screening policies on the diffusion of cancer screening participation in Belgium: time trends in educational inequalities in Flanders and Wallonia. BMC Health Serv Res. 2018;18(1):943.
14. Arbyn M, Fabri V, Temmerman M, Simoens C. Attendance at cervical cancer screening and use of diagnostic and therapeutic procedures on the uterine
cervix assessed from individual health insurance data (Belgium, 2002-2006). PLoS One. 2014;9(4):e92615.
15. Arbyn M, Van Oyen H. Cervical cancer screening in Belgium. Eur J Cancer. 2000;36(17):2191–7.
16. Richard A, Rohrmann S, Schmid SM, Tirri BF, Huang DJ, Güth U, et al. Lifestyle and health-related predictors of cervical cancer screening attendance in a Swiss population-based study. Cancer Epidemiol. 2015;39(6): 870–6.
17. Cullati S, Charvet-Bérard AI, Perneger TV. Cancer screening in a middle-aged general population: factors associated with practices and attitudes. BMC Public Health. 2009;9:118.
18. Tirri BF, Petignat P, Jaccot-Guillarmod M, Mueller MD, Fehr M, Kind AB. Recommandations pour la prévention du cancer du col de l'utérus, Avis d'expert No 50. Bern: Société Suisse de Gynécologie et d'Obstétrique (SSGO); 2018.
19. Nelson W, Moser RP, Gaffey A, Waldron W. Adherence to cervical cancer screening guidelines for U.S. women aged 25–64: data from the 2005 Health Information National Trends Survey (HINTS). J Womens Health (Larchmt). 2009;18(11):1759–68.
20. UNESCO-UIS. International Standard Classification of Education: ISCED 2011. Paris: UNESCO Institute for Statistics; 2012.
21. Barros AJ, Hirakata VN. Alternatives for logistic regression in cross-sectional studies: an empirical comparison of models that directly estimate the prevalence ratio. BMC Med Res Methodol. 2003;3:21.
22. Zou G. A modified poisson regression approach to prospective studies with binary data. Am J Epidemiol. 2004;159(7):702–6.
23. SFSO (Swiss Federal Statistical Office). L’enquête suisse sur la santé 2012 en bref: Conception, méthode, réalisation; 2010. p. 1–68.
24. Kesic V, Poljak M, Rogovskaya S. Cervical cancer burden and prevention activities in Europe. Cancer Epidemiol Biomark Prev. 2012;21(9):1423–33. 25. McKinnon B, Harper S, Moore S. Decomposing income-related inequality in
cervical screening in 67 countries. Int J Public Health. 2011;56(2):139–52. 26. Walsh B, Silles M, O'Neill C. The importance of socio-economic variables in
cancer screening participation: a comparison between population-based and opportunistic screening in the EU-15. Health Policy. 2011;101(3):269–76. 27. Ratzan SC. Health literacy: communication for the public good. Health
Promot Int. 2001;16(2):207–14.
28. Guessous I, Gaspoz JM, Theler JM, Wolff H. High prevalence of forgoing healthcare for economic reasons in Switzerland: a population-based study in a region with universal health insurance coverage. Prev Med. 2012;55(5):521–7. 29. OECD/WHO. OECD Reviews of Health Systems: Switzerland 2011.
Switzerland: OECD Publishing; 2011.
30. Fargnoli V, Petignat P, Burton-Jeangros C. Dépistage du cancer du col de l’utérus en Suisse romande: des trajectoires contrastées. Rev Med Suisse. 2015;11(479):1358–61.
31. Waller J, Jackowska M, Marlow L, Wardle J. Exploring age differences in reasons for nonattendance for cervical screening: a qualitative study. Bjog-an Int J Obstetr Gynaecol. 2012;119(1):26–32.
32. Marlow LAV, Chorley AJ, Haddrell J, Ferrer R, Waller J. Understanding the heterogeneity of cervical cancer screening non-participants: data from a national sample of British women. Eur J Cancer. 2017;80:30–8. 33. Feller A, Schmidlin K, Bordoni A, Bouchardy C, Bulliard JL, Camey B, et al.
Socioeconomic and demographic inequalities in stage at diagnosis and survival among colorectal cancer patients: evidence from a Swiss population-based study. Cancer Med. 2018;7(4):1498–510.
34. Bouchardy C, Pury P, Raymond L. Le cancer en suisse: principales données épidémiologiques (2e partie). Bull Suisse Cancer. 2005;2:121–8.
35. De Prez V, Jolidon V, Willems B, Cullati S, Burton-Jeangros C, Bracke P. Cervical cancer (over) screening in Belgium and Switzerland: trends and social inequalities. Eur J Pub Health. 2020;30(3):410–5.
36. Nieminen P, Kallio M, Anttila A, Hakama M. Organised vs. spontaneous pap-smear screening for cervical cancer: a case-control study. Int J Cancer. 1999; 83(1):55–8.
37. Arbyn M, Rebolj M, De Kok IM, Fender M, Becker N, O'Reilly M, et al. The challenges of organising cervical screening programmes in the 15 old member states of the European Union. Eur J Cancer. 2009;45(15):2671–8. 38. Elfström KM, Arnheim-Dahlström L, von Karsa L, Dillner J. Cervical cancer
screening in Europe: quality assurance and organisation of programmes. Eur J Cancer. 2015;51(8):950–68.
39. Anttila A, Arbyn M, Vuyst HD, Dillner J, Dillner L, Franceschi S, et al. European guidelines for quality assurance in cervical cancer screening,
second edition, supplements. Luxembourg: Office for Official Publications of the European Union; 2015.
40. Chrysostomou AC, Stylianou DC, Constantinidou A, Kostrikis LG. Cervical Cancer Screening Programs in Europe: The Transition Towards HPV Vaccination and Population-Based HPV Testing. Viruses-Basel. 2018;10(12): 729.
41. Swiss Federal Office of Public Health (FOPH). Programmes de vaccination contre les HPV en Suisse: synthèse des années 2007 à 2010. Bull OFSP. 2010; 43:949–53.
42. Vassilakos P, Catarino R, Frey Tirri B, Petignat P. Cervical cancer screening in Switzerland: time to rethink the guidelines. Swiss Med Wkly. 2015;145: w14112.
43. Burton-Jeangros C, Fargnoli V, Vieira Bertho I, Fioretta J. Women’s views on cervical cancer screening. A qualitative study of barriers to screening and HPV self-sampling acceptability. Geneva: University of Geneva; 2013. 44. Hulstaert F, Arbyn M, Huybrechts M, Vinck I, Puddu M, Ramaekers D. Cervical
cancer screening and human papillomavirus (HPV) testing. KCE reports vol. 38C. Brussels: Belgian Health Care Knowledge Centre; 2006.
45. Coughlin SS, Leadbetter S, Richards T, Sabatino SA. Contextual analysis of breast and cervical cancer screening and factors associated with health care access among United States women, 2002. Soc Sci Med. 2008;66(2):260–75. 46. Jusot F, Or Z, Sirven N. Variations in preventive care utilisation in Europe.
Eur J Ageing. 2012;9(1):15–25.
47. Rauscher GH, Johnson TP, Cho YI, Walk JA. Accuracy of self-reported cancer-screening histories: a meta-analysis. Cancer Epidemiol Biomark Prev. 2008; 17(4):748–57.
48. Caplan LS, McQueen DV, Qualters JR, Leff M, Garrett C, Calonge N. Validity of women’s self-reports of cancer screening test utilization in a managed care population. Cancer Epidem Biomar. 2003;12(11):1182–7.
49. Howard M, Agarwal G, Lytwyn A. Accuracy of self-reports of pap and mammography screening compared to medical record: a meta-analysis. Cancer Causes Control. 2009;20(1):1–13.
Publisher’s Note
Springer Nature remains neutral with regard to jurisdictional claims in published maps and institutional affiliations.