HAL Id: hal-03003215
https://hal.archives-ouvertes.fr/hal-03003215
Submitted on 13 Nov 2020
HAL is a multi-disciplinary open access
archive for the deposit and dissemination of
sci-entific research documents, whether they are
pub-lished or not. The documents may come from
teaching and research institutions in France or
abroad, or from public or private research centers.
L’archive ouverte pluridisciplinaire HAL, est
destinée au dépôt et à la diffusion de documents
scientifiques de niveau recherche, publiés ou non,
émanant des établissements d’enseignement et de
recherche français ou étrangers, des laboratoires
publics ou privés.
Space charge measurement by PEA on an aeronautical
cable
Amin Benyoucef, Laurent Berquez, G. Teyssedre, Eddy Aubert
To cite this version:
Amin Benyoucef, Laurent Berquez, G. Teyssedre, Eddy Aubert. Space charge measurement by PEA
on an aeronautical cable. IEEE Internat. Conf. on Dielectrics (ICD), Valencia, Spain, 5-9 July 2020.,
Jul 2020, valencia, Spain. pp. 351-354. �hal-03003215�
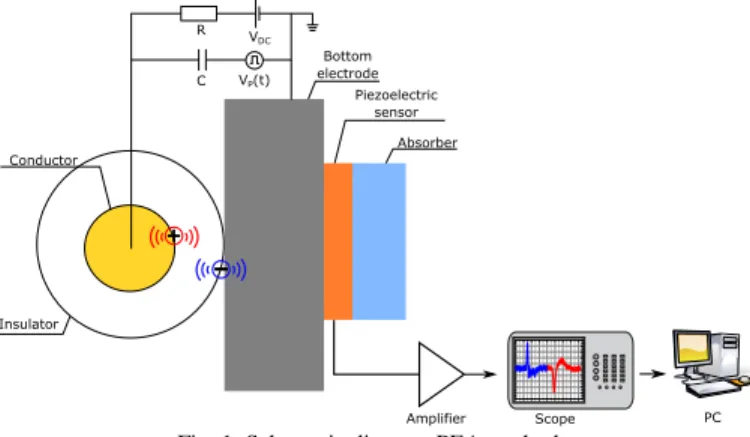
Fig. 1. Schematic diagram PEA method
Space Charge Measurement by PEA Method
on an Aeronautical Cable
Amin Benyoucef (1, 2), Laurent Berquez (1), Gilbert Teyssedre (1), Eddy Aubert (2, 3)
(1) Laplace, Université Paul Sabatier Bat 3R3, 118 Route de Narbonne 31062 Toulouse, France(2) IRT Saint Exupery, 3 Rue Tarfayan 31405 Toulouse, France (3) Safran Electrical and Power, 1 Rue Louis Blériot, 31700 Blagnac, France
Abstract- Technological evolutions in aircraft networks let us foresee an increase of the DC voltage up to several kilovolts while keeping minimal insulation thickness. This trend results in a strong increase of the electric field in the insulations and space charge can become an issue for the reliability of the systems. Indeed, space charge accumulation modifies the electric field distribution and may lead to a premature aging of the dielectric. Besides, the field distribution in complex structures such as multilayers cannot be anticipated under DC as easily as under AC because conductivity is more difficult to estimate and varies much more than permittivity.
In this paper, we present the first results obtained on aeronautical cables. For this, it was necessary to develop a deconvolution strategy adapted to aeronautical cables to obtain electric field and charge density profiles in a part of the insulation thickness.
I. INTRODUCTION
The increase in the power of electrical systems of future aircraft goes with an increase of the AC and DC voltages of power networks. For DC systems, the phenomenon of partial discharges, well-known in case of AC voltage, is actively studied [1] with much less consequences as under AC as the frequency of occurrence is strongly reduced. However, other effects, such as space charge accumulation, are to be considered. For the insulation of terrestrial or submarine HVDC energy cable systems, with voltages of several hundreds of kV, the problem of space charge is known and deeply investigated for long.
Even if the voltage levels in aeronautics are much lower, an increase of the DC buses beyond 3 kV is foreseen while the insulation thickness is minimized to optimize the mass of the aeronautical network. This means that a significant increase in the electric field in the insulations could occur, possibly to levels where space charges could be accumulated and the field threshold for non-linear conduction be reached. Therefore, space charge effects must be investigated, mastered and taken into account in future technologies.
To meet these challenges, our objective is to develop a test bench to measure space charge distributions on aeronautical cables and to estimate the evolution of the electric field distribution in particular in multilayer arrangements of cable insulation and to identify the stress regimes where these phenomena occur.
II. PEAMETHOD APPLIED TO AN AERONAUTICAL CABLE
A. PEA method
For the first time in the 90’s, a PEA system was introduced for the measurement of the space charge on cable for high voltage energy transmission [2, 3]. The method consists in applying a voltage pulse to the sample, producing oscillation of the charges around their equilibrium positions, thus generating acoustic waves. The acoustic waves are then converted into an electrical signal through a piezoelectric sensor and this signal is amplified and digitally processed by a deconvolution algorithm (Fig.1).
Resorting to PEA device for cables, various variants were produced, depending on the way the voltage pulse is applied: through a capacitor connected to cable conductor, or on a part of the cable sample having its outer sheath separated from that at the measurement point, or even with pulse application directly on the measurement cell [4]. As often in aeronautic domain, the samples had no outer sheath. Therefore, the most convenient way to apply the voltage pulses was with using a different cable as decoupling capacitor.
B. Aeronautical cable
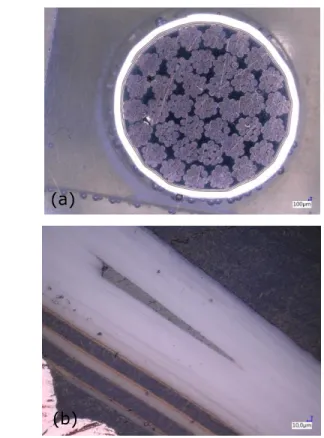
The aeronautical cable studied here is a typical example of an aircraft cable section in which the insulation is wound on the multi-stranded copper conductor of 3.47 mm radius, designed to avoid skin effect in the conductor. A polyimide (PI) layer is usually wound directly onto the conductor and is used because of its high mechanical strength and its dielectric insulation and thermal properties. The outer tape of the cable is a polytetrafluoroethylene (PTFE) which limits fire and arc tracking problems. The insulation system has a total thickness
Fig. 3. Calibration and test protocol
Fig. 4. PEA measurement in the calibration phase Fig. 2. Section of aircraft cable with copper alloy (a), with focus on
insulator layers (b).
of approximately 360 µm (Fig. 2.a). In Fig. 2.b, we can see that on each face of the PI ribbons are layers of fluorinated ethylene propylene (FEP) with a thickness of about 16 µm. This FEP layer is introduced to improve the adhesion between PI layers and between PI and PTFE layers.
C. Protocol and calibration
The protocol used for present PEA measurements is shown in Fig. 3. It consists of two steps, a first step called calibration where a voltage of 1 kV is applied which is to be used to evaluate the transfer function of the system [5]. Then in a second step, so-called test phase, a voltage of 9 kV is applied for 120 min with a relaxation phase lasting 120 min. The step is repeated with a reverse possibility (-9 kV for 120 min followed by a relaxation phase of 120 min). Fig. 4 shows a PEA signal during the calibration phase. When a voltage of 1 kV is applied, a first peak appears at around 75 ns which corresponds to the capacitive charge at the ground electrode. From 215 ns on, a multitude of peaks are observed very close together. This is presumably due to the difference in permittivity between the PI and FEP layers (εr=2.4 and 2.1 for
PI and FEP, respectively), which generates a signal at the interface of the two materials [6]. Furthermore, due to the low thicknesses of PI and FEP, multiple reflections are picked up by the piezoelectric sensor [7]. Further, with considering an obvious dispersion of the signal, then the different signals merge and overlap as the signal corresponding to the inner electrode (cable conductor) is approached. Ultimately, it is not
possible to distinguish the different signals necessary to evaluate the attenuation and dispersion factors during the deconvolution step. Indeed, in previous PEA measurements on samples with cylindrical geometry, the attenuation and dispersion spectra were determined considering that the acoustic signal generated at the inner interface (at cable conductor) due to capacitive charges is modified during its propagation. As in the present case the signal due to internal charges is spoiled, the method for space charge recovery had to be modified as depicted below.
D. Deconvolution method
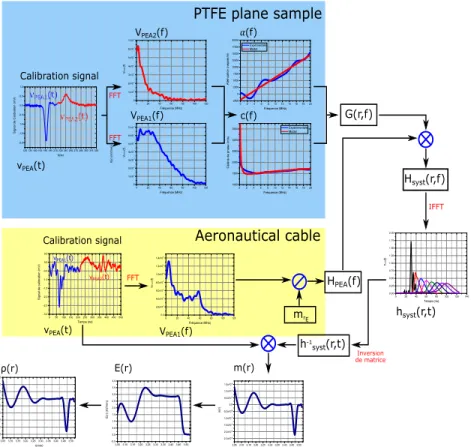
In the calibration signal, an acoustic response is produced due to the difference in permittivity between PI and FEP. It leads to complexity with the response due to the capacitive charge at the conductor as well as the multiple reflections generated. Consequently, the information on attenuation and dispersion can not be retrieved from this calibration signal. The strategy addressed to be able to proceed to deconvolution was to characterize the outer layer of PTFE insulation for acoustic properties. As shown in Fig. 5, a calibration measurement is first performed on a flat PTFE sample without charges to recover attenuation and dispersion information.
Fig. 5. Deconvolution synoptic for a multilayer insulation cable
Next, we perform a measurement on an aeronautical cable in the calibration stage to allow us to have the transfer function of the PEA cell. Thus, by multiplying the attenuation and dispersion information with the transfer function of the cell, we can have the transfer function of the system. By carrying out the convolution product between a PEA signal carried out on an aeronautical cable and the transfer function of the system, the evolution of the charge density and the evolution of the electric field on the outer layer of the PTFE insulation can be followed.
III. RESULTS
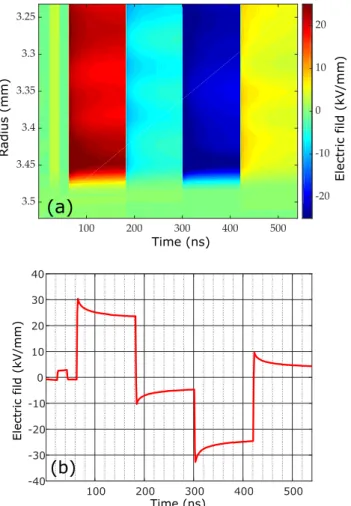
Preliminary space charge measurements have been achieved following the protocol shown in Fig. 3. Our deconvolution method allows us to evaluate the electric field as well as the charge density in the PTFE insulation layer, which represents the major part of the insulation thickness (see Fig. 2). In Fig. 6.a we have represented a mapping of the electric field over the depth of the outer layer of cable insulation (232 µm in thickness) along the established protocol duration. Fig. 6.b shows the variation of the electric field at the lower electrode as a function of the protocol duration. The geometrical electric field calculated at the outer radius, taking into account the multilayer dielectric, for a voltage of 9 kV is 24 kV/mm. During the entire application of the 9 kV voltage, the measured electric field decreases from about 30 kV/mm to 23 kV/mm. Moreover, during the relaxation phase a residual electric field of opposite sign appears and decreases over time.
When a voltage of -9 kV is applied, the field distribution is symmetrical: it varies from about -30 kV/mm to -23 kV/mm as a function of time. During the relaxation phase, an electric field of the opposite sign also appears and decreases in the course of time. The decrease of the electric field, and the appearance of an electric field of opposite sign during the relaxation phase reflect the formation of image charges [8].
The appearance of image charge at the outer electrode of the cable is due to the presence of space charge in the cable insulation volume. In Fig.7.a the charge density profile at 1 kV during the calibration step is represented. It gives an illustration on the way a capacitive charge is pictured by the system used. The image charge peak width at half-maximum is about 20 µm.
In Fig.7.b, we have represented the charge density profiles under an applied voltage of 9 kV at different application times. At the lower electrode, we notice a decrease of the image charge density in the course of time. We believe that the origin of this space charge is related to the Maxell-Wagner effect [9]: because of the presence of multilayers of different materials, a field redistribution may occur due to the difference in electrical conductivity in the different materials. The formation of these space charges corresponds to the redistribution of the electric field over the entire thickness of the insulation. In another respect, the oscillations found near the outer electrode are probably related to the fact that the insulation is wrapped: an imperfect propagation of acoustic waves when crossing the different PTFE layers may induce spurious effects on the signal.
Fig. 7. Charge density profile during (a) the calibration step, and (b) when applying a voltage of 9 kV for different times
IV. CONCLUSION
Preliminary space charge measurements results obtained by PEA method on aeronautical cable were presented. These measurements revealed that the acoustic signals generated by the difference in permittivity between the PI and FEP multilayers, that issued from multiple reflections at the internal interfaces, and the signal generated by the influence charges on the conductor, are merging. As a result, the origins of the different signals near the cable conductor can no longer be distinguished and the information on the dispersion and attenuation cannot be recovered. This is why we concentrated on the outer layer of insulation.
For this purpose, we carried out measurements on PTFE plane samples to recover the attenuation and dispersion information. We then carried out measurements on aeronautical cables and then traced back to the electric field information. During our tests at 9 kV and -9 kV, we noted a decrease in time of the electric field at the outer part of the cable presumably due to the Maxwell-Wagner effect in the multilayer insulation of the cable. This results in a redistribution of the electric field.
REFERENCES
[1] B. Cella, T. Lebey, and C. Abadie «Partial discharges measurements at the constituent’s level of aerospace power electronics converters», Proc. IEEE Electrical Insulation Conference (EIC), pp. 274-277, 2015. [2] M. Yasuda, M. Ito, and T. Takada, «Measurement of charge
distributions in coaxial cable using the pulsed electroacoustic method»,
Jpn. J. Appl. Phys., vol. 30, pp. 71–73, 1991.
[3] N. Hozumi, T. Okamoto, and T. Imajo, «Space charge distribution measurement in a long size XLPE cable using the pulsed electroacoustic method», Proc. IEEE Int. Symp. Electr. Insul. (ISEIM), pp. 294–297, 1992. [4] G. Rizzo, P. Romano, A. Imburgia, and G. Ala, « Review of the PEA
Method for Space Charge Measurements on HVDC Cables and Mini-Cables », Energies, vol. 12, pp. 1-23, 2019.
[5] B. Vissouvanadin, T.T.N. Vu, L. Berquez, G. Teyssedre, S. Le Roy, and C. Laurent, «Deconvolution techniques for space charge recovery using pulsed electroacoustic method in coaxial geometry», IEEE Trans.
Dielectr. Electr. Insul., vol. 21, pp. 821-828, 2014.
[6] R. Bodega and J.J. Smit «Space charge measurements on multi-dielectrics by means of the Pulsed Electro Acoustic method», IEEE
Trans. Dielectr. Electr. Insul., vol.13, pp. 272-281, 2006.
[7] S. Holé, T. Ditchi, and J. Lewiner, « Influence of divergent electric fields on space-charge distribution measurements by elastic methods »,
Phys. Rev. B, vol. 61, pp. 13528-13539, 2000
[8] B. Roulet and M. Saint Jean, « Image charges revisited: Beyond classical electrostatics », Am. J. Physics, vol. 68, pp. 319-324, 2000. [9] T.T.N. Vu, G. Teyssedre, B. Vissouvanadin, S. Le Roy, and C. Laurent,
«Correlating conductivity and space charge measurements in multi-dielectrics under various electrical and thermal stresses», IEEE Trans.
Dielectr. Electr. Insul., vol. 22, pp. 117-127, 2015.
Fig. 6. (a) Mapping of electric field as a function of time and radius (b) Electric field as a function of time at the bottom electrode