HAL Id: hal-01229023
https://hal.inria.fr/hal-01229023v2
Submitted on 11 Apr 2016
HAL is a multi-disciplinary open access
archive for the deposit and dissemination of
sci-entific research documents, whether they are
pub-lished or not. The documents may come from
teaching and research institutions in France or
abroad, or from public or private research centers.
L’archive ouverte pluridisciplinaire HAL, est
destinée au dépôt et à la diffusion de documents
scientifiques de niveau recherche, publiés ou non,
émanant des établissements d’enseignement et de
recherche français ou étrangers, des laboratoires
publics ou privés.
Fast clustering for scalable statistical analysis on
structured images
Bertrand Thirion, Andrés Hoyos-Idrobo, Jonas Kahn, Gaël Varoquaux
To cite this version:
Bertrand Thirion, Andrés Hoyos-Idrobo, Jonas Kahn, Gaël Varoquaux. Fast clustering for scalable
statistical analysis on structured images. ICML Workshop on Statistics, Machine Learning and
Neu-roscience (Stamlins 2015), Bertrand Thirion, Lars Kai Hansen, Sanmi Koyejo, Jul 2015, Lille, France.
�hal-01229023v2�
Bertrand Thirion [email protected] Parietal team, INRIA, Saclay and CEA, Neurospin France
Andr´es Hoyos-Idrobo
Parietal team, INRIA, Saclay and CEA, Neurospin France Jonas Kahn
Laboratoire Paul Painlev´e (UMR 8524), Universit´e de Lille 1, CNRS Cit´e Scientifique–Bˆat. M2, 59655 Villeneuve dAscq Cedex France
Ga¨el Varoquaux
Parietal team, INRIA, Saclay and CEA, Neurospin France
Abstract
The use of brain images as markers for dis-eases or behavioral differences is challenged by the small effects size and the ensuing lack of power, an issue that has incited researchers to rely more systematically on large cohorts. Cou-pled with resolution increases, this leads to very large datasets. A striking example in the case of brain imaging is that of the Human Connec-tome Project: 20 Terabytes of data and grow-ing. The resulting data deluge poses severe chal-lenges regarding the tractability of some pro-cessing steps (discriminant analysis, multivari-ate models) due to the memory demands posed by these data. In this work, we revisit dimen-sion reduction approaches, such as random pro-jections, with the aim of replacing costly function evaluations by cheaper ones while decreasing the memory requirements. Specifically, we investi-gate the use of alternate schemes, based on fast clustering, that are well suited for signals exhibit-ing a strong spatial structure, such as anatomi-cal and functional brain images. Our contribu-tion is two-fold: i) we propose a linear-time clus-tering scheme that bypasses the percolation is-sues inherent in these algorithms and thus pro-vides compressions nearly as good as traditional quadratic-complexity variance-minimizing clus-tering schemes; ii) we show that cluster-based compression can have the virtuous effect of re-Proceedings of the 31st International Conference on Machine Learning, Lille, France, 2015. JMLR: W&CP volume 37. Copy-right 2015 by the author(s).
moving high-frequency noise, actually improv-ing subsequent estimations steps. As a conse-quence, the proposed approach yields very ac-curate models on several large-scale problems yet with impressive gains in computational ef-ficiency, making it possible to analyze large datasets.
1. Introduction
Big data in brain imaging. Medical images are increas-ingly used as markers to predict some diagnostic or be-havioral outcome. As the corresponding biomarkers can be tenuous, researchers have come to rely more systemati-cally on larger cohorts to increase the power and reliability of group studies (see e.g. (Button et al.,2013) in the case of neuroimaging). In addition, the typical resolution of im-ages is steadily increasing, so that datasets become larger both in the feature and the sample dimensions. A strik-ing example in the brain imagstrik-ing case is that of the Human Connectome Project (HCP): 20 Terabytes of data and grow-ing. The whole field is thus presently in the situation where very large datasets are assembled.
Computational bottlenecks. This data deluge poses se-vere challenges regarding the tractability of statistical pro-cessing steps (components extraction, discriminant anal-ysis, multivariate models) due to the memory demands posed by the data representations involved. For instance, given a problem with n samples and p dimensions the most classical linear algorithms (such as Principal compo-nents analysis) have complexity O(min(p2n, n2p), which
becomes exorbitant when both p and n large. In med-ical imaging, p would be the number of voxels (shared
Fast clustering for statistics
across images, assuming that a prior alignment has been performed) and n the number of samples: while p is e.g. of the order of 105− 106 for brain images at the 1 − 2mm
resolution, n is now becoming larger (106in the case of the
HCP dataset). The impact on computational cost is actually worse than a simple linear effect: as datasets no longer fit in cache, the power of standard computational architectures can no longer be leveraged, resulting in an extremely inef-ficient use of resources. As a result, practitioners are left with the alternative of simplifying their analysis framework or working on sub-samples of the data (see e.g. (Zalesky et al.,2014)).
Lossy compression via random projections and cluster-ing. Part of the solution to this issue is to reduce the di-mensionality of the data. Principal components analysis, or even its randomized counterpart (Halko et al.,2009), is no longer an option, because these procedures become in-efficient due to cache size effects. Non-linear data repre-sentations (multi-dimensional scaling, Isomap, Laplacian eigenmaps...) suffer from the same issue. However, more aggressive reductions can be obtained with random projec-tions, i.e. the construction of random representations of the dataset in a k−dimensional space, k p. An essential virtue of random projections is that they come with some guarantees on the reconstruction accuracy (see next sec-tion). An important drawback is that the projected data can no longer be embedded back in the native observa-tion space. Moreover, random projecobserva-tions are a generic approach that does not take into account any relevant infor-mation on the problem at hand: for instance, they ignore the spatially continuous structure of the signals in medical im-ages. By contrast, spatially- and contrast-aware compres-sion schemes are probably better suited for medical images. We propose here to investigate adapted clustering proce-dures that respect the anatomical outline of image struc-tures. In practice, however, standard data-based clustering (k-means, agglomerative) yield computationally expensive estimation procedures. Alternatively, fast clustering proce-dures suffer from percolation (where a huge cluster groups most of the voxels, while many small clusters are obtained). Our contribution Here we propose a novel approach for fast image compression, based on spatial clustering of the data. This approach is designed to solve percolation issues encountered in these settings, in order to guarantee a good enough clustering quality. Our contributions are:
• Designing a novel fast (linear-time) clustering algo-rithm on a 3D lattice (image grid) that avoids percola-tion.
• Showing that, used as a data-reduction strategy, it ef-fectively reduces the computational cost of kernel-based estimators without losing accuracy.
• Showing that, unlike random projections, this ap-proach actually has a denoising effect, that can be in-terpreted as anisotropic smoothing of the data.
2. Theory
Accuracy of random projections. An important charac-teristic of random projections is the existence of theorems that guarantee the accuracy of the projection, in particu-lar the Johnson-Lindenstrauss lemma (Johnson & Linden-strauss,1984) and its variants:
Given 0 < ε < 1, a set X of n points in Rp, and a number k > 8 log (n)ε2 , there is a linear map f : R
p
−→ Rksuch that
(1−ε)kx1−x2k2≤ kf (x1)−f (x2)k2≤ (1+ε)kx1−x2k2
(1) for all (x1, x2) ∈ X × X . The map f is simply taken
as the projection to a random k-dimensional subspace with rescaling. The interpretation is that, given a large enough number of random projections of a given dataset, one can obtain a faithful representation with explicit control on the error. This accurate representation (in the sense of the `2
norm) can then be used for further analyses, such as kernel methods that consider between-sample similarities (see e.g. (Rahimi & Recht,2007)). In addition, the number of neces-sary projections can be lowered if the data are actually sam-pled from a sub-manifold of Rp(Baraniuk & Wakin,2009). In practice, sparse random projections are used to reduce the memory requirements and increase their efficiency (Li et al.,2006).
There are two important limitations to this approach: i) the random mapping from Rpto Rkcannot be inverted in geral, due to its high dimensionality; this means that the en-suing inference steps cannot be made explicit in original data space; ii) this approach ignores the structure of the data, such as the spatial continuity (or dominance of low frequencies) in medical images.
Signal versus noise. By contrast, clustering techniques have been used quite frequently in medical imaging as a means to compress information, with empirical success yet in the absence of formal guarantees, as in super-voxel ap-proaches (Heinrich et al.,2013). The explanation is that medical images are typically composed of signal and noise, such that the high-frequency noise is reduced by within-cluster averaging, while the low-frequency signal of inter-est is preserved. If we denote an image, the associated signal and noise by x, s and n, and by (ui)i∈[k]a set of
projectors to k clusters:
x = s + n =⇒ hx, uii = hs, uii + hn, uii ∀i ∈ [k]
While hs, uii represents a local signal average, hn, uii is
reduced by averaging. (hx, ui
com-pressed representation of x. The problem boils down to defining a suitable partition of the image volume, or equiv-alently of the associated projectors (ui)i∈[k], where k is
large. Data-unaware clustering partitions are obviously sub-optimal, as they do not respect the underlying struc-tures and lead to signal loss. Data-driven clustering can be performed through various approaches, such as k-means or agglomerative clustering, but they tend to be expensive: k-means has a complexity O(npk); agglomerative clustering (based on average or complete linkage heuristics or Ward’s strategy (Ward,1963)) is also expensive (O(np2)). Single linkage clustering is fast but suffers from percolation is-sues. Percolation is a major issue, because decompositions with one giant cluster and singletons or quasi-singletons are obviously suboptimal to represent the input signals.
3. Fast clustering
Percolation on lattices. Voxel clustering should take into account the 3D lattice structure of medical images and be based on local image statistics (e.g. local contrasts instead of cluster-level statistical summaries) in order to obtain linear-time algorithms. A given dataset X is thus repre-sented by a graph G with 3D lattice topology, where edges between neighboring voxels indexed by i and j are associ-ated with a distance kxi− xjk that measures the similarity
between their features. A common observation is that ran-dom graphs on lattices display percolation as soon as the edge density reaches a critical density (≈.2488 on a regu-lar 3D lattice), meaning that a huge cluster will group most of the voxels, leaving only small islands apart (Stauffer & Aharony, 1971). While single linkage clustering suffers from percolation, a simple variant alleviates this problem:
1. Generate the minimum spanning tree M of G 2. Delete randomly (k−1) edges from M while avoiding
to create singletons (by a test on each incident node’s degree).
This strategy is called rand single linkage or, more sim-ply rand single, in this paper. Sophisticated strategies have been proposed in the framework of computer vision (e.g. (Felzenszwalb & Huttenlocher,2004)), but they have not been designed to avoid percolation and do not make it pos-sible to control the number k of clusters.
In order to obtain better clustering, we have designed the linear-time clustering algorithm described in Alg.1and il-lustrated on a 2D brain image in Fig. 1. This algorithm is a recursive nearest-neighbor agglomeration, that merges clusters that are nearest neighbor of each other at each step. Since the number of vertices is divided by at least 2 at each step, the number of iterations is at most O(log(p/k)), i.e. 5 or less in practice, as we use typically p/k ≈ 10 or 20.
Algorithm 1 Fast clustering by recursive nearest neighbor agglomeration
Require: Input image X with shape (p, n), associated topological graph T , nearest neighbor extraction func-tion nn, connected components extracfunc-tion funcfunc-tion cc, desired number k of clusters.
Ensure: Clustering of the voxels l : [p] → [k]
1: G = (δ(Tij)kxi − xjk), (i, j) ∈ [p] × [p] {Create
weighted graph}
2: l = cc(nn(G)) {connected components of nearest-neighbor graph}
3: q = #(l) {number of connected components} 4: U = (δ(j == l(i)), (i, j) ∈ [p] × [q] {assignment
matrix} 5: while q > k do
6: X ← (UTU)−1UTX {reduced data matrix} 7: T ← UTT U {reduced topological model}
8: G = (δ(Tij)kxi− xjk), (i, j) ∈ [q] × [q] {weighted
graph}
9: λ = cc(nn(G), k) {cc extracts at most k compo-nents}
10: U ← (δ(j == λ(i)), (i, j) ∈ [q] × [#λ] {assignment matrix}
11: q ← #λ {number of connected components} 12: l ← λ ◦ l {update the voxel labeling} 13: end while
Since all the operations involved are linear in the number of vertices, the procedure is actually linear in p. As pre-dicted by theory (Teng & Yao,2007) –namely the fact that a one-nearest neighbor graph on any set of point (whether on a regular lattice or not) does not exhibit percolation– the cluster sizes are very even. This procedure yields more even cluster sizes than agglomerative procedures, and per-forms about as well as k-means for this purpose (see e.g. Fig.2). We call it fast clustering henceforth.
4. Experiments
We compare the performance of various compression schemes: single, average and complete linkage, Ward, fast clustering and sparse random projections in a se-ries of tasks involving public neuroimaging datasets (ei-ther anatomical or functional). We do not fur(ei-ther study k-means, as the estimation is overly expensive in the large k regime of interest.
Accuracy of the compressed representation First, we study the accuracy of the isometry in Eq. 1, which we simply check empirically by evaluating the ratio η =
kf (x1)−f (x2)k2
kx1−x2k2 for pairs (x1, x2) of samples on simulated
and real data. Random projections come with precise guar-antees on the variance of η as a function of k, but no
Fast clustering for statistics
Figure 1. Principle of the fast clustering procedure illustrated in a real 2D brain image: the (non-percolating) nearest neighbor graph is computed from the origin data and so on recursively. At the last iteration, only the closest neighbors are associated to yield exactly the desired number k of components.
10
010
110
210
3Cluster size
10
010
110
210
310
410
510
6Histogram of cluster sizes for 20000 clusters
kmeans fast rand single ward average complete
Figure 2. Percolation behavior of various clustering methods ob-served through the cluster size histogram for a fixed number k = 20, 000 of clusters, obtained by averaging across 10 sub-jects of the HCP dataset. K-means and fast clustering best avoid percolation, as they display neither singletons nor very large clus-ters. Traditional agglomerative clustering methods, on the other hand, exhibit both giant and small components. Similar results are obtained for other values of k and datasets.
such result exists for cluster-based representations. The simulated data is simply a cube of shape 50 × 50 × 50, that contains a signal consisting of smooth random sig-nal (FWHM=8mm), with additiosig-nal white noise; n = 100 samples are drawn. The experimental data are a sample of 10 individuals taken from NYU test-retest resting-state functional Magnetic Resonance Imaging (fMRI) dataset (Shehzad et al.,2009), after preprocessing with a standard SPM8 pipeline, sampled at 3mm resolution in the MNI space (n = 197 images per subject, p = 43878 voxels). To avoid the bias inherent to learning the clusters and mea-suring the accuracy of the representation on the same data, we perform a cross-validation loop: the clusters a learned on a training dataset, while the accuracy is measured on an independent dataset. Importantly, it can be observed that clustering is actually systematically compressive. Hence, we base our conclusions on the variance of η across pairs of samples, i.e. the stability of the ratio between distances.
Noise reduction To assess the differential effect of the spatial compressions on the signal and the noise, we
con-sidered a set of activation maps. Specifically, we relied on the motor activation dataset taken from 67 subjects of the HCP dataset (Barch et al.,2013), from which we consid-ered the activation maps related to five different contrasts: (moving the) left hand versus average (activation), right hand vs. average, left foot vs. average, right foot vs. av-erageand tongue vs average. These activation maps have been obtained by general linear model application upon the preprocessed data resampled at 2mm resolution in MNI space. From these sets of maps, in each voxel we com-puted the ratio of the between-condition variance (aver-aged across subjects) to the between-subject variance (av-eraged across conditions). Then we did the same on the fast cluster-based representation. The quotient of these two values is equal to 1 whenever the signals are identi-cal. Values greater than 1 indicate a denoising effect, as the between-condition variance reflects the signal of interest while between-subject variance is expected to reflect noise plus between-subject variability. We simply consider the boxplot of the log of this ratio, as a function of the number k of components.
Fast logistic regression We performed a discriminative analysis on the OASIS dataset (Marcus et al.,2007): We used n = 403 anatomical images and processed them with the SPM8 software to obtain modulated grey matter den-sity maps sampled in the MNI space at 2mm resolution. We used these maps to predict the gender of the subject. To achieve this, the images were masked to an approximate average mask of the grey matter, leaving p = 140, 398 vox-els. The voxel density values were then analyzed with an `2-logistic classifier, the regularization parameter of which
was set by cross-validation. This was performed for the fol-lowing methods: non-reduced data, fast clustering, Ward and random projection reduction to either k = 4, 000 or k = 20, 000 components. The accuracy of the procedure was assessed in a 10-fold cross validation loop. We mea-sured the computation time taken to reach a stable solution by varying the convergence control parameter.
Note that the estimation problem is rotationally invariant – i.e. the objective function is unchanged by a rotation of the feature space– which makes it well suited for projection-based dimension reductions. Indeed, these can be inter-preted as a kernel.
Fast Independent Components Analysis We performed an Independent Components Analysis (ICA) on resting state fMRI from the HCP dataset, as this is a task per-formed routinely on this dataset. Specifically, ICA is used to separate functional connectivity signal from noise and obtain a spatial model of the functional connectome (Smith et al.,2013). In the present experiment we analyzed inde-pendently data from 93 subjects. These data consist of two
resting-state sessions of 1200 scans. We relied on the pre-processed data, resampled at 2mm resolution in the MNI space. Each image represents about 1GB of data, that is converted to a data matrix with (p ≈ 220, 000, n = 1, 200). We performed an ICA analysis of each dataset in three set-tings: i) on the raw data, ii) on the data compressed by fast clustering(k = 20, 000) and iii) on the data compressed by sparse random projections (k = 20, 000). We extracted q = 40 independent components as it is a standard number in the literature. Based on these analyses we investigated i) whether the components obtained from each dataset were similar or not before and after clustering; ii) How similar the components of session 1 and session 2 were after each type of processing. This was done by matching the compo-nents across sessions with the Hungarian algorithm, using the absolute value of the pairwise correlation as a between-components similarity; iii) the computation time of the ICA decomposition.
Implementation aspects The data that we used are the publicly available NYU test-retest, OASIS and HCP datasets, for which we used the data with the preprocess-ing steps provided in the release 500-subjects release. We relied on the Scikit-learn library (Pedregosa et al.,2011) (v0.15) for machine learning tasks (ICA, logistic regres-sion) and for Ward clustering. We relied on the Scipy li-brary for the agglomerative clustering methods and the use of sparse matrices.
5. Results
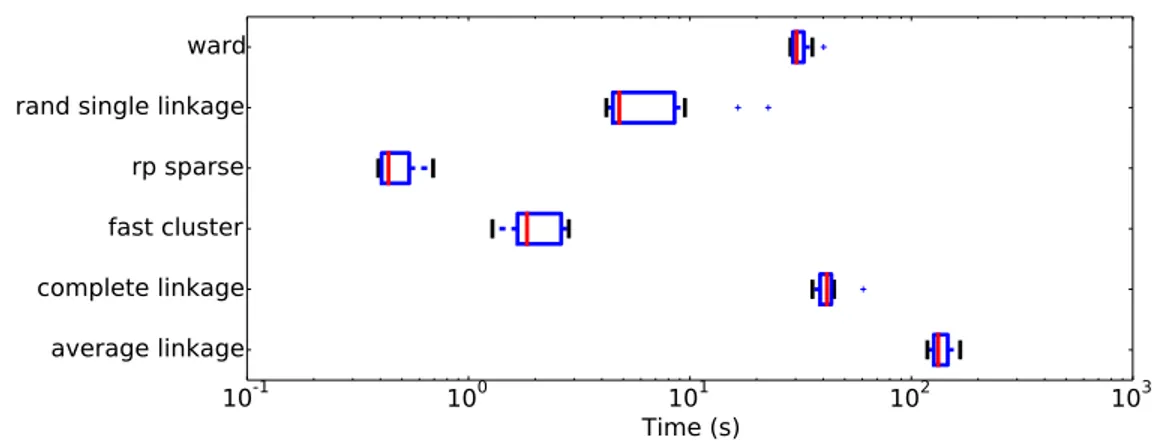
Computational cost. The computational cost of the dif-ferent compression schemes is displayed in Fig. 3. While sparse random projections are obviously faster, as they do not require any training, fast clustering outperforms by far Ward clustering, which is much faster than average or com-plete linkage procedures. The clustering of a relatively large image can be obtained in a second, this cost is actually much smaller than standard linear algebra computations on the same dataset (blas level 3 operations). Furthermore, this cost is reduced by learning the clustering on a subset of the images (e.g. from 2.3s to 0.6s if one uses 10 images of OASIS instead of 100).
Accuracy of the compressed representation The qual-ity of distance preservation is summarized in Fig. 4. The random projections accuracy improves with k, as predicted by theory. Among the clustering algorithms, Ward cluster-ing performs best in terms of distance preservation. Fast clusteringperforms slightly worse, though better than ran-dom projections. On the other hand, average and complete linkage perform poorly on this task –which is expected, due to their tendency toward percolation. In the next
experi-ments, we only consider Ward and fast clustering.
Noise reduction The differential effect of the spatial compression on the signal and the noise is displayed in Fig. 5. This shows that, in spite of large between-voxel variability, there is a clear trend toward a higher signal-to-noise ratio for lower values of k. This means that spatial compressions like clustering impose a low-pass filtering of the data that better preserves important discriminative fea-tures than variability components, part of which is simply noise.
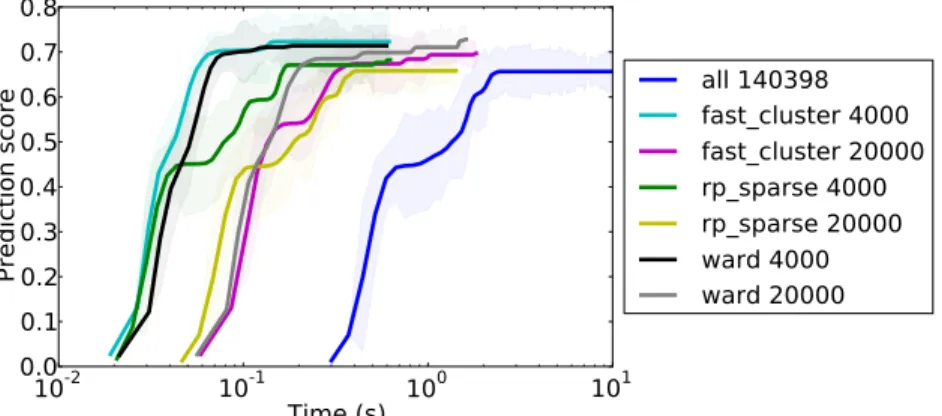
Fast logistic regression. The results of the application of logistic regression to the OASIS dataset are displayed in Fig. 6: this shows that the compressed datasets (with either fast clustering, Ward or random projections) can achieve at least the same level of accuracy as the uncom-pressed version, with drastic time savings. This result is a straightforward consequence of the approximate isometry property of the compressed representations. The accuracy achieved is actually higher for cluster-based compressions than with the original data or random projections: this il-lustrates again the denoising effect of spatial compression. As a side note, achieving full convergence did not improve the classifier performance. Qualitatively similar results are obtained with other rotationally invariant methods (e.g., `2
-SVMs, ridge regression). They should carry out to any ker-nel machine.
Fast Independent Components Analysis The results of the ICA experiment are summarized in Fig. 7: We found that the q = 40 first components were highly similar before and after fast clustering: the average absolute correlation between the components was about 0.75, while random projections do not recover the components (average cor-relation < 0.4). Across two sessions, the components ob-tained by clustering are actually more similar after cluster-ing than before, showcluster-ing again the denoiscluster-ing effect of clus-tering. This effect was observed in all 93 subjects, hence is extremely significant (p < 10−10, paired Wilcoxon rank test). On the opposite, random projections yielded a degra-dation of the similarity: this is because random projec-tions perturb the statistical structure of the data, in particu-lar the deviations from normality, which are used by ICA. As a consequence, ICA cannot recover the sources derived from the original data. By contrast, the statistical structure is mostly preserved after clustering. Finally, the compu-tation time is reduced by a factor of 20, while pk ≈ 12 thus improving drastically the tractability of the procedure. Faster convergence is obtained by fast-clustering than with random projections. In summary, fast clustering not only helped to make ICA faster, it also improved the stability of the results. Random projections cannot be used for such a purpose.
Fast clustering for statistics
10
-110
010
110
210
3Time (s)
average linkage
complete linkage
fast cluster
rp sparse
rand single linkage
ward
Figure 3. Evaluation of the computation time of the clustering algorithms (to obtain k = 10, 000 clusters) tested on n = 100 images taken from the OASIS dataset. The proposed fast clustering outperforms by far all alternatives, except random projections.
4
6
8 10 12 14 16 18 20 22
Compression ratio %
10
-810
-710
-6Variance of the absolute projection error
Simulated data
2
4
6
Compression ratio %
8
10
12
14
16
10
010
110
2Variance of the absolute projection error
VBM data
average linkage
complete linkage
fast cluster
rp sparse
rand single linkage
ward
Figure 4. Evaluation of the metric accuracy of the compressed representations obtained through various compression techniques, for different numbers of components. These experiments are based on simulated (left) and the OASIS dataset (right) respectively. The compression ratio is kpand error bars are across 10 datasets;
500
1k
2k
3k
4k
5k
7k
10k 15k 20k 30k 50k
number of clusters
0.3
0.2
0.1
0.0
0.1
0.2
0.3
0.4
0.5
log(between condition variance / between subject variance)
relative to voxel-based model
Figure 5. Denoising effect of cluster-based compression: the ratio of between-contrasts (of interest) to between subject variance (of no interest) is increased when a lower number of regions is used in the data compression scheme. This is based on five motor contrasts of the HCP fMRI dataset and the fast clustering procedure.
10
-210
-110
010
1Time (s)
0.0
0.1
0.2
0.3
0.4
0.5
0.6
0.7
0.8
Prediction score
all 140398
fast_cluster 4000
fast_cluster 20000
rp_sparse 4000
rp_sparse 20000
ward 4000
ward 20000
Figure 6. Quality of the fit of a logistic regression of the OASIS dataset as a function of computation time. The cluster-based methods obtain significantly higher scores than regression on the whole dataset with a much smaller computation time (by 1.5 orders of magni-tude). Note that the time displayed does not include cluster computation, which is costly in the case of Ward clustering (≈ 10 seconds, see Fig.3).
fast clustering
RP
0.3
0.4
0.5
0.6
0.7
0.8
0.9
consistency with raw
raw fast clustering RP
0.15
0.20
0.25
0.30
0.35
0.40
0.45
0.50
between-session similarity
raw fast clustering RP
10
110
210
310
4Computation time(s)
Figure 7. Results of the ICA experiments (left) the accuracy of the fast clustering with respect to the non-compressed components is high. (Middle) across two sessions, fast clustering yields components more consistent than raw data, while random projections fail to do so; (right) Regarding computation time, fast clustering yields a gain factor of ≈ 20, actually larger than p/k. The boxplots represent distributions across 93 subjects.
6. Discussion
Our experiments have shown that on moderate size datasets, a fast clustering technique can yield impressive gains in computation speed for a minimal overhead to build the spatially- and contrast-aware data compression schemes. More importantly, the gain is found to be more than linear in various applications. This comes with two other good news: even in the absence of theoretical re-sult, we found that spatial compression schemes perform as well as the state-of-the-art approach in data compression for machine learning, namely random projections. This holds thanks to the structure of medical images, where the noise is often observed in higher frequency components than the relevant information. Finally, we found that the spatial compression schemes presented here actually have a denoising effect, yielding possibly more accurate predic-tors than uncompressed version, or random projections. Conceptually, it is tempting to compare the spatial model obtained with fast clustering with traditional brain
parcel-lation or super-voxels. The difference lies in the interpreta-tion: we do not view spatial compression as a meaningful model per se, but as a way to reduce data dimensionality without losing too much information. We will typically set k = p/10 and this number is necessarily a trade-off be-tween computational efficiency and data fidelity. Note that in this regime, Ward clustering is slightly more powerful in terms of representation accuracy, but it is much slower hence cannot be considered as a practical solution. As shown by the ICA experiment, clustering-based com-pression can be used even in tasks in which the `2 norm
preservation alone does not guarantee a good representa-tion. The combination of clustering, randomization and sparsity has also proved to be an extremely effective tool in ill-posed multivariate estimation problems (Varoquaux et al.,2012;B¨uhlmann et al.,2012), hence fast clustering seems particularly well-suited for these problems.
In conclusion, we have shown that a procedure using our fast clustering method as a data reduction yields a speed
Fast clustering for statistics
up of 1.5 order of magnitude on two real-world multivari-ate statistic problems. Moreover, on a supervised problem, we improve the prediction performance by using our data compression scheme, as it captures better signal than noise. The proposed strategy is thus extremely promising regard-ing the statistical analysis of big medical image datasets, as it is perfectly compatible with efficient online estimation methods (Schmidt et al.,2013).
Acknowledgment. Data were provided in part by the Human Connectome Project, WU-Minn Consortium (Principal Investi-gators: David Van Essen and Kamil Ugurbil; 1U54MH091657) funded by the 16 NIH Institutes and Centers that support the NIH Blueprint for Neuroscience Research; and by the McDonnell Cen-ter for Systems Neuroscience at Washington University.
The research leading to these results has received funding from the European Union Seventh Framework Programme (FP7/2007-2013) under grant agreement no. 604102 (Human Brain Project)
References
Baraniuk, Richard G. and Wakin, Michael B. Random pro-jections of smooth manifolds. Found. Comput. Math., 9 (1):51–77, January 2009. ISSN 1615-3375.
Barch, Deanna M, Burgess, Gregory C, Harms, Michael P, Petersen, Steven E, Schlaggar, Bradley L, Corbetta, Maurizio, Glasser, Matthew F, Curtiss, Sandra, Dixit, Sachin, Feldt, Cindy, Nolan, Dan, Bryant, Edward, Hart-ley, Tucker, Footer, Owen, Bjork, James M, Poldrack, Russ, Smith, Steve, Johansen-Berg, Heidi, Snyder, Abra-ham Z, Essen, David C Van, and Consortium, W. U-Minn HCP. Function in the human connectome: task-fmri and individual differences in behavior. Neuroimage, 80:169–189, Oct 2013.
B¨uhlmann, P., R¨utimann, P., van de Geer, S., and Zhang, C.-H. Correlated variables in regression: clustering and sparse estimation. ArXiv e-prints, September 2012. Button, Katherine S, Ioannidis, John P A, Mokrysz, Claire,
Nosek, Brian A, Flint, Jonathan, Robinson, Emma S J, and Munaf, Marcus R. Power failure: why small sample size undermines the reliability of neuroscience. Nat Rev Neurosci, 14(5):365–376, May 2013.
Felzenszwalb, Pedro F. and Huttenlocher, Daniel P. Effi-cient graph-based image segmentation. Int. J. Comput. Vision, 59(2):167–181, September 2004. ISSN 0920-5691.
Halko, N., Martinsson, P.-G., and Tropp, J. A. Finding structure with randomness: Probabilistic algorithms for constructing approximate matrix decompositions. ArXiv e-prints, September 2009.
Heinrich, Mattias P., Jenkinson, Mark, Papiez, Bart-lomiej W., Glesson, Fergus V., Brady, Michael, and Schnabel, Julia A. Edge- and detail-preserving sparse image representations for deformable registration of chest mri and ct volumes. In IPMI, pp. 463–474, 2013. Johnson, William and Lindenstrauss, Joram. Extensions of
Lipschitz mappings into a Hilbert space. In Conference in modern analysis and probability, volume 26 of Con-temporary Mathematics, pp. 189–206. American Math-ematical Society, 1984.
Li, Ping, Hastie, Trevor J., and Church, Kenneth W. Very sparse random projections. In International Conference on Knowledge Discovery and Data Mining, KDD, pp. 287, 2006. ISBN 1-59593-339-5.
Marcus, Daniel S, Wang, Tracy H, Parker, Jamie, Csernan-sky, John G, Morris, John C, and Buckner, Randy L. Open access series of imaging studies (oasis): cross-sectional mri data in young, middle aged, nondemented, and demented older adults. J Cogn Neurosci, 19(9): 1498–1507, Sep 2007.
Pedregosa, F., Varoquaux, G., Gramfort, A., Michel, V., Thirion, B., Grisel, O., Blondel, M., Prettenhofer, P., Weiss, R., Dubourg, V., Vanderplas, J., Passos, A., Cour-napeau, D., Brucher, M., Perrot, M., and Duchesnay, E. Scikit-learn: Machine learning in Python. Journal of Machine Learning Research, 12:2825, 2011.
Rahimi, Ali and Recht, Ben. Random features for large-scale kernel machines. In In Neural Infomration Pro-cessing Systems, 2007.
Schmidt, M., Le Roux, N., and Bach, F. Minimizing Finite Sums with the Stochastic Average Gradient. ArXiv e-prints, September 2013.
Shehzad, Z., Kelly, AM, Reiss, P.T., Gee, D.G., Gotimer, K., Uddin, L.Q., Lee, S.H., Margulies, D.S., Roy, A.K., Biswal, B.B., et al. The resting brain: unconstrained yet reliable. Cerebral Cortex, 2009.
Smith, Stephen M, Beckmann, Christian F, Andersson, Jes-per, Auerbach, Edward J, Bijsterbosch, Janine, Douaud, Gwenalle, Duff, Eugene, Feinberg, David A, Griffanti, Ludovica, Harms, Michael P, Kelly, Michael, Laumann, Timothy, Miller, Karla L, Moeller, Steen, Petersen, Steve, Power, Jonathan, Salimi-Khorshidi, Gholamreza, Snyder, Abraham Z, Vu, An T, Woolrich, Mark W, Xu, Junqian, Yacoub, Essa, Uurbil, Kamil, Essen, David C Van, Glasser, Matthew F, and Consortium, W. U-Minn HCP. Resting-state fmri in the human connectome project. Neuroimage, 80:144–168, Oct 2013.
Stauffer, D. and Aharony, A. Introduction to Percolation Theory. Oxford University Press, New York, 1971.
Teng, Shang-Hua and Yao, FrancesF. k-nearest-neighbor clustering and percolation theory. Algorithmica, 49 (3):192–211, 2007. ISSN 0178-4617. doi: 10.1007/ s00453-007-9040-7. URL http://dx.doi.org/ 10.1007/s00453-007-9040-7.
Varoquaux, Ga¨el, Gramfort, Alexandre, and Thirion, Bertrand. Small-sample brain mapping: sparse recov-ery on spatially correlated designs with randomization and clustering. In ICML, pp. 1375, 2012.
Ward, Joe H. Hierarchical grouping to optimize an objec-tive function. Journal of the American Statistical Asso-ciation, 58:236, 1963.
Zalesky, Andrew, Fornito, Alex, Cocchi, Luca, Gollo, Leonardo L, and Breakspear, Michael. Time-resolved resting-state brain networks. Proc Natl Acad Sci U S A, 111:10341–10346, 2014.