HAL Id: cea-02339252
https://hal-cea.archives-ouvertes.fr/cea-02339252
Submitted on 14 Dec 2019HAL is a multi-disciplinary open access archive for the deposit and dissemination of sci-entific research documents, whether they are pub-lished or not. The documents may come from teaching and research institutions in France or abroad, or from public or private research centers.
L’archive ouverte pluridisciplinaire HAL, est destinée au dépôt et à la diffusion de documents scientifiques de niveau recherche, publiés ou non, émanant des établissements d’enseignement et de recherche français ou étrangers, des laboratoires publics ou privés.
Comparing 1D-3C et 1D-1C nonlinear dynamic
responses of deep and shallow japanese sites, considering
various assumptions
E. Foerster
To cite this version:
E. Foerster. Comparing 1D-3C et 1D-1C nonlinear dynamic responses of deep and shallow japanese sites, considering various assumptions. 16th European Conference on Earthquake Engineering (16ECEE), Jun 2018, Thessalonique, Greece. �cea-02339252�
COMPARING 1D-3C & 1D-1C NONLINEAR DYNAMIC RESPONSES
OF DEEP AND SHALLOW JAPANESE SITES, CONSIDERING
VARIOUS ASSUMPTIONS
Evelyne FOERSTER1ABSTRACT
In this paper, we present the results obtained with the CyberQuake computation code for two Japanese sites selected from the KiK-net and PARI accelerometric networks, which were proposed within the PRENOLIN international benchmark. The deep Kushiro (KiK-net KSRH10) and the shallow Sendai (PARI) sites were chosen as they are very close to a 1D geometry (horizontal layers). During the PRENOLIN benchmark, various 1D-1C computing assumptions with vertical incident waves were considered. Here, we present further works comparing results of 1D-1C / 1D-3C nonlinear transient dynamic computations, considering effective-stress / total-stress approaches, as well as vertical / oblique incident input motions, in order to review the usual main assumptions in 1D nonlinear site effects analyses, depending on site conditions. For the selected shallow site, the 1D-1C analysis with vertical incidence seems to be a better option. No clear trend is found in this case with respect to preferring the effective-stress or the total-stress model. The effective-stress analysis provides however better results in terms of predicted time-history ground motions at the site. For the deep site, the new computations performed in this study confirm that 1D-3C effective-stress analysis do improve the predictions. However, the discrepancy between the predictions and the recordings is still remaining since PRENOLIN, and cannot be explained by the new assumptions tested in this study. For both sites, no significant effect is observed, when considering oblique incidence for propagating waves. Computations with vertical incidence lead sometimes to better results.
Keywords: Site effects, nonlinear transient dynamic analysis, elastoplasticity, Kik-net & PARI sites, PRENOLIN
1. INTRODUCTION
In the framework of the PRENOLIN international benchmark, which was part of two larger projects (SINAPS@, funded by the French National Research Agency and SIGMA, funded by a consortium of nuclear operators, namely EDF, CEA, AREVA, ENL), and aiming at testing multiple numerical simulation codes capable of predicting non-linear seismic site response with various constitutive models, the validation phase has consisted in comparing the predictions of numerical estimations with actual strong motion recordings obtained at well-known Japanese sites, selected within the Japanese KiK-net and PARI (Port and Airport Research Institute) accelerometric networks, and being as close as possible to a 1D geometry (horizontal layers), with complete field and laboratory measurements (Régnier et al., 2016). For each validation site, different input (field and lab) data were provided by the organizers: weak and strong input motions; geophysical site characterization; degradation curves (shear modulus and damping ratio evolution with respect to the cyclic shear strain distortion), either selected in Darendeli’s curves or derived from available cyclic tri-axial laboratory tests or considering an hyperbolic constitutive model. Within the benchmark, only computation results on “imposed soil models”, so called as soil profiles and properties were imposed by PRENOLIN organizers, were required from the participants. However, participants could chose to provide additional computation results on “preferred soil models”, so called as they could freely design the soil profiles with all available geophysical and geotechnical data provided by the organizers.
In a previous paper (Foerster 2017), we have compared the results obtained with the CyberQuake
2
computation code (Foerster & Modaressi, 2007), for the KiK-net - KSHR10 (deep) and PARI-Sendai (shallow) sites (Figure 1), using actual input motions (including those from Tohoku earthquake 2011) as provided by the PRENOLIN organizers, considering one-dimensional (1D) SH waves (only one component of motion - 1C) with vertical incidence and various computing assumptions: (1) the so-called "equivalent linear model", which consists in a linear iterative viscoelastic approach performed in the frequency domain; (2) the nonlinear transient dynamic approach, based on finite-element time-domain computations, considering an elastoplastic cyclic constitutive model and either effective-stress (“preferred soil model”, Sendai site only) or total-stress approach (called “imposed soil model”, both sites).
Figure 1. Locations of the Koshuro (KSRH10, Hokkaido region) and Sendai (Tohoku region) sites.
For the shallow site, the 1D-1C nonlinear effective-stress approach gave better results for all the selected input motions (waveform, amplitude and frequency content), whereas with the total-stress approaches (equivalent linear and nonlinear), the soil response was overestimated and strains were underestimated for strong motions. For the deep site, the soil response was globally overestimated and frequency content was not well captured, even for weak input motions. In this paper, we present further works performed after the PRENOLIN benchmark, comparing 1D-1C and 1D-3C (2 or 3 components of motion) nonlinear transient dynamic computations for both sites, for vertical and oblique incidence waves.
2. INPUT MOTIONS SELECTION
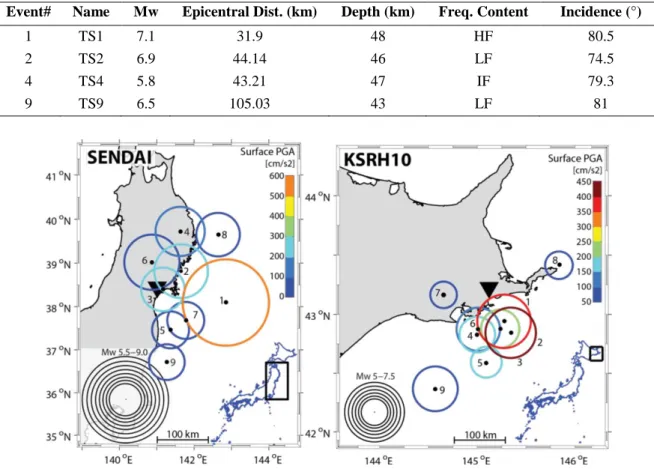
For each site, we have chosen four of the nine earthquake events provided by the PRENOLIN organizing team (Figure 2), which main features are detailed in Tables 1 and 2. For the Sendai shallow site, TS1 event corresponds to the 2011 Tohoku earthquake. In addition, for each event, three components of motion (East-West = EW, North-South = NS and vertical = UP) were provided to the benchmark participants, although the validation phase considered 1D-1C site response analyses. In this study, we have performed 1D-3C simulations and allowing to the polarization analysis made by the PRENOLIN organizing team, we have also modified the input components according to the average incidence angle per event and per site (90° meaning vertical incidence).
Table 1. Main features of the events selected for the Sendai shallow site (PARI)
Event# Name Mw Epicentral Dist. (km) Depth (km) Freq. Content Incidence (°)
1 TS1 9 162.7 23.7 LF2 79
2 TS2 7.1 81.3 72 IF 67.5
3
3 TS3 6.4 19.1 11.9 HF 64.8 7 TS7 5.9 94.7 41.2 HF 81.7 Table 2. Main features of the events selected for the Kushiro deep site (KiK-net KSRH10)
Event# Name Mw Epicentral Dist. (km) Depth (km) Freq. Content Incidence (°)
1 TS1 7.1 31.9 48 HF 80.5 2 TS2 6.9 44.14 46 LF 74.5 4 TS4 5.8 43.21 47 IF 79.3 9 TS9 6.5 105.03 43 LF 81
Figure 2. Maps of Sendai and Kushiro (KSHR10) earthquake events, selected by the PRENOLIN benchmark.
3. SOIL PROFILES DEFINITION
3.1 Shallow site: PARI-Sendai
The Sendai soil profile is composed of 3 main layers: a thin gravel fill (down to Ground Level GL-1m) and a sandy soil layer (down to GL-7m), both considered as nonlinear materials, and then a clayey rock layer (under GL-7m) with elastic behavior. A rigid bedrock condition is set at GL-10.4m, where downhole recorded motion was provided for computations. Various field and lab tests were available to characterize constitutive materials and related parameters were provided to participants: water content, particle size distributions, wave velocities VS and VP, bulk density , quality factor QS, degradation curves, i.e. the evolution of shear modulus ratio (G/Gmax) and damping with respect to the maximum cyclic distortions .
In this study, we have considered the SC1 “imposed soil model” of the PRENOLIN benchmark, with no water table (so called “total-stress” assumption) and degradation curves provided by the organizing team and obtained by best fitting Darendeli’s curves. These curves were used for calibration of the Hujeux elastoplastic cyclic constitutive model (Aubry et al., 1982; Lopez-Caballero et al., 2007) used in nonlinear simulations with CyberQuake (Figure 3). As further works after the benchmark, we have also considered a “preferred soil model” SCE based on initial SC1 features, but setting a water table at GL-1.5m and considering materials underneath as saturated (undrained condition) and capable of pore-water pressure generation (so called “effective-stress” assumption in this study). In addition, a constant Poisson ratio of 0.3 was adopted for all the soil layers. Main properties are recalled in Table 3.
4
Table 3. Elastic and nonlinear properties provided for Sendai site
Layer Elastic (L) properties Nonlinear (NL) properties
# GL (m) VS (m/s) VP (m/s) ρ (kg/m3) QS SC/SCE degradation curves max (kPa) C’ (kPa) ’ (°) 1 0-1 120 610 1850 25 SC1-1 5 0 44 2 1-2 170 870 1850 25 SC1-2 5-11 0 44 3 2-3 200 1040 1850 7.14 SC1-3 11-16 0 44 4 3-4 230 1180 1890 7.14 SC1-4 16-21 0 44 5 4-5 260 1300 1890 7.14 SC1-5 21-27 0 44 6 5-6 280 1420 1890 7.14 SC1-6 27-32 0 44 7 6-7 300 1530 1890 7.14 SC1-7 32-39 0 44 8 7-10.4 550 2800 2480 50 elastic - - - Rigid bedrock
Figure 3. Degradation curves for Sendai soil profiles: data (left), CyberQuake calibration (right).
3.2 Deep site: KiK-net-Kushiro
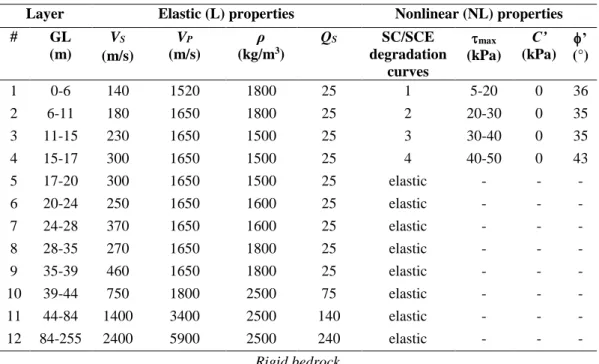
The soil profile on Kushiro site was composed of 5 main materials: a thin gravel fill (down to GL-1m) and a sandy soil (down to GL-7m), both considered as nonlinear materials, and then a stiffer clayey rock with almost elastic behavior. The rigid bedrock condition was set at GL-255m, where downhole motion was provided. In this study, we have considered the SC1 “imposed soil model” proposed by PRENOLIN (“total-stress” assumption), with degradation curves fitted on Darendeli’s curves (Figure 4), but considering materials below GL-17m as elastic (instead of GL-39m in the benchmark). We have also considered a “preferred soil model” SCE1 based on these new SC1 features, setting a water table at GL-2m (“effective-stress” assumption). Main properties are given in Table 4.
5
Table 4. Elastic and nonlinear properties provided for Kushiro site
Layer Elastic (L) properties Nonlinear (NL) properties
# GL (m) VS (m/s) VP (m/s) ρ (kg/m3) QS SC/SCE degradation curves max (kPa) C’ (kPa) ’ (°) 1 0-6 140 1520 1800 25 1 5-20 0 36 2 6-11 180 1650 1800 25 2 20-30 0 35 3 11-15 230 1650 1500 25 3 30-40 0 35 4 15-17 300 1650 1500 25 4 40-50 0 43 5 17-20 300 1650 1500 25 elastic - - - 6 20-24 250 1650 1600 25 elastic - - - 7 24-28 370 1650 1600 25 elastic - - - 8 28-35 270 1650 1800 25 elastic - - - 9 35-39 460 1650 1800 25 elastic - - - 10 39-44 750 1800 2500 75 elastic - - - 11 44-84 1400 3400 2500 140 elastic - - - 12 84-255 2400 5900 2500 240 elastic - - - Rigid bedrock 4. RESULTS
4.1 General methodology for quantitative comparisons
The agreement between computed and recorded signals (acceleration, etc.) is performed by using the Anderson’s methodology (Anderson 2004), characterizing the similarity by a goodness-of-fit (GOF) based on various ground-motion parameters. For each selected parameter, the agreement is quantified by a GOF score between 0 and 10 (perfect agreement): below 4, it is a “poor fit”; between 4 and 6, it is a “fair fit”; between 6 and 8, it is a “good fit”, and above 8, it is an “excellent fit”. Here, we provide the GOF scores for the peak ground acceleration (PGA), the cumulative absolute velocity (CAV, EPRI 1988), which measures damage potential of ground motion, the relative significant duration (RSD, Kempton & Stewart 2006), the cross-correlation (COR), and the spectral acceleration over 3 frequency bands: between 0.5 and 1 Hz (SAB1); between f0-0.5 and f0+0.5 Hz with f0, the resonant frequency of
the site (SAB2); between 0.05 and 25 Hz (SAB3), where 25 Hz was the maximum target frequency for nonlinear computations. f0 is close to 8 Hz for Sendai site and 2.5 Hz for Kushiro site.
In the next sections, we compare the predicted (“predict”) horizontal ground motions with the actual observations (“emp”) for the selected events in Tables 1 and 2, considering the various assumptions: “total-stress” (SC) vs. “effective-stress” (SCE); vertical (#1 e.g. SC1) vs. oblique (#2 e.g. SC2) wave propagation; 1D-1C (“1 component”) vs. 1D-3C, presenting here only results obtained with combined horizontal components (“2 components”), as the input vertical component had very little influence on the computed (horizontal) ground motions. Regarding the Kushiro site, the oblique vs. vertical incidence was compared only for the total-stress model.
6
4.2 Results for the Sendai site
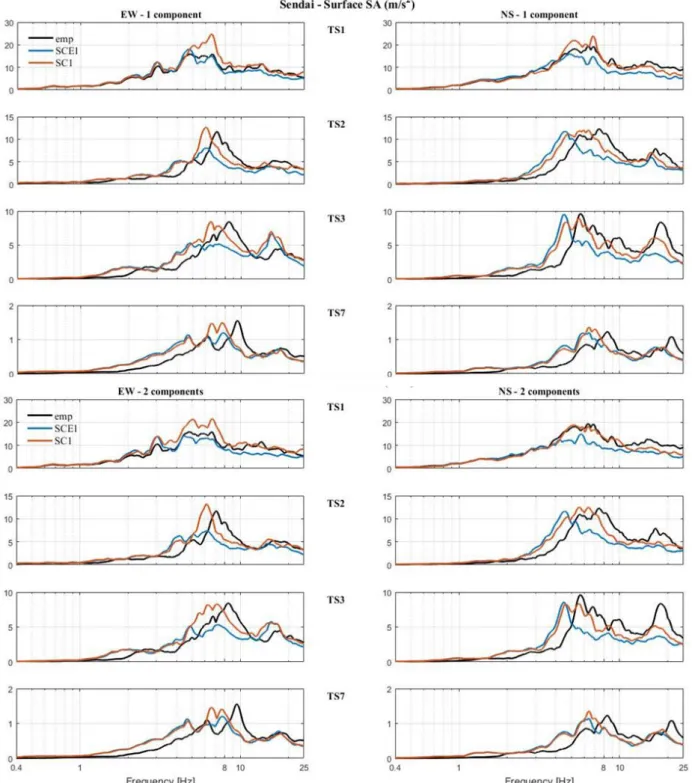
Figures 5 to 8 show the comparison between predicted / recorded quantities (surface time-history and spectral accelerations) with selected soil columns and events, considering the various assumptions.
Figure 5. GOF scores for all Sendai simulations: vertical & oblique wave incidence (resp. SC1/SCE1 and SC2/SCE2); 1D-1C (“1 component”, left) & 1D-3C (“2 components”, right).
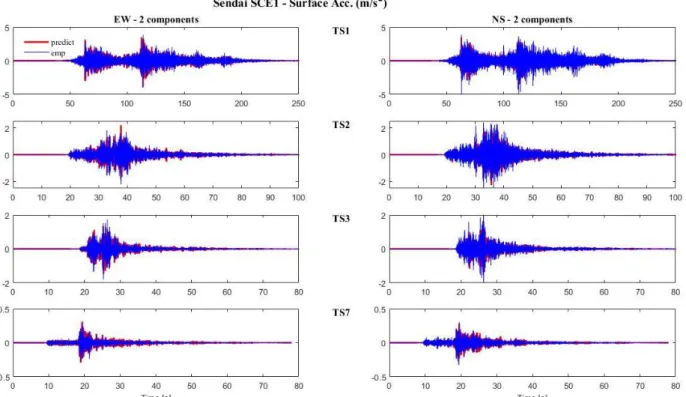
Figure 6. Surface accelerations computed at Sendai site for all events, considering vertical wave incidence, “effective-stress” (SCE1), and 1D-3C (“2 components”) assumptions.
7
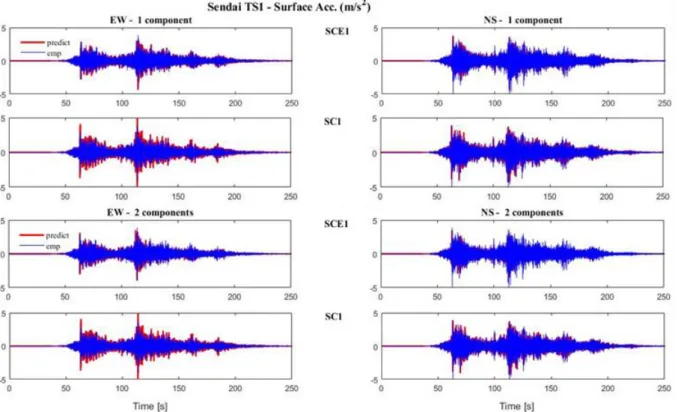
Figure 7. Comparison of surface accelerations for Sendai TS1 event, considering vertical wave incidence, “total-stress” (SC1) vs. “effective-“total-stress” (SCE1), and 1D-1C vs. 1D-3C (resp. 1 or 2 components) assumptions.
Discussion:
The results of the computations for all motions (TS1 to TS7) are globally closer to the time-history observations (e.g. PGA, CAV and RSD in Figure 5), when using the preferred soil model SCE1 (vertical incidence, effective-stress assumption) with 1D-3C analysis, especially for strong motions where nonlinear behavior is expected (see Figures 6 and 7).
For all motions except the strongest one (TS1), the amplitude of surface spectral accelerations close to the fundamental resonance frequency f0 seems better reproduced by the stiffer (total-stress) model SC1 with 1D-1C assumption (e.g. SA2 GOF scores in Figure 5 and results on Figure 8), indicating that during the computations, the effective-stress models (SCE1) mobilize too much nonlinearity, which is highlighted by an under-estimation of the amplitude and a shift of the computed f0 compared to observed one. This trend is amplified when considering the 1D-3C assumption (“2 components”) on the effective-stress model, due to the effective-stress coupling observed at plasticity.
Finally, no significant effect is visible, when comparing the GOF scores of SC2/SCE2 models (oblique incidence) in Figure 5, to those of SC1/SCE1 ones (vertical incidence), whatever the event and the number of components.
8
Figure 8. Comparison of surface spectral accelerations for Sendai selected events (black: records) and vertical wave incidence: “total-stress” (SC1) vs. “effective-stress” (SCE1) and 1C vs. 3C (resp. 1 or 2 components).
4.3 Results for the Kushiro site
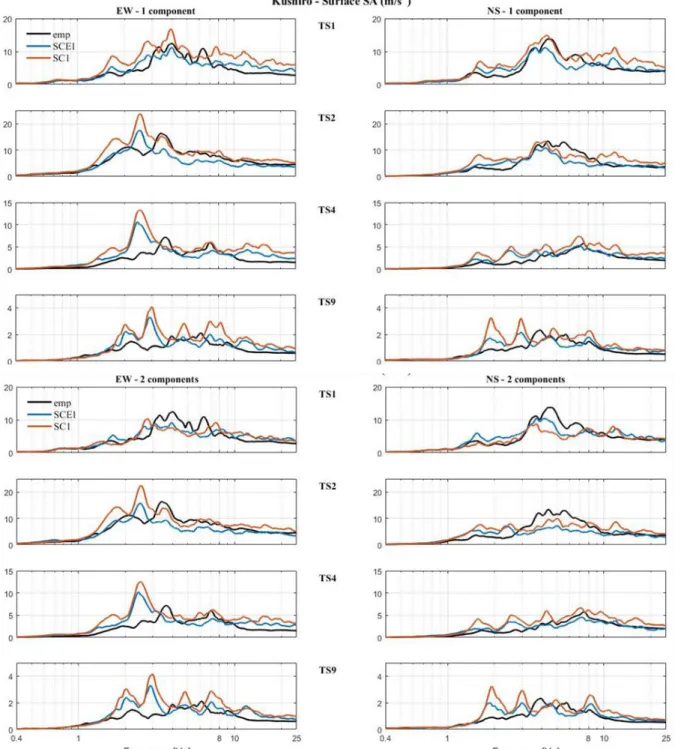
Figures 9 to 12 show the comparison between predicted / recorded quantities (surface time-history and spectral accelerations) with selected soil columns and events, for the various assumptions.
9
Figure 9. GOF scores for Kushiro simulations: “1 component” (left) and “2 components” (right)
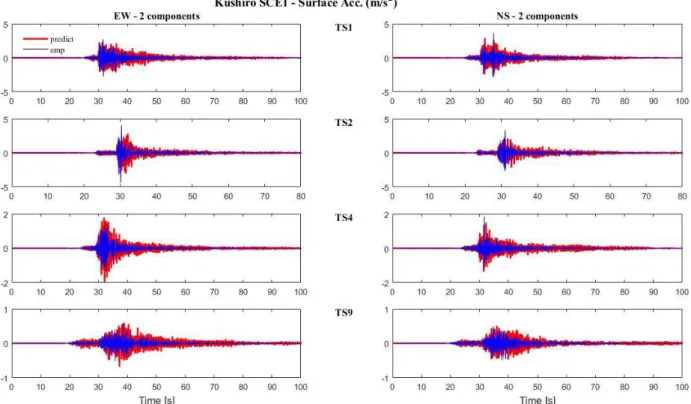
Figure 10. Surface accelerations computed at Kushiro site for all events, considering vertical wave incidence, “effective-stress” (SCE1), and 1D-3C (“2 components”) assumptions.
10
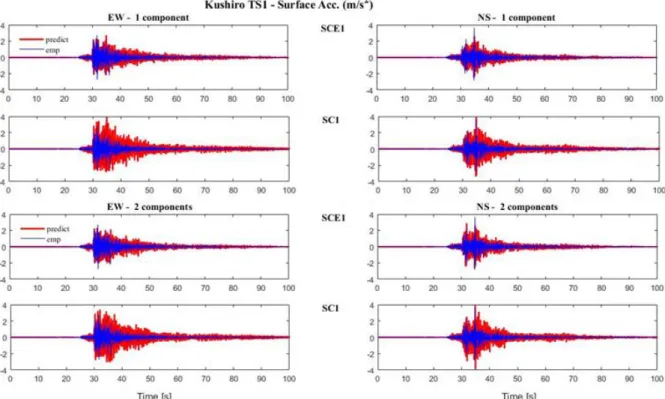
Figure 11. Comparison of surface accelerations for Kushiro TS1 event, considering vertical wave incidence, “total-stress” (SC1) vs. “effective-stress” (SCE1), and 1D-1C vs. 1D-3C (resp. 1 or 2 components) assumptions.
Discussion:
The results of the computations for all motions (TS1 to TS9) are globally closer to the observations (time-history and spectral ground motions), when using the preferred soil model SCE1 (vertical incidence, effective-stress assumption) with 1D-3C analysis, even for weaker motions where less nonlinear behavior is expected (see Figures 9, 11 and 12). The total-stress models (SC1 or SC2) is clearly over-estimating the computed ground motions, due to higher confining initial stress state leading to less nonlinearity. This trend is confirmed when considering the 1D-3C assumption (“2 components”) on the effective-stress model, which improves the predictions for the strongest motion (e.g. Figure 11). As for the shallow site, no significant effect is visible, when comparing the GOF scores of SC2 model (oblique incidence) in Figure 9, to those of SC1 one (vertical incidence), whatever the event and the number of components.
The discrepancy between the predictions and the observations is still remaining however, as attested by the low GOF scores for many parameters, especially for weaker motions (Figure 9). This discrepancy was even worse during the PRENOLIN benchmark, and it had raised questions about the 1D-1C assumption and the vertical incidence of input motions. The new computations performed in this study highlight that 1D-3C effective-stress analysis can improve the predictions but this is not sufficient to explain the observed response at this site.
11
Figure 12. Comparison of surface spectral accelerations for Kushiro selected events (black: records), considering vertical wave incidence and 1D-1C (“1 component”) or 1D-3C (“2 components”) simulations.
5. CONCLUSIONS
In this study, we have presented further works performed after the PRENOLIN benchmark, comparing results of 1D-1C / 1D-3C nonlinear transient dynamic computations, considering effective-stress / total-stress approaches, as well as vertical / oblique incident input motions. This study aimed at reviewing some usual main assumptions in 1D site effects analyses, in order to see their influence on the predicted nonlinear response for shallow and deep site conditions.
For the Sendai shallow site, the 1D-1C analysis with vertical incidence seems to be globally a better option, as 1D-3C computations generate too much nonlinearity, even for weaker motions. In addition, no clear evidence is found with respect to preferring the effective-stress or the total-stress model for this
12
site. The effective-stress analysis provides indeed better results in terms of predicted time-history ground motions at the site, whereas depending on the earthquake event, the total-stress analysis seems to perform better when looking at the spectral quantities.
For the Kushiro deep site, the 1D-3C effective-stress analysis, considering vertical incidence, seems to be globally a better option for all types of motions (weak or strong). The discrepancy between the predictions and the observations is still remaining for this site, although the new computations performed in this study confirm that 1D-3C effective-stress analysis do improve the predictions. This is however not sufficient to explain the observed response at this site.
For both sites, no significant effect is observed, when considering oblique incidence for propagating waves. Computations with vertical incidence lead sometimes to better results.
Finally, the uncertainty remains however regarding the use of the effective-stress approach for these sites, as no data was provided during the benchmark that could help better constraining the hydraulic properties of the selected sites (permeability, etc.).
6. REFERENCES
Anderson J. G. (2004). Quantitative measure of the goodness-of-fit of synthetic seismograms. Proc. of the 13th World Conf. on Earthquake Engineering (13WCEE), Vancouver, British Columbia, Canada. Paper 243.
Aubry D., Hujeux J.C., Lassoudière F. & Meimon Y. (1982). A double memory model with multiple mechanisms for cyclic soil behavior. Int. Symp. Num. Model. Geomech., Zurich, Suisse.
Electrical Power Research Institute (EPRI) (1988). A criterion for determining exceedance of the operating basis earthquake. Report No. EPRI NP-5930, Palo Alto, California.
Foerster E. & Modaressi H. (2007). Nonlinear numerical method for earthquake site response analysis II- case studies. Bulletin of Earthquake Engineering, 5 (3): 325-345.
Foerster E. (2017). Comparison of various numerical assumptions for 1-d nonlinear site response analysis on real sites. Proc of the 16th World Conf. on Earthquake Engineering (16WCEE), Santiago Chile, Paper 3414.
Kempton JJ & Stewart JP (2006). Prediction equations for significant duration of earthquake ground motions considering site and near-source effects. Earthquake Spectra, 22 (4): 985–1013.
Lopez-Caballero F., Modaressi A. & Modaressi H. (2007). Nonlinear numerical method for earthquake site response analysis I- elastoplastic cyclic model & parameter identification strategy. Bulletin of Earthquake
Engineering, 5(3), 303-323.
Régnier J. et al. (53 authors more) (2016). International Benchmark on Numerical Simulations for 1D, Nonlinear Site Response (PRENOLIN): Verification Phase Based on Canonical Cases. Bulletin of the Seismological Society