HAL Id: hal-02465698
https://hal-brgm.archives-ouvertes.fr/hal-02465698
Submitted on 4 Feb 2020HAL is a multi-disciplinary open access archive for the deposit and dissemination of sci-entific research documents, whether they are pub-lished or not. The documents may come from teaching and research institutions in France or abroad, or from public or private research centers.
L’archive ouverte pluridisciplinaire HAL, est destinée au dépôt et à la diffusion de documents scientifiques de niveau recherche, publiés ou non, émanant des établissements d’enseignement et de recherche français ou étrangers, des laboratoires publics ou privés.
Characterization of printed circuit boards waste
-influence of sample mass and particle size -example of
zinc and nickel content
Solène Touzé, S. Chapron, Agathe Hubau, Sylvain Guignot
To cite this version:
Solène Touzé, S. Chapron, Agathe Hubau, Sylvain Guignot. Characterization of printed circuit boards waste -influence of sample mass and particle size -example of zinc and nickel content. WasteEng, Jul 2021, Gueph, Canada. �hal-02465698�
CHARACTERIZATION OF PRINTED CIRCUIT BOARDS WASTE – INFLUENCE OF SAMPLE
MASS AND PARTICLE SIZE – EXAMPLE OF ZINC AND NICKEL CONTENT
S. TOUZE 1,S. CHAPRON1, A. HUBAU1, S. GUIGNOT1
1 BRGM, 3 av. Claude Guillemin, 45060 Orléans, France .
1. Keywords
Printed Circuit Board (PCB), characterization, sampling, particle size, confidence level
2. Highlights
For Zn, to obtain a confidence interval around a mean value < 10%, 3 replicates of 0.5g are necessary for samples < 200µm, and 4 replicates of 5g for samples < 750 µm
For Ni, to obtain a confidence interval around a mean value < 10%, 7 replicates of 0.5g are necessary for samples < 200µm, and 5 replicates of 5g for samples < 750 µm
3. Purpose
Knowledge of the composition of waste PCB metals is crucial but difficult to achieve with accuracy. The first key step is to obtain a representative sample. The conventional recommendations to enhance sample representativeness are to use larger masses and/or finer grain sizes [1]. The aim of the present study is to investigate the effects on confidence in the Zn and Ni content of 1) the sample mass used for the digestion procedure before analysis; 2) the sample's particle size; 3) the number of digestion repetitions.
4. Materials and methods
For this study, samples from a large batch of spent PCBs (485 kg) were ground to 30 mm, then to 10 mm, using an industrial cutting mill. The sample was then quartered with a rotary divider and further divided with a riffle splitter to obtain 4 kg sub-samples with a fraction < 10 mm. These fractions were used to produce 3 samples of 4 kg. These were shredded with a lab knife mill (Retsch SM2000), the first to obtain a sample < 2 mm, the second to obtain a sample < 750 µm, and the third also to 750 µm before being milled with a Universal grinder (FL1 Poittemille) to obtain a sample < 200 µm. The samples were characterized by aqua regia digestion (solid/ liquid ratio 1:10, contact time 2h and reflux – leaching fraction filtered at 0,45 µm) and chemical analysis using Flame atomic absorption spectrometry (Varian SpectrAA-300). Three samples with different particle sizes (< 2 mm, < 750 µm, < 200 µm) and 3 subsamples with a different masses for the digestion procedure (0.5g, 2g and 5g) were studied. Combining the 2 parameters produced 9 different conditions. Each condition was repeated at least 16 times.
5. Results and discussion
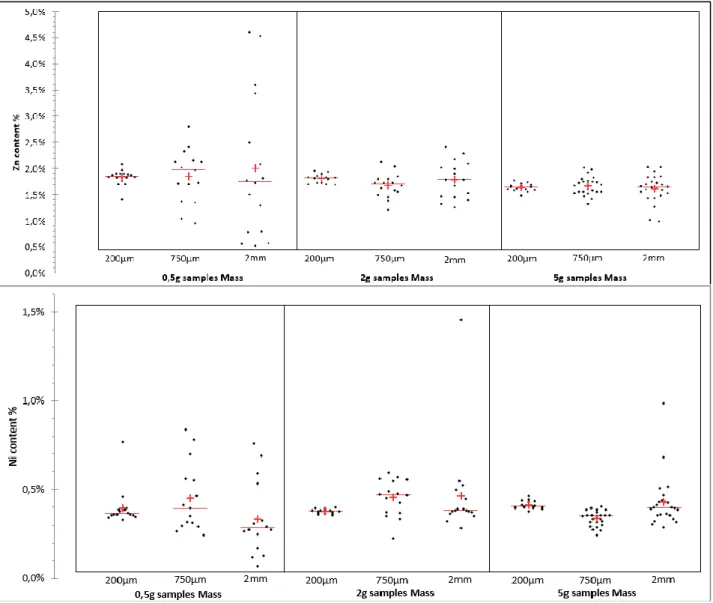
The results obtained for the nine conditions are shown by the scattergrams (figure 1). Each metal content is represented by a dot, the line represents the median value and the cross represents the mean value. Figure 1 shows that the mean values (at least 16 repetitions) for the metal content remained at the same order of magnitude, with no systematic and measurable bias. There was no observable interference due to the additional grinding steps (no contamination due to the abrasion of milled material, no segregation of metals, no preferential metal losses) and no kinetic leaching limitation of the coarsest particles. The scattergrams show the wide variability of Ni and Zn values depending on the sample mass and the particle size. The same trends appear for both metals: the data are more dispersed with coarser particles and smaller sample masses. These results concur with the results of Ernst [2] and Wienold [3] studies and sampling theory[1].
Figure 1 : Scattergrams of Zn and Ni content.
On the Ni scattergram, erratic points were observed (<200µm-0,5g, <2mm-2g and <2mm-5g) but this was not the case for Zn. Nickel is not well dispersed in the sample and the sampling and grinding procedure did not help to remove the residual heterogeneity. The erratic points show that a Ni “nugget effect” can exist even in the finest samples. A large number of repetitions is needed to mitigate this risk. This risk is evaluated by determining the percentage spread of the confidence interval around the mean value (statistical tests).
6. Conclusions and prospects
The key issues to determine the composition of a PCB with a high degree of accuracy are sampling quality and the efficiency of the analysis procedure. The particle size, sample mass and the number of repetitions can have a huge impact on confidence in the Ni and Zn content. This study provides data on the confidence interval around mean values according to these 3 parameters. Analyses are in progress for other metals, both base and precious.
7. References
[1] Gy P Part IV: 50 years of sampling theory—a personal history. Chemom Intell Lab Syst 74:49–60 (2004)
[2] Wienold, J., Recknagel, S., Scharf, H., Hoppe, M., Michaelis, M., Elemental analysis of printed circuit boards considering the ROHS regulations. Waste Manag. 31, 530–535 (2011).
[3] Ernst, T., Popp, R., Wolf, M., van Eldik, R., Analysis of eco-relevant elements and noble metals in printed wiring boards using AAS, ICP-AES and EDXRF. Anal.Bioanal. Chem. 375 (6), 805–814 (2003).