Aerobiologia 16: 381–391, 2000.
© 2000 Kluwer Academic Publishers. Printed in the Netherlands. 381
30 years of studies of grass pollen in Basel (Switzerland)
Ruth M. Leuschner
1∗, Heinz Christen
2, Paul Jordan
2& Reinhard Vonthein
31Kantonsspital Basel Dept. Research, Div Dermatol./Allergy Hebelstr.20, CH-4031 Basel, Switzerland; 2Universitätsrechenzentrum Basel, Switzerland; 3WWZ der Universität Basel, Ökonometrie und Statistik, Switzerland
(∗Author for correspondence, fax: +41 612652254) Received 11 January 1999; accepted in final form 8 August 2000
Key words: Basel (Switzerland), grass pollen, long-term study, meteorological records
Abstract
Measurements of the quantity of airborne grass pollen have been made in Basel, Switzerland, over a period of 30 years. This paper discusses the variations observed and correlates the data with meteorological records. The pattern is irregular, and there is no clear trend towards higher or lower levels during the period 1969–1998.
Materials and methods
Studies of the most abundant species of airborne pollen began in Basel in 1969, using a Burkard pollen-and spore-trap. The procedure is described in detail by Leuschner (Leuschner, 1974).
This work was carried out from the beginning in the Allergy Departement of the Dermatological Clinic of the Basel University Hospital, because airborne pollen is an important cause of allergies, above all the complex syndrome generally known as “hay fever”. In Central Europe, it is mainly the pollen of grasses (family Poaceae) which is responsable for hay fever. Other species of pollen were also investigated, espe-cially that of the birch (Betula), which in this area is considered to be the second most important cause of inhalation allergies (Spieksma et al., 1995).
Among the various allergens for which data are available, for the present longitudinal study we chose grass pollen because in Central Europe it is the most frequent cause of hay fever.
In Switzerland, the family Poaceae comprises here 53 genera and more than 160 species. Around 24 species are important in hay meadows. The various genera and species do not flower simultaneously, so that the period of grass pollen production can strech
from the very beginning of April to early September. In the present study, grass pollen levels from April 1st to August 31st are considered.
Results
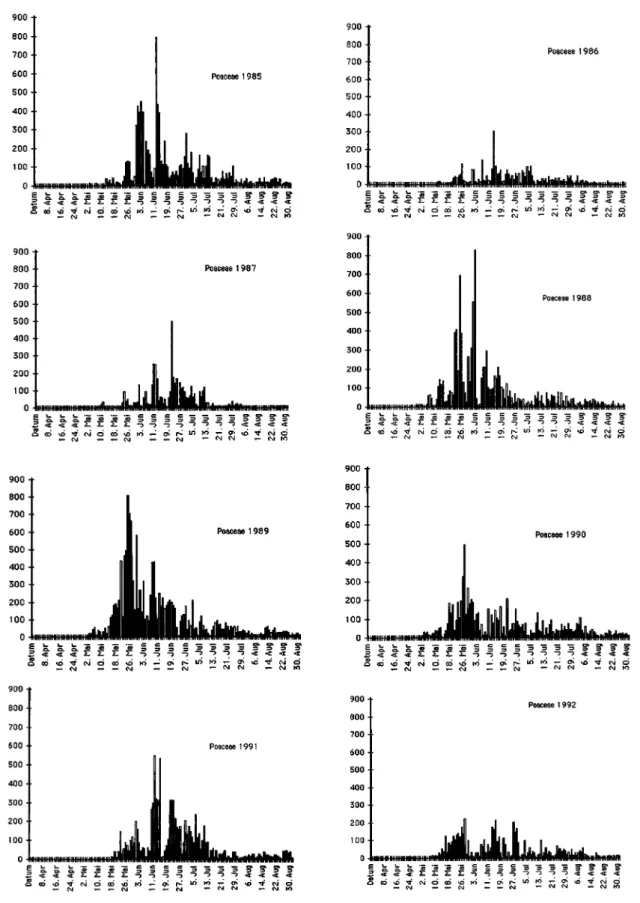
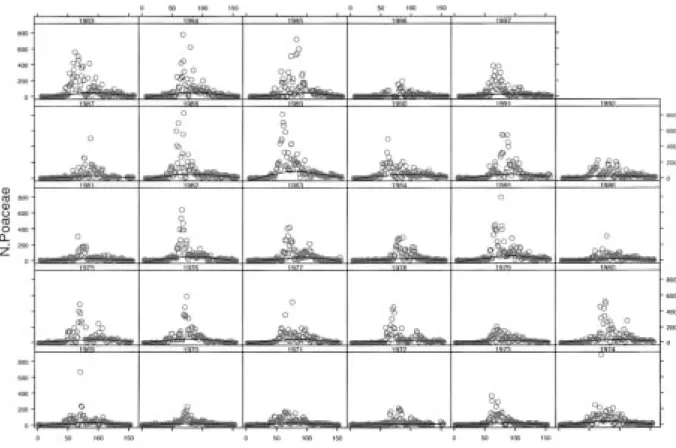
The weekly levels of airborne grass pollen are shown for each year in Figure 1. These show both the total pollen and the distribution over time. In Table 1 we see also that the largest amount of grass pollen was observed in 1989, with a total of 14,175 grains. The next largest total count were 11,030 in 1993 and 10,255 in 1988. there were very much smaller amounts in 1970 and 1972, with totals of 3,347 and 3,264 respectively. (The lowest count of 2,708, in 1996, was almost certainly an artefact, due to the fact that in that year the apparatus was out of action for some days in the main pollen season.)
The main season for airborne grass pollen is gener-ally the first half of June, but it can also be somewhat displaced, and there may be a second peak later. The strong fluctuations are above all related to the weather, for example those in 1969, 1974, 1977, 1980, and 1988. Thus, wind, temperature, an especally precipi-tation can influence the amount of airborne pollen.
382
383
384
385
Figure 1. Continued.
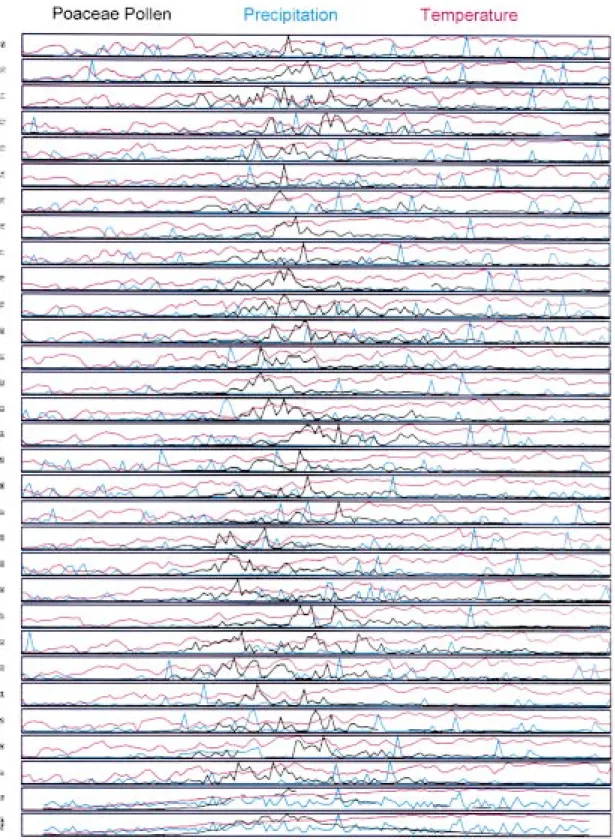
Temperature and precipitation curves for the 30 years of the study, and for pollen prevalence (Figure 2).
Precipitation was observed on 47% of all days in this period, with an average of 2.7 mm/dm2 per day (standard deviation (SD) = 6). The daily mean value varied with the seasons. It was 2.1 mm/dm2 in April, 3.0 in May, 3.1 in June, 2.8 in July and 2.5 in August.
Discussion
Using the mean temperatures on the same day of the year over the last 30 years a smooth curve was constructed (a so called Smooth Spline, using the computer software SPlus 3.1, 1993). This is shown in Figure 3, superimposed on the actual temperature
386
387
Figure 3. Mean temperatures over 30 years overlaid with a smooth curve.
388
Figure 5. 30 years of grass pollen in different colours.
389
Figure 7. 10 total daily grass pollen count for 29 years.
values. the curve begins at about 7◦at the beginning of April, climbs to 19◦in the last week of July, and sinks slowly to 17◦at the end of August. Temperat-ures in percentages deviate less than 5,382◦from the Spline.
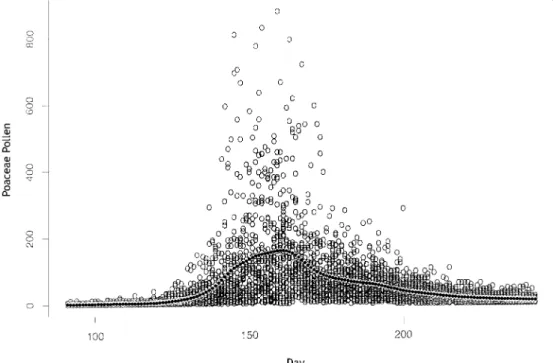
The same procedure was used to produce a graph giving a picture of changes in the grass pollen count over the 30-year period (Figure 4). Since the separate peaks occur at different times from year to year, this method cannot demonstrate a pattern with a series of peaks. This question will be dealt with in detail in another paper.
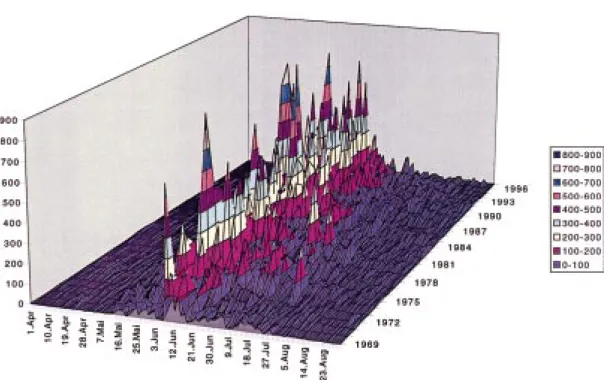
Figures 5 and 6 show how the total pollen counts varied from year to year. In Figure 5, each year is shown in a different colour. It is evident that the pollen levels in April are generally low and that the values drop considerably in August. In the 3-dimensional Figure 6, a different colour is used for different numbers of pollen grains per cubic metre of air per day, in steps of 100. Levels over 600 are not very frequent; values between 200 and 400 occur frequently, an levels below 200 are distributed throughout the period. Figure 7 shows the total daily
counts for 29 years. It demonstrates that the highest pollen values only occur over a short period.
Conclusions
In this long-term study, the results of most interest to those suffering from allergies are the time when most airborne pollen is to be expected, and the quantity present; (formerly described by Leuschner and Boehm, 1981). The appearance of airborne pollen in significant amounts requires a period of some weeks when the temperature is high enough to allow the grass to grow.
Figure 8a shows the first day on which a level of more than 20 grains per cubic metre was observed each year, and Figure 8b shows the last day on which the level was above this threshold each year. On average, over 30 years the cumulative temper-ature (cT) since April 1st had reached 389 dayde-grees (SD = 100) on the first day with a grass pollen count of at least 20. Figure 8c shows the time series (also described by Clot, 1998). The periods of pollen
390
Figure 8. (a) First day with 20 or more grains. (b) Last day with 20
or more grains. (c) Cumulative temperature to first day with 20 or more grains. (d) Day of pollen maximum.
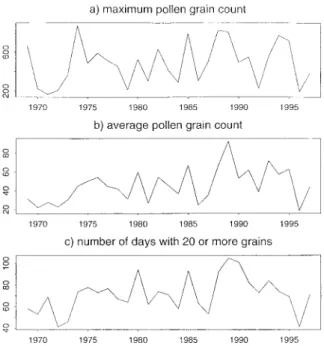
Figure 9. (a) Maximum pollen grain count. (b) Average pollen grain
count. (c) Numbers of days with 20 or more grains.
Table 1. Results of grass pollen count for each of the 30
years. 1969 4599 1970 3374 1971 4220 1972 3164 1973 4614 1974 6888 1975 7109 1976 8205 1977 6695 1978 6200 1979 3529 1980 9170 1981 4085 1982 8045 1983 6835 1984 5605 1985 10300 1986 3760 1987 4975 1988 10255 1989 14175 1990 8130 1991 9505 1992 5770 1993 11030 1994 8794 1995 9168 1996 2708 1997 6710 1998 7298
production last on an average 102 days (SD = 14). Twenty or more grass pollen grains could be counted on a mean of 71 days (SD = 16). The day of the maximum pollen count can also be used to assess the timing of the pollen season, and is shown in Figure 8d. As a measure for the pollen burden the maximum grass pollen level and the mean level in each year were calculated (Figures 9a and b), the number of days with a pollen count of 20 or more is shown in Figure 9c.
Taken together, the values found over the years do not give strong evidence of a long-term trend towards an earlier occurrence of large amounts of airborne grass pollen, or higher average levels. However, the question needs to be further studied, especially as the occasional gaps in the data could have distorted the values for a few years and disguised any possible trends.
391 Acknowledgements
This work was carried out in part by the help of the Swiss National Foundation for Scientific Research from 1972 to 1982. For 10 years we were supported by the Swiss Working Group for Aerobiology. We also thank the Swiss Meteorological Institute, Zürich, for permission to use the pollen data for this paper, and the Office for the Control of Air Hygiene Basel-Stadt and Baselland for supplying meteorological data.
References
Clot B.: 1998, Forecast of the Poaceae pollination in Zürich and Basle (Switzerland). Aerobiologia (in printing).
Leuschner R.: 1974, Luftpollenbestimmung in Basel während der Jahre 1969 und 1970 (mit Übersicht über die Methoden und Ergebnisse von Luftpollenuntersuchungen). Verh Naturf Ges
Basel 84(2), 521–625.
Leuschner R. and Boehm G.: 1981, Pollen and inorganic particles in the air of climatically very different places in Switzerland. Grana 20, 161–167.
Spieksma F.Th M., Emberlin J.C., Hjelmros M., Jäger S. and Leuschner R.: 1995, Atmospheric birch (Betula) pollen in Europe: Trends and fluctuations in annual quantities and the starting dates of the seasons. Grana 34, 51–57.