HAL Id: hal-01011325
https://hal.archives-ouvertes.fr/hal-01011325
Submitted on 23 Jun 2014HAL is a multi-disciplinary open access
archive for the deposit and dissemination of sci-entific research documents, whether they are pub-lished or not. The documents may come from teaching and research institutions in France or abroad, or from public or private research centers.
L’archive ouverte pluridisciplinaire HAL, est destinée au dépôt et à la diffusion de documents scientifiques de niveau recherche, publiés ou non, émanant des établissements d’enseignement et de recherche français ou étrangers, des laboratoires publics ou privés.
Interplay of disorder and antiferromagnetism in
TlFe1.6+(Se1–xSx )2 probed by neutron scattering
S. J. E. Carlsson, David Santos-Cottin, Christophe Lepoittevin, Pierre
Strobel, Vivian Nassif, Emmanuelle Suard, Pierre Toulemonde
To cite this version:
S. J. E. Carlsson, David Santos-Cottin, Christophe Lepoittevin, Pierre Strobel, Vivian Nassif, et al.. Interplay of disorder and antiferromagnetism in TlFe1.6+(Se1–xSx )2 probed by neutron scattering. Journal of Physics: Condensed Matter, IOP Publishing, 2014, 26 (27), pp.275701. �10.1088/0953-8984/26/27/275701�. �hal-01011325�
This content has been downloaded from IOPscience. Please scroll down to see the full text.
Download details:
IP Address: 147.173.146.61
This content was downloaded on 20/06/2014 at 12:46
Please note that terms and conditions apply.
Interplay of disorder and antiferromagnetism in TlFe1.6+(Se1−
x Sx )2 probed by neutron
scattering
View the table of contents for this issue, or go to the journal homepage for more 2014 J. Phys.: Condens. Matter 26 275701
(http://iopscience.iop.org/0953-8984/26/27/275701)
1 © 2014 IOP Publishing Ltd Printed in the UK 1. Introduction
The discovery of bulk superconductivity in A1−yFe2−zSe2 (A = K, Cs, Rb, Tl) with a TC of about 30 K generated a lot of interest because of the coexistence of magnetic order and superconduc-tivity [1–4]. The closely related TlFe2−zSe2 was first studied by Häggström et al [5] 25 years ago and crystallizes in a ThCr2Si2 -type structure (with a a a c× × tetragonal lattice, space group
I4/mmm) with possible ordering of the vacancies in the Fe layer. A 5a× 5a ordering in the iron planes occurs when z is equal to 0.4 i.e. for 20% iron vacancies and is formed through modulating of the Fe deficiency in the Fe-Se layer by the for-mation of Fe ions in 16i positions (Fe1) and empty Fe sites in 4d positions (Fe2). Other types of vacancy ordering have also been reported in sulphides in the past e.g. the a 2 2× a 2×c
orthorhombic cell found for 25% (z = 0.5) iron vacancies [6]. Journal of Physics: Condensed Matter
Interplay of disorder and
antiferromagnetism in TlFe
1.6+
δ
(Se
1−x
S
x
)
2
probed by neutron scattering
S J E Carlsson1,2, D Santos-Cottin1,2,3, Ch Lepoittevin1,2, P Strobel1,2,
V Nassif1,2, E Suard4and P Toulemonde1,2
1 Université de Grenoble Alpes, Inst NEEL, F-38042 Grenoble, France 2 CNRS, Inst NEEL, F-38042 Grenoble, France
3 IMPMC, UPMC 4, Place Jussieu, 75005 Paris, France 4 ILL, 71 Avenue des Martyrs, 38000 Grenoble, France
E-mail: sandra.karlsson@neel.cnrs.fr and pierre.toulemonde@neel.cnrs.fr
Received 24 February 2014, revised 14 April 2014 Accepted for publication 24 April 2014
Published 13 June 2014
Abstract
The effect of selenium substitution by sulphur on the structural and physical properties of antiferromagnetic TlFe1.6+δSe2 has been investigated via neutron, x-ray and electron diffraction, and transport measurements. The 5a× 5a c× super-cell related to the iron vacancy ordering found in the pure TlFe1.6Se2 selenide is also present in the S-doped TlFe1.6+δ(Se1−xSx)2 compounds. Neutron scattering experiments show the occurrence of the same long range magnetic ordering in the whole series i.e. the ‘block checkerboard’ antiferromagnetic structure. In particular, this is the first detailed study where the crystal structure and the 5a× 5a antiferromagnetic structure is characterized by neutron powder diffraction for the pure TlFe1.6+δS2 sulphide over a large temperature range. We demonstrate the strong correlation between occupancies of the crystallographic iron sites, the level of iron vacancy ordering and the occurrence of block antiferromagnetism in the sulphur series. Introducing S into the Se sites also increases the Fe content in TlFe1.6+δ(Se1−xSx)2 which in turn leads to the disappearance of the Fe vacancy ordering at x = 0.5 ± 0.15. However, by reducing the nominal Fe content, the same 5a× 5a c× vacancy ordering and antiferromagnetic order can be recovered also in the pure TlFe1.6+δS2 sulphide with a simultaneous reduction in the Néel temperature from 435 K in the selenide TlFe1.75Se2 to 330 K in the sulphide TlFe1.5S2. The magnetic moment remains high at low temperature throughout the full substitution range, which contributes to the absence of superconductivity in these compounds.
Keywords: iron-based superconductors, neutron powder diffraction, crystallography, magnetism, chalcogenides
(Some figures may appear in colour only in the online journal) S J E Carlsson et al Printed in the UK 275701 Cm © 2014 IOP Publishing Ltd 2014 26
J. Phys.: Condens. matter
Cm
0953-8984
10.1088/0953-8984/26/27/275701
Papers
27
Journal of Physics: Condensed matter JB
0953-8984/14/275701+10$33.00
doi:10.1088/0953-8984/26/27/275701
In TlFe1.6Se2 single crystals, vacancy ordering occurs below ~460 K and bulk c-axis antiferromagnetism is found below TN ~ 430 K [7]. Often, the vacancy order is incomplete with partial occupancies observed on at least one of the Fe sites. Whereas TlFe1.6Se2 is a Mott-insulator [8, 9], superconductivity with a
TC ~ 20 K was observed for z = 0.3 i.e. TlFe1.7Se2. However, the shielding volume fraction was very small (<1%) and the corresponding superconducting phase was not identified [4]. In alkaline selenides, the superconducting samples are defined by a nano-scale phase separation and the full characteristics of the superconducting phase are still uncertain. Different hypotheses have been reported in the literature: A strongly alkaline deficient intercalated phase (Rb0.3Fe2Se2 [10]), a 1/8 Fe vacancy state [11], a vacancy free phase (AFe2Se2 [12, 13]) or a disordered Fe vacancy phase [14]. As a consequence, pure Tl based selenides, which are more stable in air than alkaline intercalated selenides, without additional disorder on the A-site are interesting sys-tems to study to better understand the interplay between the Fe vacancy ordering, the magnetic order and superconductivity.
In iron-based superconductors, such as BaFe2(As1−xPx)2 and Fe1+δTe1−xSex, superconductivity can be induced or enhanced by simple isovalent substitution of the pnictogen or chalcogen [15–18]. Isovalent substitution can also suppress the super-conductivity, as in a recent investigation by Lei et al, of the potassium intercalated K1−yFe2−z(Se1−xSx)2 (TC = 33 K for x = 0) where increasing the sulphur content led to the disappearance of the superconductivity for x ~ 0.8 [19]. They suggest that this may be related to a decrease in the number of Fe vacancies or increased FeCh4 tetrahedron distortion. Following this, we syn-thesized the full solid solution series of Tl1−yFe2−z(Se1−xSx) and found that increased sulphur substitution leads to a reduction in the Néel temperature, directly related to the Fe-Se/S bond length decrease but no superconductivity was found down to 4.2 K [20]. In this work, the crystal and magnetic structure and electrical transport of polycrystalline TlFe1.6+δ(Se1−xSx)2 (δ < 0.1) samples as a function of temperature and sulphur substitu-tion are further investigated using neutron powder diffracsubstitu-tion (NPD). To our knowledge, this is the first time that sulphur-rich compositions, including the pure sulphide, have been studied by neutron scattering over a large temperature range.
2. Experimental methods
Polycrystalline samples of TlFe1.6+ δ(Se1−xSx)2 (δ = 0 refers to the perfect 5a× 5a c× ordered lattice) were prepared by a sealed tube technique similar to that reported elsewhere for Fe1−δ(Te1−xSex) [21, 22]. Starting materials were Fe powder (Alfa Aesar, 99.98%), Tl pieces (Alfa Aesar, 99.99%), Se chips (Alfa Aesar, 99.999%), FeS powder (Alfa, 99.9%) and S powder (Prolabo, 99.9%). Nominal mixtures of the reactants corresponding to TlFe1.75(Se1−xSx)2, total mass of elements ~2 g, were placed in alumina crucibles and sealed in evacuated silica tubes and heated at 100 °C h−1 up to 350 °C. After 24 h, the temperature was increased at 100 °C h−1 to 700 °C and kept there for 12 h. The samples where then cooled down to 350 °C, maintained at this temperature for 48 h, before being furnace cooled. The phase purity of the resulting powders was examined by x-ray powder diffraction using Cu Kα radiation.
Neutron powder diffraction was used to study the struc-tural and magnetic phase transitions in TlFe1.6+δ(Se1−xSx)2 with x = 0, 0.35, 0.65 and 1.0. Low temperature measurements were carried out between 1.5 and 300 K with the D1B dif-fractometer at Institut Laue Langevin (ILL, Grenoble) using a monochromatic beam with λ = 2.52 Å. This was followed by a second experiment performed on the high-resolution dif-fractometer D2B at the ILL in the temperature range 5–470 K. The instrument was used in the high-resolution mode with a wavelength of λ = 1.594 Å (from the Ge(335) reflection of the monochromator). All the diffraction data were analyzed by the Rietveld method [23] using the GSAS [24] program suite.
Low temperature powder x-ray diffraction data were col-lected between 5 and 300 K using a Bruker D8 diffractometer working in the reflection mode at the wavelength λ = 1.54 Å and an ARS cooling system. Rietveld refinements of the data
were performed with the FULLPROF package [25]. Data
points with 10°≤ ≤ °2θ 90 were taken into account and pseudo-Voigt profile shape was used. The background was fitted using a linear interpolation between selected points.
Electron diffraction (ED) and quantitative energy disper-sive spectroscopy (EDS) analysis were performed using a Philips CM 300ST transmission electron microscope (TEM) operating at 300 kV. Specimens were prepared by crushing a small piece of sample in an agate mortar under ethanol. A droplet of this mixture was then dropped on a copper grid covered by a holey carbon film.
The DC electrical resistivity of the samples was measured by a standard four-point contact technique in the temperature ranges 4.2–300 K and 280–570 K using two different experi-mental set-ups.
3. Results and discussion
3.1. Effect of S doping on the structural and physical properties of TlFe1.6+δ (Se1−xSx)2
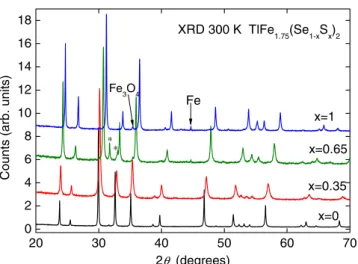
The x-ray powder diffraction patterns of the TlFe1.75(Se1−xSx)2 samples with x = 0, 0.35, 0.65 and 1 (nominal) collected at 300 K are presented in figure 1. Rietveld analysis of the data
Figure 1. Powder XRD patterns of TlFe1.75(Se1−xSx)2 (nominal
compositions) at 300 K with the position of the main impurity diffraction peaks marked as Fe3O4, Fe and * (unknown).
20 30 40 50 60 70 0 2 4 6 8 10 12 14 16 18 ∗ Fe3O4 x=1 x=0.65 x=0.35 C
ounts (arb. unit
s) 2θ (degrees) XRD 300 K TlFe1.75(Se1-xSx)2 x=0 Fe ∗
S J E Carlsson et al
3 showed that the TlFe1.6+δSe2 compound is pure whereas the S substituted samples contain small amounts (less than 6%) of Fe3O4 and Fe. The x = 0.65 pattern also have two additional diffraction peaks from some unknown impurity. All the dif-fraction peaks belonging to the main TlFe1.6+δ(Se1−xSx)2 phase could be indexed in the tetragonal ThCr2Si2 structure, space group I4/mmm, found in the AeFe2As2 (Ae = Ba, Sr, Ca) arsenides and also used originally for the superconducting K1−yFe2−zSe2 [1]. The super-lattice reflections associated with the I4/m symmetry ( 5a× 5a c× ), that includes a Fe ordered vacancy site, are difficult to detect in the XRD pat-terns because of their very low relative intensities.
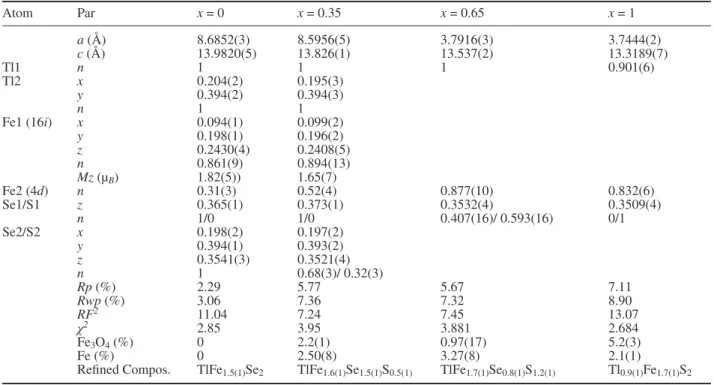
EDS analysis carried out in a TEM on several crystallites of the pure selenide (x = 0) compound showed that the average Fe content was 1.6(1), in agreement with the Rietveld calcula-tions (table 1). The electron diffraction patterns reveal a body-centred tetragonal subcell with the parameters a = b ≈ 3.9 Å, c ≈ 14 Å and extinction conditions compatible with the I4/mmm space group (figure 2(a)). However, additional reflections i.e. satellite reflections, are also visible in the [001]-oriented basal plane (figure 2(b)). These are characteristic of a modulated structure that can be described by a two-component modula-tion vector. Two vectors can be defined: one along the [210]* direction and another one along the [120]* direction of the subcell, with an amplitude of 1/5, leading to the values
⃗
⎯→=q∗ 1 / 10( 2− a∗+ ⎯→4 )b∗
1 and ⎯→=q2∗ 1 / 10(4a∗⃗+ ⎯→2 )b∗. Bearing in mind the commensurate nature of the modulation, the struc-ture can also be described in the tetragonal supercell aSC = bSC ≈ 8.7 Å (= 5a), c ≈ 14 Å (space group I4/m). This result is in agreement with our neutron diffraction data, which shows evidence of the 5a× 5a c× supercell, previously reported
for the insulating and antiferromagnetic (AFM) phases of the Cs1−yFe2−zSe2 and the K1−yFe2−zSe2 systems [26–28].
The ED analysis also verifies the ordering of the Fe vacan-cies, in particular for x = 0. The HRTEM image displayed in figure 2(c) was taken with the beam parallel to the [001] direc-tion (with the simulated image on the inset). In this orientadirec-tion the Fe vacancies are aligned in columns parallel to the electron beam and can be seen as bright spots (corresponding to weak electron density zones). The distance measured between the spots is ~9 Å, corresponding to the aSC = bSC (= 5a) lattice parameter and hence, to the distance between the Fe2 vacancy sites in the crystal structure. The [001]-projected structure is superimposed on the HRTEM image to highlight the tetrag-onal 5a× 5a unit cell.
The electrical resistance measured in the temperature range 5–600 K for the TlFe1.75(Se1−xSx)2 (nominal composi-tion) samples are presented in figure 3. All compounds show typical semiconducting behaviour at low temperature, inde-pendent of the sulphur content. No superconductivity was found down to 5 K as already observed in our previous study of Tl0.8Fe1.5(Se1−xSx)2 (nominal composition [20]). At high tem-perature, the anomaly associated with the AFM transition is clearly visible in the compositions x = 0 and x = 0.35 at
TN = 435 K and 390 K, respectively. The same kind of anomaly was observed in the alkaline-based A1−yFe2−zSe2 system [29,
30]. A gradual decrease of TN with increased S content was observed in our previous Tl1−yFe2−z(Se1−xSx)2 series with TN = 435(15) K for x = 0 and 330(5) K for x = 1 [20]. However, in this study there is no visible anomaly in the resistivity curve of the x = 0.65 and x = 1 compositions, confirming the absence of long-range magnetic ordering for these samples. This is in
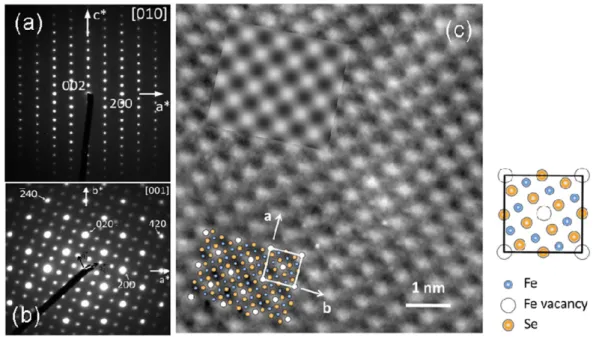
Table 1. Refined structural parameters for TlFe1.6+δ(Se1−xSx)2 (x = 0, 0.35, 0.65 and 1) from neutron diffraction data (D2B) collected at 300 K.
Atom Par x = 0 x = 0.35 x = 0.65 x = 1 a (Å) 8.6852(3) 8.5956(5) 3.7916(3) 3.7444(2) c (Å) 13.9820(5) 13.826(1) 13.537(2) 13.3189(7) Tl1 n 1 1 1 0.901(6) Tl2 x 0.204(2) 0.195(3) y 0.394(2) 0.394(3) n 1 1 Fe1 (16i) x 0.094(1) 0.099(2) y 0.198(1) 0.196(2) z 0.2430(4) 0.2408(5) n 0.861(9) 0.894(13) Mz (µB) 1.82(5)) 1.65(7) Fe2 (4d) n 0.31(3) 0.52(4) 0.877(10) 0.832(6) Se1/S1 z 0.365(1) 0.373(1) 0.3532(4) 0.3509(4) n 1/0 1/0 0.407(16)/ 0.593(16) 0/1 Se2/S2 x 0.198(2) 0.197(2) y 0.394(1) 0.393(2) z 0.3541(3) 0.3521(4) n 1 0.68(3)/ 0.32(3) Rp (%) 2.29 5.77 5.67 7.11 Rwp (%) 3.06 7.36 7.32 8.90 RF2 11.04 7.24 7.45 13.07 χ2 2.85 3.95 3.881 2.684 Fe3O4 (%) 0 2.2(1) 0.97(17) 5.2(3) Fe (%) 0 2.50(8) 3.27(8) 2.1(1)
Refined Compos. TlFe1.5(1)Se2 TlFe1.6(1)Se1.5(1)S0.5(1) TlFe1.7(1)Se0.8(1)S1.2(1) Tl0.9(1)Fe1.7(1)S2
Space group I4/m (x = 0 and 0.35) with atomic positions Tl1, 2a (0,0,0), Tl2 8h (x,y,0), Fe1 16i (x,y,z), Fe2 4d (0,1/2,1/4), Se1 4e (0,0,z) and Se2
16i (x,y,z). A magnetic model with I4/m’ with only the Mz component was used for the fitting. Space group I4/mmm (x = 0.65 and 1) with atomic
positions Tl1, 2a (0,0,0), Fe2 4d (0,1/2,1/4) and Se1 4e (0,0,z). J. Phys.: Condens. Matter 26 (2014) 275701
agreement with the neutron diffraction data at 300 K which con-firms that the (101)M magnetic peak, associated with the AFM phase in the 5a× 5a c× lattice, is present in TlFe1.75Se2 and TlFe1.75(Se0.65S0.35)2 but absent in TlFe1.75(Se0.35S0.65)2 and TlFe1.75S2 (figure 4(a)). Neutron diffraction data were also collected on cooling from 300 to 1.7 K (figures 4(b), (c)). They show that the (101)M magnetic peak remains down to 1.7 K in both the x = 0 and x = 0.35 samples. However, whereas the magnetic moment in the pure selenide (x = 0) reaches a clear maximum at ~180 K and then slowly diminishes as the tem-perature is reduced (figure 4(b)), the moment in the x = 0.35 compound appear to peak at ~100 K and then remains almost constant down to the lowest measured temperature (figure 4(c)). In TlFe1.75(Se0.65S0.35)2, the refined magnetic moment increases from 1.65(7) µB at 300 K to 2.21(9) µB at 1.5 K.
Figure 5 illustrates the refined structural parameters of TlFe1.6+δ(Se1−xSx)2 as a function of S substitution at room temperature (RT), based on XRD and NPD data. The unit cell parameters of TlFe1.6+δ(Se1−xSx)2 slowly decrease as a function of increased S substitution (figure 5(a)), indi-cating that the smaller sulphur atom is being incorporated into the structure. The gradual contraction of the lattice with S doping can also be seen in the neutron powder diffraction data as a shift of the (110) and (002) peak positions to a higher angle (figure 4(a)). The absence of any superstructure reflections (in particular those of the 5a× 5a c× lattice) in the x = 0.65 and 1.0 neu-tron diffraction patterns at RT indicate an order-disorder transition in the present TlFe1.75(Se1−xSx)2 series for high sulphur content. Hence, keeping the nominal Fe content at 1.75 for x > 0.35 compositions, produces samples with disordered iron vacancies, as described in the I4/mmm space group.
Figure 3. Temperature dependence of the electrical resistance,
R(T), for TlFe1.75(Se1−xSx)2 polycrystalline samples (nominal
compositions) with x = 0, 0.35 and 0.65 below (a) and above (b) room temperature. 1.0 1.5 2.0 2.5 3.0 3.5 4.0 4.5 5.0 0 50 100 150 200 250 300 300 350 400 450 500 550 0.1 0.2 0.3 0.4 0.5
(b)
x=0.65 x=0.35 x=0 x=0.35 x=0 x=0.65 R / R (300 K) Temperature (K) x=1TlFe1.75(Se1-xSx)2
(a)
TN~390 K R ( Ω ) Temperature (K) TN~435 K
Figure 2. Zone axis electron diffraction patterns of TlFe1.6+δSe2 recorded along (a) the [010] and (b) the [001] directions. On the later
satellites reflections define two possible modulation vectors q1 and ⃗ q2. (c) [001] HRTEM image of TlFe⃗ 1.6+δSe2 recorded for a defocus value of −57 nm with the corresponding simulated image (top left corner) and the structure projected along the c⃗parameter with the squared basal plane of the tetragonal supercell.
S J E Carlsson et al
5 Whereas the lattice parameters decrease continuously with S content at RT (figure 5(a)), the variations of the Fe-Se/S height and bond distances (figures 5(b), (c)) are irregular, con-firming that there are two different regimes, above and below the x = 0.5 ± 0.15 composition. This was also observed by Lei
et al in their K1−yFe2−z(Se1−xSx)2 series where the structural parameters and the real iron content show a discontinuity in their variations at x = 0.5 [19].
The refined structural parameters for TlFe1+δ(Se1−xSx)2 (x = 0, 0.35, 0.65 and 1) from NPD data (D2B) are listed in table 1. The total refined Fe content in the Fe-Se/S lat-tice increases gradually with the nominal S content: 1.5, 1.6, and 1.7 in x = 0, 0.35 and 0.65 and 1 respectively (inset figure 5(c)). This is also the case for KFe2−z(Se1−xSx)2 studied by Lei et al [19]. On the Fe2 site, which should be empty in a fully ordered 5a× 5a c× TlFe1.6Ch2 (Ch = Se, S) phase, the occupancy goes from 0.31 to 0.52 between the x = 0 and 0.35 samples, explaining why the perfect vacancy ordering, and hence the magnetic order, is lost as the S content increases above x = 0.35. On the other hand, the occupancy
on the almost fully occupied Fe1 site does not seem to be affected by the S doping.
Bearing in mind the fact that neutron powder diffraction meas-ures the average structure only, and that we observe signatmeas-ures of long range magnetic order in our different measurements, we believe that our samples contain a major fraction crystallized in the 5a× 5a c× lattice, which is well ordered with nearly no iron atoms on the Fe2 sites, and a second fraction where the Fe2 sites are probably filled above 50%. This effect is more impor-tant for the sulphur rich compositions i.e. x = 0.65 and x = 1.0, for which the well-ordered part of the sample is decreased to nearly zero (as we do no see any anomaly in R(T) curve at high T). In the following sections we focus our discussion on the pure selenide (x = 0) and sulphide (x = 1) compounds.
3.2. Temperature dependence of the structural and physical properties of TlFe1.6+δSe2
Powder neutron diffraction measurements were used to study both the crystal and magnetic structures of the pure TlFe1.6+δ Se2
Figure 4. Portion of the neutron powder diffraction patterns (D1B) of TlFe1.75(Se1−xSx)2 samples (nominal compositions) collected at 300 K
showing the changes in the (101) magnetic peak, the (002) structural peak, and the (110) super lattice peak with different S content, x. (a) and on cooling from 300 to 1.7 K showing the changes in intensity of the (101) magnetic peak with temperature for the x = 0 and
x = 0.35 samples (b and c). 19 20 21 22 23 24 1000 1500 2000 2500 3000
(c)
21 20 19 Temperature (K) 2θ (degrees)(101)
M(b)
x=0.65 x=1 x=0.35Counts (arb. units)
2θ (degrees) (101)M (110)SS (002)S NPD 300 K x=0 TlFe1.75(Se1-xSx)2
(a)
(101)
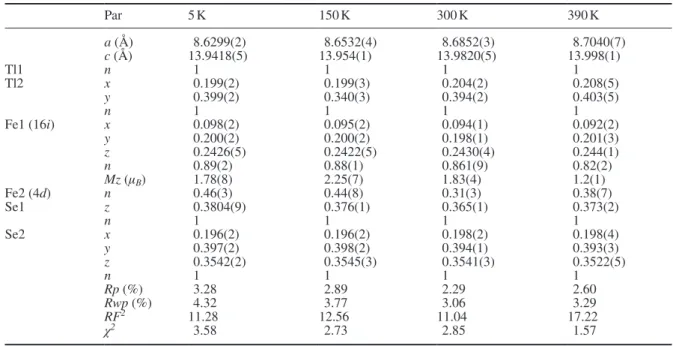
M 2 300 180 30 100 20 19 21 2θ (degrees) J. Phys.: Condens. Matter 26 (2014) 275701selenide in the temperature range 5–470 K. The refined struc-tural parameters for TlFe1.75Se2 based on neutron powder dif-fraction data collected at 5, 150, 300, 390 and 470 K are listed in tables 2 and 3.
3.2.1. Low temperature behaviour. In the diffraction pat-terns collected between 5 and 390 K the (110) superlattice and (101) magnetic reflections associated with the tetragonal
× ×
a a c
5 5 superstructure are present, in agreement with
the ED study. Both the nuclear and magnetic structures were therefore refined together as one phase using the I4/m space group symmetry with a magnetic model of I4/m’ (figure 6(a)). The Fe moments lie along the c-axis, aligned antiferromag-netically between layers in a ‘blocked checkerboard’ arrange-ment (Inset figure 6(a)) as previously reported for K0.8Fe1.6Se2 [31]. The resulting magnetic moments of 1.83(4) µB at 300 K, 2.25(7) µB at 150 K and 1.78(8) µB at 5 K are lower than the moment of 3.2–3.4 µB observed at ~10 K in 5a× 5a c× AFM A0.8Fe1.6Se2 (A = K, Rb [28, 31]). However, they are all in good agreement with those reported for partially disordered
single crystals of TlFe1.6Se2 (1.72(6) µB at 300 K, 2.07(9) µB at 140 K, and 1.31(8) µB at 5 K [7]). For single crystal TlFe1.6Se2 with complete vacancy ordering, the magnetic moment reaches ~3 µB at 140 K (moment lying along the c-axis) and 5 K (moments lying in the 5a× 5a plane [32].
In partially disordered TlFe1.6Se2 single crystals, a canting of the magnetic moments between 100 and 150 K leads to an abrupt increase in the c lattice parameter of ~ 0.05–0.1 Å on cooling (although the effect is less visible in powdered samples obtained from these crystals, ~0.01 Å [33]). In contrast, in fully ordered TlFe1.6Se2 single crystals, the magnetic transition at 100 K i.e. the spin re-orientation from the c-axis into the ab plane is not associated with such anomaly [32]. The lattice parameters of our TlFe1.6+δSe2 sample, derived from low temperature XRD data (in agree-ment with the variation obtained from NPD) are shown in figures 7(a), (b). The behaviour of c is smooth around 100 K with no evidence of an increase in the c-axis, indicating that our TlFe1.6+δSe2 powder sample is rather well-ordered and homogenous.
The neutron diffraction data collected at 5 K on TlFe1+δSe2 powder were also refined using the non-collinear magnetic structure (magnetic space group I4/m with the moments lying in the 5a× 5a plane) used by May et al to model the mag-netic structure of fully ordered TlFe1.6Se2 single crystals [32]. This resulted in a lower quality fit and a reduced magnetic moment of 1.4(1) µB, compared to 1.78(8) µB for the model with the moments lying along c. Hence, our results are in agreement with the findings by May et al which show that, in the magnetic ground state for partially disordered TlFe1.6Se2, the magnetic moments are aligned along the c-axis, and in fully ordered TlFe1.6Se2 they are lying in the ab plane [32].
Figure 8 shows the electrical resistance data for TlFe1.6+δSe2 between 5 and 500 K. Around 93 K there is a sharp increase in the resistivity with decreasing temperature and the resistance continues to increase down to ~13 K where it exceeds the limit of the instrument with a resistance of >2 × 10⁵ Ω. Anomalies at around 100 K have also been observed in resistivity, mag-netization and specific heat capacity measurements of both partially and fully ordered TlFe1.6Se2 single crystals, and were shown to be related to the spin re-orientation of the magnetic moments described before [7, 32]. In partially disordered TlFe1.6Se2 crystals a second anomaly can be seen in the resis-tivity data of Sales et al [7] at ~40 K related to a canting of the magnetic moments between 100 and 140 K [33]. In fully ordered crystals this magnetic transition at ~140 K is not vis-ible in the resistivity nor in the magnetization data. Only the spin re-orientation transition at 100 K is visible in the R(T) and magnetic susceptibility curves. We do not see any anomaly in our resistivity data at 140 K. This is again an indication that the degree of ordering of our TlFe1.6+δSe2 powder sample is probably better than in the partially ordered crystals grown by Sales et al [7].
3.2.2. High temperature behaviour. In the NPD patterns acquired above RT we observed that, at 470 K the super-lattice and magnetic reflections have disappeared as a result of the disorder of the Fe vacancies associated with the phase
Figure 5. (a) Refined lattice parameters (from Rietveld refinements of NPD and XRD data using the I4/mmm space group) of TlFe1.75(Se1−xSx)2 samples (nominal compositions) at 300 K as a
function of the S content, x. (b) Fe-Se/S bond length and (c) height. Error bars are smaller than the symbols. Inset: variation of the refined Fe content with S substitution.
2.30 2.35 2.40 2.45 XRD NPD XRD NPD XRD NPD
Fe-Se/S bond length
(Å ) 0.0 0.2 0.4 0.6 0.8 1.0 1.35 1.40 1.45 1.50 Fe-Se/S height (Å) S content, x 3.75 3.80 3.85 3.90 3.95 c-axis (Å) a -axis (Å ) 13.2 13.5 13.8 14.1 (c) (b) (a) 0.0 0.2 0.4 0.6 0.8 1.0 1.4 1.5 1.6 1.7 1.8 Fe content S content, x
S J E Carlsson et al
7 transition from the 5a× 5a c× (space group I4/m) to the
× ×
a a c I4/mmm symmetry (figure 6(b)).
Figures 7(a), (b) shows the variation of the lattice param-eters (expressed in the a × ×a c lattice) with temperature derived from the NPD and XRD data. Above the magneto-structural phase transition at ~430 K (see R(T) curve figure 8) there is a large increase in the a-axis and a change in the slope of the a(T) curve. Furthermore, the c-axis decreases sharply (0.03 Å) above the transition temperature. This effect was also observed in single crystals of Cs0.83Fe1.71Se2 by Pomjakushin
et al [26] and TlFe1.6Se2 by Cao et al [33]. For the latter com-pound, the reduction in c at high T is less pronounced, pos-sibly due to the samples being less well ordered than the one used in our study. A substantial change in the lattice param-eters across the AFM transition at ~435 K indicates a strong magnetoelastic coupling in these A1−yFe1.6+δSe2 (A = Tl, K, Rb, Cs) compounds.
Above RT the electrical resistance continuously decreases up to ~435 K where there is a steeper drop and above this tem-perature it decreases further but at a slower rate. This anomaly, as described in section A, is close to the Néel temperature,
TN ~ 430 K, observed in TlFe1.6Se2 by Sales et al [7] and can therefore be assumed to be associated with the antiferromag-netic transition. Comparing the heating and cooling R(T) curves between 300 and 570 K, the anomaly is observed at the same temperature ~435 K but there is clear hysteresis. After heating the sample up to 570 K, the room temperature resistance was
Table 2. Refined structural parameters for TlFe1.6+δSe2 from neutron diffraction data (D2B) collected at 5, 150, 300 and 390 K.
Par 5 K 150 K 300 K 390 K a (Å) 8.6299(2) 8.6532(4) 8.6852(3) 8.7040(7) c (Å) 13.9418(5) 13.954(1) 13.9820(5) 13.998(1) Tl1 n 1 1 1 1 Tl2 x 0.199(2) 0.199(3) 0.204(2) 0.208(5) y 0.399(2) 0.340(3) 0.394(2) 0.403(5) n 1 1 1 1 Fe1 (16i) x 0.098(2) 0.095(2) 0.094(1) 0.092(2) y 0.200(2) 0.200(2) 0.198(1) 0.201(3) z 0.2426(5) 0.2422(5) 0.2430(4) 0.244(1) n 0.89(2) 0.88(1) 0.861(9) 0.82(2) Mz (µB) 1.78(8) 2.25(7) 1.83(4) 1.2(1) Fe2 (4d) n 0.46(3) 0.44(8) 0.31(3) 0.38(7) Se1 z 0.3804(9) 0.376(1) 0.365(1) 0.373(2) n 1 1 1 1 Se2 x 0.196(2) 0.196(2) 0.198(2) 0.198(4) y 0.397(2) 0.398(2) 0.394(1) 0.393(3) z 0.3542(2) 0.3545(3) 0.3541(3) 0.3522(5) n 1 1 1 1 Rp (%) 3.28 2.89 2.29 2.60 Rwp (%) 4.32 3.77 3.06 3.29 RF2 11.28 12.56 11.04 17.22 χ2 3.58 2.73 2.85 1.57
Space group I4/m with atomic positions Tl1, 2a (0,0,0), Tl2 8h (x,y,0), Fe1 16i (x,y,z), Fe2 4d (0,1/2,1/4), Se1 4e (0,0,z) and Se2 16i (x,y,z). A magnetic model with I4/m’ with only the Mz component was used for the fitting.
Table 3. Refined structural parameters for TlFe1.6+δSe2 at 470 K.
Space group I4/mmm with a = 3.9073(4) Å and c = 13.970(2) Å.
Atom site x y z n
Tl 2a 0 0 0 1
Fe 4d 0 1/2 1/4 0.72(1)
Se 4e 0 0 0.3550(3) 1
Rp = 2.68%, Rwp = 3.39%, and χ2 = 1.62
Figure 6. Rietveld refinement results for the neutron powder diffraction measurements (D2B) on TlFe1.6+δSe2 at 300 K and
470 K. Black ticks mark the Bragg peak positions. (a) The fit at 300 K was made using space group I4/m with an antiferromagnetic ordering described by I4/m’. (b) The pattern at 470 K, where both the Fe vacancies and the magnetic moments are disordered, can be described by the tetragonal ThCr2Si2 structure, space group
I4/mmm. Inset: crystal and magnetic structure of TlFe1.6+δSe2 in a
tetragonal I4/m unit cell with the occupied Fe1 sites marked dark purple, vacant Fe2 sites light blue, Se sites orange and Tl sites green. -100 0 100 200 300 400 500 20 40 60 80 100 120 140 -50 0 50 100 150 200
(b)
Intensity (arb. units)
NPD 300 K
(a)
Intensity (arb. units)
Obs Calc Diff
2θ (degrees) NPD 470 K
reduced by half implying that the phase transition is not fully reversible and that the Fe vacancy ordering is improved by this annealing. A structural study of Cs0.83(Fe1−ySe)2 by Svitlyk et al show a similar irreversibility in the temperature variation of several structural parameters, most notably the Se height [34].
3.3. Order/disorder in the TlFe2−zS2 sulphides with different z In order to investigate the effect of the Fe content, z on the vacancy and magnetic ordering in TlFe2−zS2 sulphides, a second sample with the nominal composition TlFe1.5S2 was synthesized using the synthetic route described earlier. Powder
XRD data revealed that the TlFe1.5S2 sample consisted of a mixture of two phases: the I4/mmm tetragonal structure and an orthorhombic superstructure with a 2a×2 2a c× cell (space group Ibam), derived from the original I4/mmm lattice, which is only present if the iron deficiency is large, as reported ear-lier by Zabel et al in 1980 and Sabrowsky et al in 1986 [6, 35]. This was also observed in our previous TlFe2−z(Se1−xSx)2 series where the orthorhombic phase was more prevalent in the compounds with high z [20].
The presence of the orthorhombic phase was confirmed by TEM and EDS analysis performed on several crystallites of TlFe1.5S2 (figure 9). Reconstruction of the reciprocal space evidenced an orthorhombic unit cell with the cell parameters
a ≈ 5.4 Å, b ≈ 10.5 Å, c ≈ 13.3 Å, in agreement with the Rietveld
refinements of the powder XRD data (a = 5.4004(3) Å,
b = 10.8518(7) Å and c = 13.302(1) Å). The reflection conditions (hkl: h + k + l = 2n, 0kl: k = 2n, (l = 2n), hk0: (h + k = 2n)) are compatible with the orthorhombic space group Ibam (n °72) and the average cationic composition of TlFe1.4(1)S2 is also con-sistent with the XRD Rietveld refinement results (TlFe1.37(2)S2). The absence of any superstructure reflections in the labora-tory XRD data would imply disordered iron vacancies in the iron plane in the tetragonal a a c× × I4/mmm phase. However, in the NPD pattern collected at 300 K, both the (110) super lattice peak and the (101) magnetic peak are clearly visible (figure 10(a)). This indicates that the same 5a× 5a c×
lattice found in the pure selenide TlFe1.6+δSe2 is also present in the TlFe1.5S2 sample and that the signal-to-noise ratio in the XRD data is too low to detect the superstructure reflec-tions. The long-range AFM order shown here demonstrates that at least a significant proportion of the 5a× 5a c×
lattice is perfectly ordered with the stoichiometry TlFe1.6S2 (i.e. empty Fe2 sites). The resulting magnetic moment of 1.0(1) µB at 300 K for TlFe1.5S2 is almost half of that of the pure selenide, 1.82(5) µB. The variation of the intensity of the (101) magnetic peak with temperature for TlFe1.5S2 is shown in the inset of figure 10(a). Just as for the partially S substituted TlFe1.75(Se0.65S0.35)2 sample (figure 4(c)) there is a saturation of the magnetic moment at low temperature
Figure 7. (a) and (b) Unit cell parameters of TlFe1.6+δSe2 as
a function of temperature based on NPD and XRD data. (c) The refined magnetic moment (D2B data). Inset graph: the refined magnetic moment as a function of S content at various temperatures. The dashed line indicates TN estimated from the R(T) measurements. 3.86 3.87 3.88 3.89 3.90 3.91 13.92 13.94 13.96 13.98 14.00 0.0 0.5 1.0 1.5 2.0
(b)
(c)
XRD NPD D2Ba
-axis
(
Å)
XRD NPD D2B(a)
c
-axis
(Å )µ
Fe(
µ
B)
Temperature (K)
0 50 100 150 200 250 300 350 400 450 0.0 0.2 0.4 0.6 0.8 1.0 0.0 0.5 1.0 1.5 2.0 2.5 300 K 150 K 5 K 1.5 K µ Fe (µB ) S content, xFigure 8. Low and high temperature dependence of the electrical resistance of TlFe1.6+δSe2 in zero field. The anomaly observed at T2
is related to the spin re-orientation of the iron magnetic moments. 0 100 200 300 400 500 0.1 1 10 100 R ( Ω ) TlFe1.6+δSe2 R ( Ω ) Temperature (K) Heating Cooling T2~93 K TN~435 K 0.1 1 10 100
S J E Carlsson et al
9 with a refined value of 1.8(1) µB at 1.5 K. This increase of the magnetic moment can also be seen in the relative ratio of the (101)M/(002) peaks which is 0.63, 0.59 and 0.45 at 1.5, 150 and 300 K, respectively. Hence, the Fe mag-netic moment remains high at low temperature for both the
S-substituted samples (2.21(9) µB and 1.8(1) µB at 1.5 K for
x = 0.35 and 1, respectively) meaning that introducing S into the system does not strongly affect the magnetic properties (inset figure 7(c)) over the whole range of substitution. This is one explanation as to why superconductivity is absent in the TlFe1.6+δ(Se1−xSx)2 series.
Figure 10(b) shows the electrical resistance (R(T)) behav-iour of polycrystalline TlFe1.5S2. There is a clear kink in the curve around TN ~ 335 K, confirming the existence of long-range magnetic order in the associated 5a× 5a c× lattice. A similar transition temperature was observed in our pre-vious Tl0.8Fe1.5S2 (nominal composition) powder sample,
TN ~ 334 K [20]. The variation of the Neel temperature, TN, (extracted from the R(T) curves) with increased S content (x) for TlFe2−z(Se1−xSx) is plotted in the inset of figure 10(b).
In the first part of this study we observed that sulphur rich compositions produce an increased iron occupation on the (empty) Fe2 sites (inset figure 5(c)), preventing the magnetic ordering in the 5a× 5a iron plane for x > 0.35. Here we demonstrate that reducing the nominal iron content of the mixture permits a stabilization of this 5a× 5a c× AFM phase in rich S compositions. The choice of the nominal Fe content is therefore a crucial parameter. In the case of thallium selenides, May et al have shown that different growth con-ditions i.e. different nominal TlFexSe2 composition, produce crystals with very different magnetization behaviour related to its micro-structure consisting of nano-scale domains of ordered and disordered iron vacancy regions with different relative proportion [32].
4. Conclusions
The isovalent substitution of S for Se in the TlFe1.6+δ(Se1−xSx)2 system has been studied by neutron powder diffraction for the first time over the full range of 0 ≤ x ≤ 1. Complementary XRD, electron diffraction using a TEM and transport measurements have also been performed. Our work shows the strong inter-play between the existence of long range AFM magnetic order and crystallographic parameters. By carefully controlling the nominal iron content of the sample, we were able to stabilize the long-range ‘block checkerboard’ AFM order related to the
× ×
a a c
5 5 superstructure for rich sulphur compositions
Figure 9. Electron diffraction patterns of TlFe1.5+δS2 recorded along the [001], [100] and [210] directions (left to right) indexed in an
orthorhombic cell.
Figure 10. (a) Selected low 2-theta region of the NPD patterns of TlFe1.5S2 and TlFe1.75S2 (nominal compositions) showing the
(101) magnetic peak and the (110) super lattice peak related to the tetragonal 5a× 5a c× cell. Inset: variation of the intensity of the (101) magnetic peak with temperature for the x = 1.5 sample. (b) Low- and high-temperature dependence of the electrical resistance of TlFe1.5S2 highlighting the signature of the long range AFM
structure at TN. Inset: the variation of TN as a function of S content
extracted from the resistivity data of the TlFe2−z(Se1−xSx)2 samples.
20 22 24 26 10000 20000 30000 40000 50000 0 50 100 150 200 250 300 350 400 450 500 1 10 In te nsit y (arb. un its)
NPD 300 K
TlFe
xS
2 2θ (degrees)(a)
300 19 21 23 150 2 2 θ (deg.) T em p. (K ) (101)M lo g R/R( 30 0K ) Temperature (K) TN ~ 335 K(b)
x=1.5 0.0 0.2 0.4 0.6 0.8 1.0 340 360 380 400 420 440 Fe 1,75 Fe 1,5 (002)S (110)SS x=1.75 x=1.5 TNé el (K ) S content, x (101)M Fe 1,75 J. Phys.: Condens. Matter 26 (2014) 275701with the Néel temperature varying from 435 K (x = 0) down to 335 K (x = 1). At low temperature the iron magnetic moment remains high for all S compositions (from x = 0 to x = 1) and the magnetism is not strongly affected by the Se/S substitu-tion. This is one important factor which contribute to explain why superconductivity is not induced in the TlFe1.6+δ(Se1−xSx)2 system. However, for x > 0.35, keeping a too large iron content in the nominal mixture, results in compounds that are not mag-netically ordered at RT, nor down to the lowest temperature of ~2 K (as measured by NPD), because the Fe2 sites of iron vacancies become filled and the vacancy ordering is lost.
Acknowledgments
The authors acknowledge O Leaynaud for the low T XRD measurements on the D8 diffractometer. We are also grateful to J Marcus for his help with the transport measurements at low and high T. This work was partially supported by the project SupraTetraFer ANR-09-BLAN-0211 of the Agence Nationale de la Recherche of France.
References
[1] Guo J, Jin S, Wang G, Wang S, Zhu K, Zhou T, He M and Chen X 2010 Phys. Rev. B 82180520
[2] Wang A F et al 2011 Phys. Rev. B 83 060512 [3] Shermadini Z et al 2011 Phys. Rev. Lett. 106117602
[4] Fang M, Wang H, Dong C, Li Z, Feng C, Chen J and Yuan H Q 2011 Eur. Phys. Lett. 9427009
[5] Häggström L, Verma H R, Bjarman S, Wäppling R and Berger R 1986 J. Solid State Chem. 63401
[6] Sabrowsky H, Rosenberg M, Welz D, Deppe P and Schäfer W 1986 J. Magn. Magn. Mater. 54 1497
[7] Sales B C, McGuire M A, May A F, Cao H, Chakoumakos B C and Sefat A S 2011 Phys. Rev. B 83224510
[8] Yu R, Zhu J-X and Si Q 2011 Phys. Rev. Lett. 106186401
[9] Yan X W, Gao M, Lu Z Y and Xiang T 2011 Phys. Rev. Lett.
106087005
[10] Texier Y, Deisenhofer J, Tsurkan V, Loidl A, Inosov D S, Friemel G and Bobroff J 2012 Phys. Rev. Lett. 108237002
[11] Ding X et al 2013 Nat. Commun. 41897
[12] Li W et al 2012 Nat. Phys. 8126
[13] Han F, Yang H, Shen B, Wang Z Y, Li C H and Wen H H 2012
Phil. Mag.922553
[14] Chen F et al 2011 Phys. Rev. X 1021020
[15] Kasahara S et al 2010 Phys. Rev. B 81184519
[16] Jiang S, Xing H, Xuan G F, Wang C, Ren Z, Feng C M, Dai J H, Xu Z A and Cao G H 2009 J. Phys.:Condens.
Matter21 382203
[17] Yeh K W et al 2008 Eur. Phys. Lett. 8437002
[18] Mizuguchi Y, Tomioka F, Tsuda S, Yamaguchi T and Takano Y 2009 Appl. Phys. Lett. 93 152505
[19] Lei H, Abeykoon M, Bozin E, Wang K, Warren J B and Petrovic C 2011 Phys. Rev. Lett. 107137002
[20] Toulemonde P, Santos-Cottin D, Lepoittevin Ch, Strobel P and Marcus J 2013 J. Phys.:Condens. Matter 25075703
[21] Klein T et al 2010 Phys. Rev. B 82184506
[22] Noat Y et al 2010 J. Phys.:Condens. Matter 22465701
[23] Rietveld H M 1969 J. Appl. Crystallogr. 265
[24] Larson A C and Von Dreele R B 1994 Los Alamos National
Laboratory Report LAUR 86-748 [25] Rodriguez-Carvajal J 1993 Physica B 19255
[26] Pomjakushin V et al 2011 Phys. Rev. B 83144410
[27] Wang Z, Song Y, Wang W Z, Chen Z, Tian H, Chen G, Guo J, Yang H and Li J 2011 Phys. Rev. B 83140505
[28] Ye F, Chi S, Bao W, Wang X F, Ying J J, Chen X H, Wang H D, Dong C H and Fang M 2011 Phys. Rev. Lett.
107137003
[29] Song Y J, Wang Z, Wang Z W, Hi H L, Chen Z, Tian H F, Chen G F, Yang H X and Li J Q 2011 Eur. Phys. Lett.
95 37007
[30] Liu R H et al 2011 Eur. Phys. Lett. 9427008
[31] Bao W, Huang Q, Chen G F, Green M A, Wang D M, He J B, Wang X Q and Qiu Y 2011 Chin. Phys. Lett. 28086104
[32] May A F, McGuire M A, Cao H, Sergueev I, Cantoni C, Chakoumakos B C, Parker D S and Sales B C 2012
Phys. Rev. Lett.109077003
[33] Cao H et al 2012 Phys. Rev. B 85054515
[34] Svitlyk V, Chernyshov E, Pomjakushina E, Krzton-Maziopa A, Conder K, Pomjakushin V and Dmitriev V 2011
Inorg. Chem.5010703


![Figure 9. Electron diffraction patterns of TlFe 1.5+ δ S 2 recorded along the [001], [100] and [21 0] directions (left to right) indexed in an orthorhombic cell.](https://thumb-eu.123doks.com/thumbv2/123doknet/14483210.524539/11.892.120.766.96.306/figure-electron-diffraction-patterns-recorded-directions-indexed-orthorhombic.webp)
