HAL Id: hal-01070405
https://hal.archives-ouvertes.fr/hal-01070405
Submitted on 7 Oct 2014
HAL is a multi-disciplinary open access
archive for the deposit and dissemination of
sci-entific research documents, whether they are
pub-lished or not. The documents may come from
teaching and research institutions in France or
abroad, or from public or private research centers.
L’archive ouverte pluridisciplinaire HAL, est
destinée au dépôt et à la diffusion de documents
scientifiques de niveau recherche, publiés ou non,
émanant des établissements d’enseignement et de
recherche français ou étrangers, des laboratoires
publics ou privés.
Sampling-based methods for a full characterization of
energy landscapes of small peptides
Didier Devaurs, Amarda Shehu, Thierry Simeon, Juan Cortés
To cite this version:
Didier Devaurs, Amarda Shehu, Thierry Simeon, Juan Cortés. Sampling-based methods for a full
char-acterization of energy landscapes of small peptides. IEEE International Conference on Bioinformatics
and Biomedicine, Nov 2014, Belfast, United Kingdom. 8 p. �hal-01070405�
Sampling-based Methods for a Full Characterization
of Energy Landscapes of Small Peptides
Didier Devaurs
∗, Amarda Shehu
†, Thierry Sim´eon
∗and Juan Cort´es
∗∗CNRS, LAAS, 7 avenue du colonel Roche, F-31400 Toulouse, France; Univ de Toulouse, LAAS, F-31400 Toulouse, France
Email:{devaurs, nic, jcortes}@laas.fr
†Department of Computer Science, George Mason University, Fairfax, VA, 22030, USA
Email: amarda@gmu.edu Abstract—Obtaining accurate representations of energy
land-scapes of biomolecules such as proteins and peptides is central to structure-function studies. Peptides are particularly interesting, as they exploit structural flexibility to modulate their biological function. Despite their small size, peptide modeling remains challenging due to the complexity of the energy landscape of such highly-flexible dynamic systems. Currently, only sampling-based methods can efficiently explore the conformational space of a peptide. In this paper, we suggest to combine two such methods to obtain a full characterization of energy landscapes of small yet flexible peptides. First, we propose a simplified version of the classical Basin Hopping algorithm to quickly reveal the meta-stable structural states of a peptide and the corresponding low-energy basins in the landscape. Then, we present several variants of a robotics-inspired algorithm, the Transition-based Rapidly-exploring Random Tree, to quickly determine transition state and transition path ensembles, as well as transition proba-bilities between meta-stable states. We demonstrate this combined approach on the terminally-blocked alanine.
Keywords—energy landscape; peptide; sampling-based method I. INTRODUCTION
Global thermodynamic and kinetic properties of molecules can be extracted from an analysis of their conformational energy landscapes [1]. In particular, obtaining an accurate representation of a molecule’s energy landscape is a significant first step to conducting detailed structure-function studies for bio-molecules of central importance in the cell, such as proteins and peptides [2].
In this work, we focus on small peptides. Despite their modest size, they represent in many ways a more challenging setting than larger proteins. Peptides exhibit high structural flexibility, which enables them to recognize different molecular partners in the cell, and thus to modulate their biological function [3]. Contrary to proteins, that are often characterized by a unique native state and a funnel-shaped energy landscape, peptides are characterized by several meta-stable structural states; their energy landscape may contain a multitude of competitive low-energy basins.
The existence of multiple local minima in a molecule’s energy landscape makes it particularly challenging to map this landscape and reconstruct all the functionally-important regions in it. Experimental methods, such as X-ray crystal-lography or nuclear magnetic resonance (NMR), cannot reveal such maps, as they can uncover only few structures at best [4]. It is therefore the task of computational techniques to obtain detailed representations of energy landscapes.
Currently, only sample-based representations of the energy landscape can be afforded. Even for small peptides, the space of possible conformations is vast, and the effective degrees of freedom needed to represent a conformation are numerous. The high dimensionality of the space is accompanied by a complex (non-linear, non-convex) expression for the conformational en-ergy, which is the result of competing local and non-local inter-atomic interactions. Probing this landscape is therefore very computationally-costly. Currently, only stochastic optimization techniques provide the right balance between accuracy and computational efficiency [1], [2].
Obtaining a representation of an energy landscape can be divided into two sub-problems: (1) determining meta-stable structural states (i.e. local energy minima); (2) computing transition paths between the identified states. Both can be addressed by achieving a dense yet efficient sampling of the conformational space.
In this paper, we propose to combine two sampling-based techniques to obtain a full characterization of energy land-scapes of small yet highly-flexible peptides. First, we utilize our own variant of the classical Basin Hopping algorithm [5] to sample local minima in a peptide’s energy landscape, and characterize low-energy basins in this landscape. Local minima are then organized via density-based clustering to reveal meta-stable structural states. Second, we use several variants of a robotics-inspired algorithm, the Transition-based Rapidly-exploring Random Tree (T-RRT) [6], to map out the connectivity between these states, thus completing the reconstruction of the peptide’s energy landscape. In particular, we propose a new variant of T-RRT allowing to compute transition path ensembles and transition probabilities between meta-stable structural states. To illustrate this, and as a proof-of-concept, we present results obtained on the terminally-blocked alanine, which is a frequent benchmark for studies in theoretical physical chemistry.
II. METHODS
The work presented in this paper is motivated by re-cent studies showing that robotics-inspired sampling-based algorithms can be a good basis for efficient conformational sampling and exploration in computational structural biol-ogy [7], [8]. The Transition-based RRT (T-RRT) algorithm is an example of such algorithms [9], [6]. It is based on the Rapidly-exploring Random Tree (RRT) [10], a popular path planning algorithm that can tackle complex problems in high-dimensional spaces. RRT has been successfully used
in various disciplines, such as robotics, aerospace, computer animation, and computational structural biology. T-RRT is an extension of RRT involving a probabilistic transition test based on the Metropolis criterion. Like Metropolis Monte Carlo methods [11], it applies small moves to the molecular system; but, instead of generating a single path over the search space, it constructs a tree, providing a more efficient exploration. Moreover, the tree construction is intrinsically biased toward unexplored regions of the space, and favors expansions in low-energy areas.
This work is partly based on an existing variant of T-RRT, called Multi-T-RRT [12], and on a new extension to it, called Multi-T-RRT with Cycles. These algorithms are combined with an in-house variant of the Basin Hopping algorithm involving a simplified minimization process. Together they are used to obtain a complete representation of the energy landscape of a small yet flexible peptide. Details of these methods are presented in the next sections.
A. Basin Hopping
The Basin Hopping (BH) algorithm is a popular method for sampling local minima of an energy landscape. It was originally introduced to obtain the Lennard-Jones minima of small atom clusters [5]. Recently, BH has gained new attention to predict protein structure [13], and to find intermediate structures of chemical reactions [14]. The method consists of repeatedly applying a structural perturbation followed by an energy minimization, which yields a trajectory of minima. The result is a (discrete) coarse-grained representation of the energy landscape that can be seen as a collection of interpenetrating staircases.
Our variant of BH differs from the classical one in that it does not involve local, gradient-based minimizations, but relies on simple Monte-Carlo-based (MC-based) minimizations. Our implementation of BH (that is presented in Algorithm 1) follows a random restart procedure performing several rounds, each one starting from a conformation randomly sampled in the search space. Every round builds a trajectory of minima by performing a succession of structural perturbations followed by MC-based minimizations. Every MC-based minimization starts from a conformation obtained by performing a large-amplitude perturbation of the minimum reached at the previous step, or from the random sample, in the first step. An MC-based minimization is an iterative succession of small-amplitude perturbations. The search goes on, accepting new conforma-tions if the energy decreases or the Metropolis criterion is satisfied, until a given number of consecutive rejections is reached. Every MC-based minimization produces a low-energy conformation that we call a “minimum” in a minor abuse of language. Every round produces what we call a milestone: the minimum (along the trajectory) having the lowest energy.
All the milestones (or the minima) produced by BH have to be grouped to provide a comprehensible list of meta-stable structural states. This clustering can be done in several ways. In this work, we perform a density-based clustering requiring the user to define the distance threshold between two clusters [15]. Distance computations are based on Root-Mean-Square Deviation (RMSD) and involve dihedral angles or atom coordinates.
Algorithm 1: Basin Hopping input : the conformational spaceC
the number of rounds nbRounds
the number of Monte Carlo minimizationsnbM C output: the list of trajectories of minimaL
1 L ← φ 2 forr = 1..nbRounds do 3 T ← φ ; q ← sampleRandomConformation(C) 4 form = 1..nbM C do 5 ifm > 1 then 6 q ← doLargeAmplitudePerturbation(q) 7 q ← doMonteCarloBasedMinimization(q) 8 addMinimum(T , q) 9 addTrajectory(L, T ) 10 returnL
B. Multi-T-RRT with Cycle-Addition
The Rapidly-exploring Random Tree (RRT) algorithm is a well-known path planning method that can deal with complex problems by performing an efficient exploration, even in high-dimensional search spaces [10]. Starting from an initial conformation qinit, RRT performs its exploration by iteratively
constructing a tree T that tends to rapidly expand over the conformational spaceC. The nodes and edges of T correspond to states (i.e. molecular conformations) and small-amplitude moves between states, respectively. At each iteration of the tree construction, a conformation qrand is randomly sampled
in C. Then, an extension toward qrand is attempted, starting
from its nearest neighbor qnear, inT . This means performing
a linear interpolation between qnear and qrand, at a distance
equal to the extension step-size δ, from qnear. If the extension
succeeds, a new conformation qnew is added toT and an edge
is built between qnear and qnew. The criteria on when to stop
the exploration can be reaching a given target conformation qgoal, a given number of nodes in the tree, a given number of
iterations, or a given running time.
The Transition-based RRT (T-RRT) algorithm is a variant of RRT developed to explore a conformational space while taking the conformational energy into account [9], [6]. T-RRT extends T-RRT by integrating a stochastic transition test favoring the exploration of low-energy regions of the space. As the Metropolis criterion typically used by Monte Carlo methods, this transition test is used to accept or reject a candidate state. Here, the transitionTest presented in Algorithm 2 is used to evaluate the local move from qnear
to qnew based on their respective energies Ei and Ej. More
precisely, a downhill move (Ej≤ Ei) in the energy landscape
is always accepted. An uphill move is accepted or rejected based on the probability e−(Ej−Ei) / (K·T ) (where K is the
Boltzmann constant), which decreases exponentially with the energy variation Ej−Ei. In that case, the level of selectivity of
the transition test is controlled by the temperature T , which is an adaptive parameter of the algorithm. Low temperatures limit the expansion to gentle slopes of the energy landscape, and high temperatures enable it to climb steep slopes. After each accepted uphill move, T is decreased to avoid over-exploring high-energy regions: it is divided by 2(Ej−Ei) / energyRange(G),
where energyRange(G) is the energy difference between the highest-energy and the lowest-energy conformations in the
Algorithm 2: transitionTest (G, Ei, Ej)
input : the current temperatureT ; the temperature increase rateTrate; the Boltzmann constantK
output: true if the transition is accepted, false otherwise
1 ifEj≤ Ei then returnTrue
2 ife−(Ej−Ei) / (K·T )> 0.5 then
3 T ← T / 2(Ej−Ei) / energyRange(G); return True
4 else
5 T ← T · 2Trate; return False
Algorithm 3: Multi-T-RRT
input : the conformational spaceC; the extension step-size δ; the energy functionE : C → R;
the initial conformationsqk
init,k = 1..n
output: the treeT
1 fork = 1..n do
2 Tk← initTree(qkinit)
3 while not stoppingCriteria({Tk| k = 1..n}) do
4 T′← chooseNextTreeToExpand()
5 qrand← sampleRandomConformation(C)
6 qnear′ ← findNearestNeighbor(T′,qrand)
7 qnew← extend(qnear′ ,qrand,δ) 8 if qnew6= null and
9 transitionTest(T′, E(q′
near), E(qnew)) then
10 addNewNode(T′,qnew)
11 addNewEdge(T′,q′near,qnew)
12 (T′′,qnear′′ )← findNearestTree(qnew)
13 if distance(qnew,q′′near) ≤ δ then
14 T ← merge(T′,qnew,T′′,q′′near) ; n ← n − 1 15 returnT
graph G built so far. After each rejected uphill move, T is increased to facilitate the exploration and avoid being trapped in a local energy minimum: it is multiplied by 2Trate, where
Trate∈ (0, 1] is the temperature increase rate.
The Multi-T-RRT algorithm is a multiple-tree variant of T-RRT [12]. Instead of building a single tree rooted at some initial conformation, the idea is to build n trees rooted at n given conformations qkinit, k = 1..n. The pseudo-code of the Multi-T-RRT is presented in Algorithm 3. At each iteration, a tree T′ is chosen for expansion in a round-robin fashion.
Then, an extension is attempted toward a randomly sampled conformation qrand, starting from its nearest neighbor q′near,
in T′. If the extension succeeds, the new conformation q new
is added to T′
, and connected to qnear′ . Then, we search for
the conformation q′′
near, which is the closest to qnew within all
trees other than T′
. If the distance between qnew and qnear′′ is
less than or equal to the extension step-size δ, T′ is linked
to and merged with T′′, the tree to which q′′
near belongs. In
that case, the number of trees is decreased by 1. The space exploration continues until all trees are merged into a single one or another stopping criterion (number of nodes, number of expansions, running time) is met.
A drawback of the Multi-T-RRT is that it can produce “unnatural” transition paths (cf. Section III). To address this issue, we propose a new extension to T-RRT, based on a
cycle-addition procedure. Starting from the tree produced by the
Algorithm 4: T-RRT with Cycles
input : the conformational spaceC; the extension step-size δ; the energy functionE : C → R;
the tree built by the Multi-T-RRTT output: the graphG
1 G ← initGraph(T )
2 while not stoppingCriteria(G) do
3 qrand← sampleRandomConformation(C)
4 qnear← findNearestNeighbor(G, qrand)
5 qnew← extend(qnear,qrand,δ)
6 if qnew6= null and
7 transitionTest(G, E(qnear), E(qnew)) then
8 addNewNode(G, qnew)
9 addNewEdge(G, qnear,qnew)
10 forqcan∈ G \ {qnew} do
11 if distance(qnew,qcan) ≤ δ and
12 noEdgeBetween(qnew,qcan) then
13 addNewEdge(G, qnew,qcan)
14 returnG
Multi-T-RRT, the idea is to allow the space exploration to con-tinue, and to add edges leading to the creation of cycles. This enables us to construct a graph from which several paths can be extracted between two given conformations. The pseudo-code of this T-RRT with Cycles is shown in Algorithm 4. It differs from T-RRT only in that, after every successful extension, an edge is added between qnew and each conformation in the
graph G that is not already connected to qnew, and whose
distance to qnew is less than or equal to the extension
step-size δ. The stopping criteria involve the number of nodes and of expansions, as well as the running time. Finally, the
Multi-T-RRT with Cyclesconsists of consecutively running the Multi-T-RRT and the Multi-T-RRT with Cycles.
As several paths may exist in the graph G between two given conformations, a quality criterion is required to compare paths. This is achieved by associating weights with the edges of G, based on the notion of mechanical work [9]. More precisely, the weight of the directed edge connecting qi and qjis equal to
max{ 0 , E(qj) − E(qi) } , i.e. to the positive energy variation
between qi and qj. This constitutes the amount of energy that
has to be added to the molecule for the transition from qito qj
to happen. Note that using the mechanical work as a quality criterion requires to create two directed edges between qi and
qj, instead of creating a single undirected edge. Finally, given
two conformations in G, the best (directed) path linking them is defined as the one minimizing the mechanical work, and is obtained using Dijkstra’s algorithm.
In this work, we use the mechanical work as a path-quality criterion because it has been shown that T-RRT tends to generate paths having a low mechanical work [9]. Furthermore, in many situations, the mechanical work can assess the quality of a path better than a simple criterion such as the integral of the cost along the path [9]. Other criteria could be considered, such as the minimum resistance (linked to the MaxFlux algorithm [16], [17]) or the maximum flux [18]. However, finding which criterion is the most relevant is out of the scope of this paper. Furthermore, it has been shown that, in the case of the terminally-blocked alanine, transition paths produced using different criteria are often similar [18].
Fig. 1. Internal-coordinate representation of the terminally-blocked alanine.
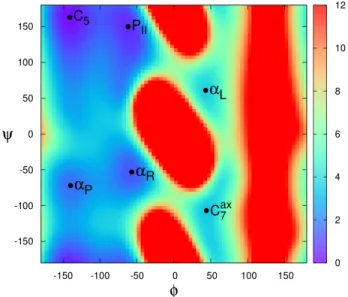
Fig. 2. Projection of the energy landscape of the terminally-blocked alanine on the(φ, ψ) internal coordinates. For reference, the lowest energy value is set to0 kcal/mol. Names used for the local minima are taken from [20], [21].
C. Force Field
To compute conformational energy values, we use an in-house implementation of the AMBER parm96 force-field with an implicit representation of the solvent using the Generalized Born approximation. All results are obtained on an Intel Core i5 processor at 2.6 GHz with 8 GB of memory.
III. RESULTS ANDDISCUSSION
A. Terminally-Blocked Alanine
As a proof of concept, we use our methods to explore the energy landscape of the terminally-blocked alanine. This molecule is an alanine residue acetylated in its N-terminus and methylamidated in its C-terminus: Ace–Ala–Nme (cf. Fig. 1). Despite its small size, it is a common test-model because of its complex energy landscape characterized by several local minima connected by multiple pathways involving various transition states [19], [20], [21], [22], [23].
The exploration of the conformational space involves an internal-coordinate representation of the terminally-blocked alanine, assuming constant bond lengths and bond angles. The conformational parameters are the dihedral angles{φ, ψ, χ} of the Ala residue, χ of the Ace capping, χ of the Nme capping, ω of the Ace-Ala peptide bond, and ω of the Ala-Nme peptide bond (cf. Fig. 1). As the peptide bond torsions are known to undergo only small variations, the ω angles are allowed to vary only up to10◦
from the planar trans conformation.
TABLE I. ENERGY AND(φ, ψ)COORDINATES OF THE LOCAL MINIMA OF THE TERMINALLY-BLOCKED ALANINE. NAMES ARE TAKEN FROM[20], [21]. FOR REFERENCE,THE LOWEST ENERGY IS SET TO0KCAL/MOL.
C5 PII αR αP C7ax αL
φ (◦) -141 -62 -57 -140 44 43
ψ (◦) 163 150 -53 -72 -107 61
E (kcal/mol) 0 0.44 1.11 1.52 3.27 3.48
The φ and ψ dihedral angles of the terminally-blocked alanine are critical, for their flexibility allows internal hydrogen bonds to form. Consequently, the energy landscape of the terminally-blocked alanine is often projected on these two coordinates to facilitate analysis [20], [21], [23]. In a similar way, we compute a Ramachandran map by projecting the energy landscape of the terminally-blocked alanine on the 2-dimensional space defined by the (φ, ψ) coordinates (cf. Fig. 2). This 2-D map is generated by varying both dihedral angles with a 5◦ step and finding the lowest-energy
confor-mation corresponding to each(φ, ψ) pair. This local minimum is determined using a random restart procedure performing multiple, independent minimizations. Each minimization starts from a randomly sampled conformation, and generates new conformations by perturbing any dihedral angle (except φ and ψ) of the current minimum. A new conformation is accepted if its energy is lower than the current minimum, otherwise it is rejected. The minimization stops when a maximum number of consecutive rejections is reached. The six local minima visible on the(φ, ψ) Ramachandran map (cf. Fig. 2) correspond to six known meta-stable states of the terminally-blocked alanine, namely the C5, PII, αR, αP, C7ax, αL states [20], [21]. To
determine the energy values and the(φ, ψ) coordinates of these minima, the exhaustive exploration of the (φ, ψ) projection of the energy landscape is refined with a 1◦ step in the relevant
areas. Results are reported in Table I.
B. Local Energy Minima of the Terminally-blocked Alanine
We now show that, using Basin Hopping, it is possible to quickly find the energy minima of the terminally-blocked ala-nine, as identified by the (very costly) exhaustive exploration of the (φ, ψ) space presented previously. The parameters of BH are set as follows: we perform 100 rounds, each round executing 10 MC-based minimizations whose maximal number of consecutive rejections is set to 10. Therefore, every run of BH produces 1000 minima and 100 milestones, in about 2 s (on average over 100 runs). The large-amplitude perturbations initiating MC-based minimizations affect only the φ or ψ dihedral angle. The small-amplitude perturbations performed during an MC-based minimization affect only one, randomly chosen angle among all dihedral angles. The clustering pro-cedure used to group the milestones is based on an RMSD similarity measure involving the coordinates of the carbon atoms of the backbone of the terminally-blocked alanine, and on a similarity threshold of 0.25 ˚A. This method consistently produced six clusters, after each one of the 100 runs, and the cluster representatives fitted well the six target minima (see Fig. 3). To evaluate the precision of the method, we compute the average (and standard deviation) of the coordinates of these representatives, and compare them to the(φ, ψ) coordinates of the target minima. Results (not reported here due to space lim-itations) show that precision is very high. For each coordinate of any minimum, the difference between the average of the
Fig. 3. Results of the exploration of the energy landscape of the terminally-blocked alanine produced by Basin Hopping. The minima generated by the Monte-Carlo-based minimizations are represented by grey disks, and the selected milestones by yellow disks. Among them, the red disks are the cluster representatives. For reference, the labeled black circles show the six (target) minima identified by the exhaustive search.
values returned by BH and the target value is never greater than0.5◦ (which is the error inherent to the resolution of the
exhaustive search), and the standard deviation of the values returned by BH is never greater than0.3◦.
We have also used BH to obtain a description of the catchment basins on the energy landscape of the terminally-blocked alanine. This enables us to characterize the low-energy basins to which the meta-stable states belong, as well as the transition state ensembles between them. To do that, the parameters of BH are set as follows: we perform 100 rounds, each round executing 10 MC-based minimizations whose maximal number of consecutive rejections is set to 100. Therefore, a run of BH produces 1000 minima, which takes about 25 s. Clustering these minima (and not the milestones, as previously done) produces again the same six clusters. This allows grouping the associated starting points of the MC-based minimizations into six clusters, representing six catchment basins (see Fig. 4). A visual analysis of the result shows that these clusters provide a good characterization of the low-energy basins (where the clusters do not overlap) and of the transition state ensembles between them (where the clusters overlap). These regions could be automatically characterized using segmentation techniques, but this is out of the scope of this paper.
C. Transition Paths of the Terminally-blocked Alanine
We now show that T-RRT can quickly produce many transition paths between meta-stable states of the terminally-blocked alanine. The conformations used as input for Multi-T-RRT are the energy minima produced by BH. The conforma-tional distance is based on the L2 norm in the (φ, ψ) space.
The extension step-size δ is set to 0.1 rad, meaning that the maximal angular variation between two conformations is about 5.7◦. The Boltzmann constant being1.987 · 10−3 kcal/mol/K,
Fig. 4. Characterization of the catchment basins on the energy landscape of the terminally-blocked alanine, obtained with Basin Hopping. The colored disks represent the starting points of the MC-based minimizations. The color of a disk identifies the cluster to which the minimum produced by the corresponding MC-based minimization belongs.
by setting the initial temperature to 70 K, we impose the probability of accepting an energy increment of 0.1 kcal/mol to be around 50% at the beginning of the exploration. Finally, the temperature increase rate Trate is set to 0.1.
Starting with six trees, Multi-T-RRT quickly returns a single tree (in about 0.1 s on average over 100 runs) from which paths connecting the minima are extracted. These paths are then projected on the (φ, ψ) space and plotted on the Ramachandran map of the terminally-blocked alanine. We observe that some of these paths may look “unnatural”: in the instance illustrated by Fig. 5 (top), the transition path from PII
to αL goes through almost all the other minima. Using T-RRT
with Cycles allows solving this issue, thanks to the alternative paths created in the graph. For instance, Fig. 5 (bottom) shows a graph obtained after letting T-RRT with Cycles run for 100 s. This method produces more direct transition paths between all pairs of minima. In fact, the longer the running time of T-RRT with Cycles, the more direct paths are found thanks to the increasing coverage of the space by the graph and to the increasing number of cycles in the graph. While remaining acceptable for a user, a running time of 100 s enables us to obtain a reasonably dense coverage of the space.
To get an idea of the diversity of the transition paths of the terminally-blocked alanine, we run both variants of Multi-T-RRT 100 times and aggregate all the extracted paths on the same Ramachandran map, as illustrated by Fig. 6. We can see that most low-energy and medium-energy regions of the landscape are covered by the transition paths. However, in the case of Multi-T-RRT, the paths going through the medium-energy area corresponding to φ ∈ [−100◦,−50◦]
and ψ ∈ [0◦,50◦] are under-represented in comparison to
the case of Multi-T-RRT with Cycles. Finally, we observe that no transition path goes through the energetic barrier corresponding to φ∈ [100◦
Fig. 5. Graphs generated by two variants of T-RRT exploring the confor-mational space of the terminally-blocked alanine. Top: graph produced by Multi-T-RRT (which stops when all trees are merged) in about0.1 s. Bottom: graph produced by T-RRT with Cycles after running for100 s. The edges of the graph are represented by thin grey lines. The transition path from PIIto
αL(extracted from the graph) is highlighted in black.
Multi-T-RRT with Cycles can be used to compute transi-tion probabilities between all pairs of energy minima of the terminally-blocked alanine. This is done by running it 1000 times and counting how many runs yield a graph from which a direct transition path can be extracted between a given pair of minima. More precisely, we consider that a run produces a direct transition path between two minima if the best path in the graph between them does not go through another minimum. By varying the maximal running time of the algorithm, it is possible to determine which transitions are most or least likely. The results of this experiment are reported in Fig. 7. It appears that the most likely transitions involve the pairs (C5,
PII) and (αR, αP), as already shown in [20]. Direct transition
paths are easily found between the minima in these pairs,
Fig. 6. Transition paths generated by100 runs of Multi-T-RRT (top) and 100 runs of Multi-T-RRT with Cycles (bottom) exploring the conformational space of the terminally-blocked alanine. The maximal running time was set to100 s for the latter.
even when runtime is low. If we had no other information about the energy landscape, we could infer that these minima are not separated by high-energy barriers or other low-energy basins. On the other hand, it requires a longer time for the transition probabilities associated with (Cax
7 , αL) to reach
1, meaning that high-energy barriers probably separate them. Furthermore, since transitions from αP to αR are very likely,
it takes some time before the algorithm is able to produce transition paths from αP to C5 or PII that do not go through
αR. That is why the corresponding transition probabilities
increase slowly with runtime. This is similar for the transitions going from C5to αP. Interpreting the other curves is difficult:
it is impossible to know how many high-energy barriers or low-energy basins separate the corresponding minima without additional information.
C5 0 20 40 60 80 100 0.01 0.1 t (s) 1 10 100 PII 0 20 40 60 80 100 0.01 0.1 t (s) 1 10 100 αR 0 20 40 60 80 100 0.01 0.1 t (s) 1 10 100 αP 0 20 40 60 80 100 0.01 0.1 t (s) 1 10 100 C7 ax 0 20 40 60 80 100 0.01 0.1 t (s) 1 10 100 αL 0 20 40 60 80 100 0.01 0.1 t (s) 1 10 100 C5C5 PIIPII αRαR αPαP C7axC7 αL ax α L
Fig. 7. Transition probabilities (expressed as percentages) between all pairs of minima of the terminally-blocked alanine, in relation to the running time of Multi-T-RRT with Cycles (in seconds, on a logarithmic scale). Probabilities are computed on the basis of 1000 runs. In each plot, the title indicates the initial conformation of the transition paths extracted from the graph, and the five curves correspond to the possible goal conformations (see color legend).
TABLE II. ENERGY AND(φ, ψ)COORDINATES OF THE SADDLE POINTS OF THE TERMINALLY-BLOCKED ALANINE,AVERAGED OVER100
TRIALS OF A PROCEDURE BASED ON THEMULTI-T-RRT. STANDARD DEVIATION IS ALSO GIVEN FOR THE COORDINATES. STANDARD
DEVIATION OF THE ENERGY WAS LESS THAN0.05KCAL/MOL.
φ (◦) 67 ± 3 1 ± 2 0 ± 3 69 ± 3
ψ (◦) 128 ± 5 92 ± 2 -88 ± 3 -13 ± 4
E (kcal/mol) 6.2 6.8 6.9 7
D. Transition States of the Terminally-blocked Alanine
From the transition paths computed by Multi-T-RRT, we can extract some information about the transition state en-sembles of the terminally-blocked alanine. First, we define a transition state as the conformation having the highest energy along a given path. Our experiment consists of running Multi-T-RRT 1000 times (which takes about 120 s on average) and aggregating on the Ramachandran map the transition states found along all direct transition paths between any pair of minima. To obtain ensembles, we group the transition states using the same clustering procedure as when grouping the minima produced by BH. Among all the clusters, we reject those containing less than 100 states (i.e. 10% of the number of runs) as being not significant. We also reject clusters containing more than 1000 states because they cannot correspond to a single transition state ensemble. Finally, we choose as cluster representatives the conformations having the lowest energy within each cluster. After repeating the whole procedure 100 times, we observed that it consistently produced four clusters, i.e. four transition state ensembles (as illustrated by Fig. 8).
Within each transition state ensemble, the conformation with the lowest energy corresponds to a saddle point on the energy landscape. Our experiment shows that the terminally-blocked alanine features exactly four energy saddle-points (see Fig. 8). To assess the precision of our procedure at determining the (φ, ψ) coordinates and the energy values of these saddle points, we compute averages and standard deviations across the 100 trials we performed. Results are reported in Table II.
From their standard deviations, we can infer that it is difficult to accurately estimate the coordinates of the saddle points. However, since the standard deviation of the energy values is very low (less than 0.05 kcal/mol), we can speculate that this is mainly due to the flatness of the saddles.
IV. CONCLUSION
In this paper, we have presented a methodology to explore and obtain a complete representation of the energy land-scape of small flexible peptides. The methodology combines a variant of Basin Hopping (BH) with several extensions of a robotics-inspired algorithm: the Transition-based Rapidly-exploring Random Tree (T-RRT). The paper makes several algorithmic contributions. First, by implementing a simplified version of the BH algorithm, where local, gradient-based en-ergy minimization steps are replaced by simple Monte-Carlo-based minimization steps, we achieve a relevant exploration of the energy landscape yielding numerous samples around energy minima. This leads to a quick determination of meta-stable structural states and low-energy basins containing them. In addition, the multiple-tree version of T-RRT is very fast at generating transition paths between meta-stable states. This provides us with a good description of the transition path and transition state ensembles. Finally, by using an anytime variant of the Multi-T-RRT algorithm, we are able to estimate transition probabilities between meta-stable states.
The aim of this paper was to demonstrate that combining sampling-based algorithms such as BH and T-RRT allows quickly obtaining a full representation of the energy landscape of a small yet highly-flexible peptide. Studying the terminally-blocked alanine served as a proof-of-concept in this paper. Our next targets are bigger peptides, starting with the met-Enkephalin (Tyr–Gly–Gly–Phe–Met). Despite the great interest it has sparked due to its dynamical structure and its potential role in pain inhibition, alcoholism, and cancer treatment, this peptide is currently poorly understood [24]. The preliminary tests we have performed on the met-Enkephalin show that
Fig. 8. Transition state ensembles (represented by black dots) of the terminally-blocked alanine, obtained by aggregating the results of1000 runs of Multi-T-RRT, and clustering the extracted transition states (i.e. the highest-energy conformations along all direct transition paths). Transition states rejected by the clustering procedure appear as grey dots. The red disks correspond to the cluster representatives, i.e. the lowest-energy conformations in all clusters; they are energy saddle points.
the methods we propose can remain efficient with bigger peptides. Indeed, when running the Multi-T-RRT using as input height conformations corresponding to local energy minima of the met-Enkephalin (produced by BH), we obtain a graph connecting them in 25 s (on average over 100 runs). If we disregard the solvent in our force field, a solution can be obtained in about 2 s (on average over 100 runs). As part of our ongoing work, we also have to ensure that the clustering procedures involved in our methods remain effective when dealing with bigger peptides.
Directions of future work include exploiting the graph produced by a single run of the Multi-T-RRT with Cycles to describe transition path and transition state ensembles. This will allow us to make better use of computational resources, as opposed to aggregating paths extracted from several runs of the Multi-T-RRT. In addition, Markov-based transition-step analysis can be conducted on the graph produced by one or more runs of T-RRT. This analysis can allow estimating stabilities of each computed state, and provide a rigorous basis for the designation of a state as stable or semi-stable.
ACKNOWLEDGMENT
This work has been partially supported by the French National Research Agency (ANR) under project ProtiCAD (project number ANR-12-MONU-0015).
REFERENCES
[1] D. Wales, Energy Landscapes: Applications to Clusters, Biomolecules
and Glasses. Cambridge University Press, 2003.
[2] A. Shehu, “Probabilistic search and optimization for protein energy landscapes,” in Handbook of Computational Molecular Biology, ser. Computer & Information Science Series, 2013, in press.
[3] G. Paine and H. Scheraga, “Prediction of the native conformation of a polypeptide by a statistical-mechanical procedure. III. Probable and average conformations of enkephalin,” Biopolym., vol. 26, no. 7, pp. 1125–62, 1987.
[4] P. Amodeo, F. Naider, D. Picone, T. Tancredi, and P. Temussi, “Confor-mational sampling of bioactive conformers: A low-temperature NMR study of15N-Leu-Enkephalin,” J. Pept. Sci., vol. 4, no. 4, pp. 253–65,
1998.
[5] D. Wales and J. Doye, “Global optimization by basin-hopping and the lowest energy structures of Lennard-Jones clusters containing up to 110 atoms,” J. Phys. Chem. A, vol. 101, no. 28, pp. 5111–16, 1997. [6] L. Jaillet, F. Corcho, J.-J. P´erez, and J. Cort´es, “Randomized tree
con-struction algorithm to explore energy landscapes,” J. Comput. Chem., vol. 32, no. 16, pp. 3464–74, 2011.
[7] B. Gipson, D. Hsu, L. Kavraki, and J.-C. Latombe, “Computational models of protein kinematics and dynamics: Beyond simulation,” Ann.
Rev. Analyt. Chem., vol. 5, pp. 273–91, 2012.
[8] I. Al-Bluwi, T. Sim´eon, and J. Cort´es, “Motion planning algorithms for molecular simulations: A survey,” Comput. Sci. Rev., vol. 6, no. 4, pp. 125–43, 2012.
[9] L. Jaillet, J. Cort´es, and T. Sim´eon, “Sampling-based path planning on configuration-space costmaps,” IEEE Trans. Robotics, vol. 26, no. 4, pp. 635–46, 2010.
[10] S. LaValle and J. Kuffner, “Rapidly-exploring random trees: progress and prospects,” in Algorithmic and Computational Robotics: New
Directions, 2001, pp. 293–308.
[11] D. Frenkel and B. Smit, Understanding Molecular Simulations: From
Algorithms to Applications, 2nd ed. Academic Press, 2001.
[12] D. Devaurs, M. Vaisset, T. Sim´eon, and J. Cort´es, “A multi-tree approach to compute transition paths on energy landscapes,” in Proc.
AIRMCB Workshop, 2013.
[13] B. Olson and A. Shehu, “Evolutionary-inspired probabilistic search for enhancing sampling of local minima in the protein energy surface,”
Proteome Sci., vol. 10, no. Suppl 1, p. S5, 2012.
[14] Y. Kim, S. Choi, and W. Kim, “Efficient basin-hopping sampling of reaction intermediates through molecular fragmentation and graph theory,” J. Chem. Theory Comput., vol. 10, no. 6, pp. 2419–26, 2014. [15] M. Kim, S.-H. Choi, J. Kim, K. Choi, J.-M. Shin, S.-K. Kang,
Y.-J. Choi, and D. Jung, “Density-based clustering of small peptide conformations sampled from a molecular dynamics simulation,” J.
Chem. Inform. Model., vol. 49, no. 11, pp. 2528–36, 2009.
[16] S. Huo and J. Straub, “The MaxFlux algorithm for calculating varia-tionally optimized reaction paths for conformational transitions in many body systems at finite temperature,” J. Chem. Phys., vol. 107, no. 13, pp. 5000–6, 1997.
[17] ——, “Direct computation of long time processes in peptides and pro-teins: reaction path study of the coil-to-helix transition in polyalanine,”
Proteins: Structure, Function, Genetics, vol. 36, no. 2, pp. 249–61,
1999.
[18] R. Zhao, J. Shen, and R. Skeel, “Maximum flux transition paths of conformational change,” J. Chem. Theory Comput., vol. 6, no. 8, pp. 2411–23, 2010.
[19] P. Bolhuis, C. Dellago, and D. Chandler, “Reaction coordinates of biomolecular isomerization,” PNAS, vol. 97, no. 11, pp. 5877–82, 2000. [20] J. Chodera, W. Swope, J. Pitera, and K. Dill, “Long-time protein folding dynamics from short-time molecular dynamics simulations,” Multiscale
Model. Simul., vol. 5, no. 4, pp. 1214–26, 2006.
[21] H. Okumura and Y. Okamoto, “Temperature and pressure dependence of alanine dipeptide studied by multibaric-multithermal molecular dy-namics simulations,” J. Phys. Chem. B, vol. 112, pp. 12 038–49, 2008. [22] M.-P. Gaigeot, “Unravelling the conformational dynamics of the aque-ous alanine dipeptide with first-principle molecular dynamics,” J. Phy.
Chem. B, vol. 113, no. 30, pp. 10 059–62, 2009.
[23] C. Velez-Vega, E. Borrero, and F. Escobedo, “Kinetics and reaction coordinate for the isomerization of alanine dipeptide by a forward flux sampling protocol,” J. Chem. Phys., vol. 130, no. 22, p. 225101, 2009. [24] D. Sauriyal, A. Jaggi, and N. Singh, “Extending pharmacological spec-trum of opioids beyond analgesia: Multifunctional aspects in different pathophysiological states,” Neuropeptides, vol. 45, pp. 175–88, 2011.