HAL Id: hal-01708203
https://hal.archives-ouvertes.fr/hal-01708203
Submitted on 13 Feb 2018HAL is a multi-disciplinary open access archive for the deposit and dissemination of sci-entific research documents, whether they are pub-lished or not. The documents may come from teaching and research institutions in France or abroad, or from public or private research centers.
L’archive ouverte pluridisciplinaire HAL, est destinée au dépôt et à la diffusion de documents scientifiques de niveau recherche, publiés ou non, émanant des établissements d’enseignement et de recherche français ou étrangers, des laboratoires publics ou privés.
Comparison of the Saturated Salt Solution and the
Dynamic Vapor Sorption techniques based on the
measured sorption isotherm of barley straw
Rudy Bui, Matthieu Labat, Jean-Emmanuel Aubert
To cite this version:
Rudy Bui, Matthieu Labat, Jean-Emmanuel Aubert. Comparison of the Saturated Salt So-lution and the Dynamic Vapor Sorption techniques based on the measured sorption isotherm of barley straw. Construction and Building Materials, Elsevier, 2017, 141, pp.140 - 151. �10.1016/j.conbuildmat.2017.03.005�. �hal-01708203�
1
Comparison of the Saturated Salt Solution and the Dynamic Vapor Sorption
1
techniques based on the measured sorption isotherm of barley straw
2
Bui Rudy
1*,Labat Matthieu
1, Aubert Jean-Emmanuel
13 4
1LMDC, Université de Toulouse, INSA, UPS, France 5
* Corresponding author: rbui@insa-toulouse.fr
6
LMDC, INSA/UPS Génie Civil, 135 Avenue de Rangueil, 31077 Toulouse cedex 04 France.
7 8
Abstract 9
For Heat, Air and Moisture modelling, one of the most crucial hygrothermal properties of porous 10
construction materials is the sorption isotherm. Current techniques for measuring the sorption 11
isotherm rely on the standardized Saturated Salt Solution (SSS) method which is known to be time 12
consuming. Recently, a device called Dynamic Vapor Sorption was applied on building materials 13
allowing faster measurements but limiting the mass and volume of the sample. As this technique is 14
not yet standardized, an experimental procedure was developed and validated on barley straw. 15
Results were also in good agreement with the measurements from the SSS technique. 16
17
Keywords: Sorption isotherm, Dynamic Vapor Sorption, Saturated Salt Solution, Measurement, 18
Straw, Uncertainty 19
2 Nomenclature 21 Latin Symbols 22 A, B, C fitting parameters - 23
b moisture effusivity kg.s-1.m-1.Pa-1
24 g flux kg.m-2.s-1 25 k coverage factor - 26 l fitting parameter - 27
M molar mass kg.mol-1
28
m mass of the sample kg 29 n number of points - 30 N number of samples - 31 P pressure Pa 32 p fitting parameter - 33 q number of parameters - 34
R ideal gas constant J.K-1.mol-1
35 u uncertainty - 36 T temperature K 37 t time s 38 U global uncertainty - 39 x variable - 40 w water content % 41 42 Greek symbols 43
δ water vapor permeability kg.(m2.s.Pa)-1
44
μ mean value -
45
ρ density kg.m-3
3 ξ sorption capacity (kgV.kg-1) 47 σ standard deviation - 48 ϕ relative humidity [0:1] 49 50 Subscripts 51
a A-type (or random)
52
b B-type (or systematic)
53 Disp display 54 h holder 55 Lin linearity 56 0 dry state 57 s saturation 58 v vapor 59 w water 60 61
1.
Introduction
62In buildings, moisture has an influence on comfort, energy consumption and durability [1]. Most 63
construction materials exchange water vapor with their surroundings, and this water vapor makes up 64
as much as one third of the total moisture released into the indoor air according to [2]. Hence, 65
assessing moisture transfer at room or building scale is crucial and relies on simulation through Heat, 66
Air and Moisture (HAM) models. Nowadays, as many as 50 different models can be found as noted in 67
[3]. Although every model has its own specificities, they all rely on the water mass balance [4], which 68
can be expressed as follows: 69
4 (1)
g t w 70Most of the time, the models differ on the expression of the flux (right hand side of (1)). For the left 71
hand term, however, there is a stronger consensus that it can be decomposed as presented in [5] 72
when the moisture transfer is limited to the hygroscopic area : 73 (2)
t
t
w
t
w
74ξ, sometimes referred to as the sorption capacity, represents the variation of the moisture content of 75
the material for a given variation of relative humidity (ϕ). It also corresponds to the slope of the 76
sorption isotherm, which has to be determined experimentally. Consequently, knowing the sorption 77
isotherm is a key step in the comprehension of moisture transfer and its modelling. To determine the 78
sorption curves, samples are exposed to constant temperature and relative humidity until their mass 79
stabilizes. By comparison with the mass obtained in the dry state (i.e. the mass obtained for ϕ=0%), it 80
is possible to determine the moisture content for the relative humidity in question. Then, samples 81
are exposed to monotonically increasing values of relative humidity so that the absorption curve can 82
be plotted. Repeating the procedure for monotonically decreasing values of relative humidity allows 83
the desorption curve to be plotted. The complete method is described in standard NF EN ISO 12571 84
[6]. 85
The most common technique relies on the use of Saturated Salt Solution (SSS) to obtain a stable 86
value of relative humidity. It should be underlined that SSS were used for calibrating relative 87
humidity sensors [7] until recently. Consequently, SSS should be used if very good accuracy is 88
desired. However, several researchers have acknowledged that this method is very time-consuming, 89
as stated by [8] for example. It was also acknowledged that the increase of the experiment’s duration 90
leads to a greater chance of experimental errors. Improving the accuracy of such measurements is an 91
on-going topic, as poor reproducibility of hygric properties has been reported in [9]–[11]. Even 92
5 though the discrepancies in the sorption values were reasonable compared to other hygric 93
properties, they should be determined precisely so that the reliability of simulation works can be 94
addressed. This can be handled by determining the experimental uncertainty using well-established 95
calculations, as presented in [12], and allows the most influential sources to be identified. For 96
example, Feng et al. [11] concluded that reliable results could be obtained with the SSS technique by 97
one laboratory but that significantly higher differences were observed when the results obtained by 98
different laboratories were compared. This conclusion also stresses the need for a precisely defined 99
experimental protocol. Finally, knowledge of the uncertainty of the material properties is required if 100
a sensitivity analysis is to be achieved, as in [13] for example. This technique determines how the 101
uncertainty of the inputs influences the outputs. In the last mentioned study, it was concluded that 102
the influence of the sorption isotherm on the modelling outcome (namely, the RH of indoor air) was 103
not negligible. 104
For this reason, attempts have been made to reduce the duration of the tests. By assuming an 105
excellent homogeneity of all the samples, one could divide the samples into small groups and subject 106
each group to a different relative humidity. Feng et al. [14] used this method on autoclaved aerated 107
concrete and compared the results to those obtained using the method proposed by NF EN ISO 108
12571. Alternatively, some authors have proposed relying on numerical techniques to predict the 109
material properties, based on the analysis of dynamic behaviors. For example, inverse modelling of a 110
MBV test (see [15] for a complete description) was proposed in [16] using Bayesian techniques. 111
Similarly, Rouchier et al. [17] used the Covariance Matrix Adaptation evolution strategy to solve an 112
inverse HAM problem in a multi-layer wall exposed to real climatic conditions. Reasonable 113
agreement was obtained between computed and measured sorption curves but significant 114
differences were observed above 70% RH. Even though these approaches sound promising, they first 115
have to be tested with respect to reliable values. 116
6 In recent years, a technique initially used in the pharmaceutical field and known as Dynamic Vapor 117
Sorption (DVS) has been developed. This technique relies on the observation that the time for mass 118
stabilization to be obtained depends directly on the mass. In consequence, using lighter samples 119
leads to shorter tests. However, this is not straightforward as smaller samples may not be 120
representative, especially for construction materials such as concrete, which is very heterogeneous. 121
Having a representative material is of utmost importance for the DVS technique, this may explain 122
why it is currently not very popular in the field of civil engineering. Nevertheless, some examples can 123
be found in the literature as it can still be used for many construction materials. It was successfully 124
used in [18] for 5 materials (autoclaved aerated concrete, lightweight ceramic brick, a phase change 125
material, lime plaster and an old fashioned ceramic brick), in [19], [20] for unfired clay bricks and 126
earth blocks, and in [21] for natural fibers. Taking advantage of the shorter time needed to complete 127
the experiment, some authors used the DVS technique to get a more comprehensive understanding 128
of the physical phenomena. For example, Fort et al. [22] used this technique to investigate the 129
influence of temperature on the sorption isotherm. In [23], it was stated that the particle size/surface 130
area and pore diameter has a crucial role on the water sorption and desorption process for drug 131
substances. 132
The SSS and the DVS techniques were already compared in the literature, as in [24] for 5 different 133
materials (flax insulation, perlite insulation, cellulose insulation, glass wool insulation and cellular 134
concrete). No significant difference was observed between the two techniques but it was pointed out 135
that the determination of the dry mass had a significant effect. Good agreement was also obtained 136
in [8] based on 5 different types of food. Despite the extensive use of this technique, it was observed 137
that the literature is poor on detailed statistical analysis to compare the DVS and SSS techniques. 138
Therefore, these comparisons are rather qualitative. Moreover, some other examples can be found 139
where a lesser agreement was obtained, as in [25] for corn flakes samples for example. According to 140
the authors, this discrepancy may be related to the slow diffusion of the water vapor in the corn flake 141
matrix. A significant shift was observed in [26] measurements achieved on earth. Still, the shape of 142
7 the two isotherms was similar and this shift was explained by a difference in the dry state. In [20] and 143
[26], it seems that the mass stabilization of the sample was not systematically obtained, especially 144
for high relative humidity where the kinetic of adsorption was slower, which led to an 145
underestimation of the water content of the material. On a more global point of view, it seems that 146
the results obtained with the DVS technique are similar to those obtained with the SSS technique, yet 147
this statement cannot be generalized to all materials. One of the possible reasons is that there is no 148
standard which applies to the DVS technique, so that the default procedure proposed by the 149
manufacturer may not always be relevant for all the materials, as the heterogeneity and so the vapor 150
permeability are bound to serve as an influence. 151
Three points emerge from this short literature review: 152
1. It is necessary to quantify the sorption properties of construction materials for modelling 153
purposes; 154
2. The reliability of the material properties is a current concern; 155
3. Two main experimental techniques are used nowadays. The SSS technique is well-156
established and documented but time-consuming. For the DVS technique, on the other 157
hand, fewer measurements have been reviewed. 158
The main objective of this paper is to propose an experimental comparison between the two 159
techniques, and to give elements of their advantages and drawbacks. Hence, results obtained with 160
the DVS technique are compared to the ones obtained with the SSS technique. The latter will be 161
achieved by using the standards NF EN ISO 12570 and NF EN ISO 12571. It was chosen to strictly 162
follow the standards for this technique, yet it could be improved. However, this falls out from the 163
topic of this study. For the DVS technique on the other hand, no such standard exists and the 164
experimental procedures will be presented in detail. Results obtained with both techniques will then 165
be discussed through the means of a statistical analysis: special care will be taken to estimate the 166
experimental uncertainties, so that the reliability of both techniques will be compared. 167
8 To do this, the experimental method will be presented and discussed for the two techniques. The 168
detailed procedure for the uncertainty calculation will be presented in section 3. As mentioned 169
above, the DVS technique may not be suitable for heterogeneous materials and the SSS technique is 170
very time-consuming. In this work it was decided to focus on a single material, namely barely straw, 171
as explained in section 4. Finally, results obtained with both techniques will be exposed and 172
discussed in section 5. 173
2.
Presentation of the two techniques
174
2.1.
Saturated salt solution technique
175
The SSS technique is covered by the standards NF EN ISO 12570 [27] and NF EN ISO 12571 [6], which 176
describe the procedures for obtaining the dry mass and for measuring the sorption isotherm. 177
2.1.1.
Procedure used to obtain the dry mass
178
According to [27], the samples should be “[dried] at the temperature specified in the relevant 179
product standard to constant mass”, prior to testing. A ventilated oven able to maintain the relative 180
humidity below 10% should be used. Finally, the balance has to be capable of weighing test 181
specimens with an uncertainty not greater than 0.1% of their mass. Still according to the standard, 182
the drying temperature depends upon the material. It should be: 183
40 ± 2°C for materials for which a higher temperature can drive out water of crystallization or 184
affect blowing agents; 185
70 ± 2°C for materials in which changes in structure can occur between 70°C and 105°C; 186
105 ± 2°C for materials having structures that do not change at 105°C. 187
According to [24], the use of a temperature of 105°C will remove all the physically bound water but 188
not all materials can tolerate this temperature. This latest recommendation remains quite unclear, 189
9 which may explain why other drying temperatures have been used in the literature, as shown in 190
Table 1. 191
Table 1 - Examples of drying temperature in the literature 192
Reference Material Drying temperature (°C)
[28] Silt, kaolin, bentonite 105°C
[29] Hemp concrete 23°C (use of silica gel)
[14] Calcium Silicate 70°C
[26] Earth bricks 50°C
[30] Wood-based products 55°C
[31] Concrete 44°C
193
Here, it was presumed that microstructural changes may occur in barely straw at 70°C. According to 194
the standard, a drying temperature of 40°C should have been used. However, for practical reasons 195
and to compare this work with previous studies in the same project, samples were dried at 50°C. The 196
relative humidity in the oven was monitored hourly with a KIMO KH200 device and found to lie 197
between 5.4 and 7.0%. Finally, the samples were weighed every day at the same time with a balance 198
accurate to within ±10-4 g until their mass stabilized.
199
2.1.2.
Procedure used to obtain the sorption isotherm
200
The experimental procedure is presented in [6] and can be summarized as follows: 201
A constant temperature (±0.5°C) has to be maintained during the whole experiment; 202
At least 3 samples of the same material should be used; 203
The sample holders should not be sensitive to humidity variations; 204
A minimum of five different conditions should be selected in the humidity range considered, 205
with relative humidity increasing in stages; 206
10 The moisture content is obtained when the mass variation is less than 0.1% between three 207
consecutive weighings; 208
The balance has to be selected so that its accuracy is better than ±0.01% of the mass of the 209
samples. 210
Here, all the samples were placed in a sealed box (50 x 35 x 30 cm3) equipped with two fans, in order
211
to improve the RH uniformity and to avoid the water vapor to be absorbed locally from around the 212
samples. Indeed, without the fans, the SSS method is relying on a very slow Fickian diffusion to 213
redistribute the water vapor in the material, which could lead to a non-uniform absorption. 214
Approximately 1.5 L of saturated salt solution was prepared in our laboratory, poured into a 215
crystallizer (2.6 L) and placed inside the box (see Figure 1). Six different salts were used for this study. 216
They were selected on the basis of their availability, cost and toxicity, and in order to cover the whole 217
range of the sorption isotherm. The temperature was maintained at (23±2°C). For five of the six salts, 218
the associated theoretical values of the relative humidity with their uncertainties were mentioned in 219
[6], and are presented in Table 2. For the remaining case, the value was found by [32], but no 220
uncertainty was given. 221
11 Table 2 – Saturated salt solutions used for the SSS method
222
Salt Chemical formula Relative Humidity (%) Cost for 1.5 L (€)
Sodium hydroxide NaOH 7.6 ± 2.0 1 2
Potassium acetate CH3COOK 22.2 ± 0.4 1 332
Potassium carbonate K2CO3, 2H2O 43.2 ± 0.4 1 123
Ammonium nitrate NH4NO3 63.2 2 4
Sodium chloride NaCl 75.4 ± 0.2 1 1
Potassium nitrate KNO3 94.0 ± 0.6 1 14
1 According to [6]
2 According to [32]
223
224
Figure 1 – Picture of the hermetically sealed box used for the SSS method 225
2.2.
The DVS system
226
2.2.1.
Apparatus
227
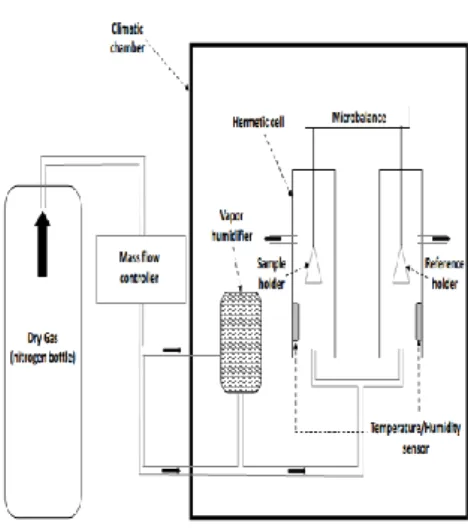
The device used in this study was developed by SMS (Surface Measurement Systems, London, United 228
Kingdom). Its main component is a microbalance accurate to within ±0.0110 mg that has an upper 229
limit of 10 g. The sample was placed on one side of the microbalance in a holder (sample holder) 230
12 made of quartz or aluminium; a reference holder located on the other side of the balance was left 231
empty. The holders were confined in two separate hermetically sealed cells and an air flow was 232
applied at a controlled temperature and relative humidity. The desired relative humidity was 233
obtained by mixing a dry gas (nitrogen), coming from a bottle located nearby, with the right 234
proportion of water vapor. The mixing is done by means of a mass flow controller and a vapor 235
humidifier. The properties of the moist air were measured in the hermetic cells by the means of 236
temperature and humidity sensors: a Pt100 thermometer accurate to within ±0.2°C measured the 237
dry bulb temperature and a dew point sensor accurate to within ±0.5% RH was used to determine 238
the effective relative humidity. Finally, the whole device was placed in a small climatic chamber (50 x 239
50 x 75 cm3) to minimize the influence of the environment (see Figure 2). The device was placed in a
240
room where the temperature was maintained at 21°C. Because of the very high sensitivity of the 241
microbalance to vibrations, all other apparatus were removed from the room or turned off during 242
the tests. 243
244
Figure 2 – Schematic representation of the Dynamic Vapor Sorption system 245
13
2.2.2.
Procedures
246
Unlike for the SSS technique, there is no standard dedicated to the measurement of the sorption 247
isotherm with the DVS technique. Because of the very small mass of the sample, mass stabilization 248
was presumed to be obtained in less than 24 hours at each relative humidity step. Consequently, it 249
would be pointless to apply the recommendation of the standards concerning the SSS technique and 250
another criterion for mass stabilization had to be defined for the DVS technique. 251
Contrarily to the SSS technique for which no control was done on the air flow rate, a constant rate of 252
0.2 L/min with a pressure of 1.5 bars was applied here leading to a uniform absorption over the 253
surface of the sample. These are the default values proposed by the manufacturer and their 254
influence was not investigated in this study. The device is fully automated and two options were 255
available: the first one consisted in setting a time for the sample to be exposed to constant 256
conditions (for example, 6 hours). The second option was to define a mass variation criterion, 257
referred to as “dm/dt” (for example 10-4 percent of mass change per minute, noted %.min-1).
258
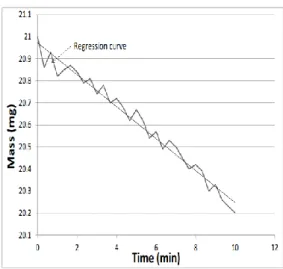
According to the manufacturer, the mass variation criterion is defined as follows: 259 (3)
2 2 60
t t M m t m t M dt dm 260Equation (3) is derived from the exact expression for the fit of a linear equation on M points and 261
gives the slope, as shown in Figure 3. Here, the calculation is performed using a 5 min window with 262
15 points (i.e. one point every 20 seconds). The factor “60” intervenes to convert the result into 263
minutes. Once this criterion is met over a 10 minute period, the mass is considered as stabilized. 264
14 265
Figure 3 – Illustration of the calculation of the dm/dt criterion 266
The second option seemed to be more relevant because the time needed for the mass to stabilize is 267
not known a priori. Additionally, results will depend strongly on the value used for mass stabilization. 268
Here, it should be observed that this technical specificity is not systematically mentioned in the 269
papers reviewed but the following figures could be extracted: 2.10-3 %.min-1 in [21], 5.10-4 %.min-1 in
270
[26], 4.10-5 %.min-1 in [22], and 10-4 %.min-1 in [33]. The last value corresponds to the default value
271
proposed by the manufacturer and is very close to the mass variation criterion proposed in the 272
standard for the SSS technique (see section 2.1.2 - a simple conversion gives 8.10-5 %.min-1). Finally, a
273
good compromise between duration and accuracy was obtained with this value as it was shown by a 274
previous study on the dry mass (not presented in this paper) on the sensitivity of the results with the 275
mass variation criterion. By extension, this criterion was also applied for the sorption isotherm 276
measurement. 277
For the dry mass determination, all the samples were stored in a ventilated oven at 50°C as in the SSS 278
technique. With the DVS technique, however, samples can be exposed to dry air (nitrogen), which 279
should remove additional water from the material. Before the sorption isotherm was measured, 280
samples were exposed to dry air flowing at a constant rate of 0.2 L/min with a pressure of 1.5 bars. 281
The nitrogen was heated to 50°C and the exposure lasted 45 min. After this period, samples were 282
15 progressively cooled down to 23°C, before being exposed to moist air. This duration was based on 283
the results of earlier experiments, where it was observed that a longer exposure did not lead to any 284
significant mass decrease (approximately 0.05 mg loss for 1 hour). The time interval between the 285
measurements is not explicitly given by the manufacturer as the value of dm/dt is calculated with 286
numerous points (Figure 3) that are stored in a temporary buffer holding points but not saved in a 287
file. This supposes a high number of points so that the estimated value of dm/dt is correct. The latter 288
is given every minute. 289
3.
Evaluation of the experimental uncertainties
290
Usually, two kinds of uncertainties are distinguished: random or A-type uncertainty (uA) and
291
systematic or B-type uncertainty (uB). uA represents the dispersion of the results from one
292
experiment to another while uB derives from the known accuracy of the different elements of the
293
measuring process. The extended uncertainty U is defined as the combination of these two, given by 294 (4): 295 (4) 2 2 B A u u k U 296
A careful reading of the theoretical background of uncertainty calculations ([12]) shows that they rely 297
on the assumption of normally distributed measurements, which is the most common case. One 298
interesting consequence is that the extended uncertainty can be interpreted as a confidence interval 299
of 68.3% or 95.4% depending on whether k is equal to 1 or 2 respectively. Therefore, it is necessary 300
to perform a statistical test to verify that the measurements are normally distributed and thus that 301
the uncertainty calculations are valid. In the literature, several normality tests have already been 302
presented and compared. Some of the most famous (Chi², Geary, Agostino, Kolmogorov-Lilliefors, 303
and Shapiro-Wilk tests) are mentioned in [34]. The sensitivity of these tests to the number of samples 304
is evaluated in [35] for normal laws. For a small number of samples, which is our case, the Shapiro-305
16 Wilk test was found to be the most robust, a result confirmed by [36]. As this test can be easily 306
achieved by using tables available in [37] , it was chosen for this paper. 307
3.1.
Uncertainty on moisture content obtained with SSS
308
For the SSS technique, the water content of the materials is obtained as follows: 309 (5) h SSS m m m m w 0 0 310
This means that a single value of the water content requires at least 3 different mass measurements. 311
Assuming a normal distribution of the results, the random uncertainty on the mean value
u
A
w is312 defined as follows [12]: 313 (6)
N
u
A w
314uB takes account of the influence of every parameter used to calculate w. As mentioned above, 3
315
measurements are needed to determine the mass content. uB is obtained by summing the partial
316
derivatives of each parameter: 317 (7)
i i i Bu
x
x
w
w
u
2 318Applying this equation to our case leads to: 319 (8)
2 2 0 0 2 0 2 0 2 0 , 1 B h h B h h B h SSS B u m m m m m m u m m m m m u m m w u 320As the mass varies from one sample to another, so does the systematic uncertainty. Therefore, the 321
calculation has to be repeated for each sample and each relative humidity value. 322
17 The manufacturer of the balance does not indicate a systematic uncertainty. Instead, two 323
uncertainties are mentioned: 324
Display resolution (uDisp): characterizes the smallest increment of weight that the numerical
325
display can indicate; 326
Linearity (uLin): characterizes the ability of the balance to follow a linear relationship between
327
the weight on the balance and the value displayed on the screen. This uncertainty was 328
applied twice: once for taring and once for the measurement. 329
With no information on the distribution associated with these uncertainties, a rectangular 330
distribution (or equiprobable distribution) was assumed. The standard deviation corresponding to 331
such a distribution is obtained by dividing the uncertainty by the square root of 3 (which is higher 332
than with a normal distribution). Consequently, the uB value was calculated as follows:
333 (9)
2 2 2 ,3
2
3
Disp Lin SSS Bu
u
m
u
334The same scale was used to measure m and m0 but a different one was used for mh for practical
335
reasons. Finally, the extended uncertainty was obtained as follows (10): 336 (10)
B
h h B h h hm
u
m
m
m
m
m
u
m
m
m
m
m
m
N
k
U
2 2 2 0 0 2 2 2 0 2 0 21
3373.2.
Uncertainty on moisture content obtained with DVS
338
For the DVS technique, the sample holder was already positioned on the microbalance to set the 339
tare. Consequently, the water content of the materials was obtained as follows: 340
18 (11) 0 0 m m m wDVS 341
Unlike the SSS technique, the DVS method allows tests to be run for one sample at a time. Moreover, 342
this sample is relatively small, which raises questions about its representativeness. In this work, this 343
problem was handled through repeatability and reproducibility tests. These tests are proposed in the 344
NF ISO 5725 standard [38] and by other standardization organizations such as ASTM (ASTM C1699-09 345
standard [39]). 346
Repeatability is defined as the observed variation of the results provided by successive tests achieved 347
under identical conditions (same device, operator, sample, method and environmental conditions). 348
The tests were performed with a single sample having a mass of approximately 20 mg. The same 349
protocol for measuring the sorption isotherm was repeated five times: the procedure for drying was 350
included (see 2.2.2) in order to have the same initial conditions (dry mass) for all the 5 tests. 351
The value of uA was obtained with equation (6) by considering N=5. The value of uB was determined
352
using equation (7). Here, uB(m) was explicitly stated by the manufacturer, so there was no need to
353
distinguish the uncertainty of the display resolution from linearity. Consequently, uB was calculated
354 using equation (12): 355 (12)
u
m
m
m
m
w
u
BDVS B2,DVS 2 2 0 2 0 ,1
356Finally, the extended uncertainty was obtained by applying a quadratic sum as in (4). 357
Reproducibility is defined as the observed variation of the results when the conditions of the tests 358
vary within an acceptable range (meaning that these conditions may be reasonably obtained during 359
testing). In our case, the methodology, the device and the environment remained the same from one 360
test to another. However, it seemed reasonable to assume that the sampling from a large bag of 361
straw and the preparation of samples by the operator may have an influence on the result. Here, 10 362
19 straw samples weighing between 19 and 24 mg were prepared by four different operators and tested 363
with the DVS technique. The uncertainty calculation was determined in the same way as for 364
repeatability. 365
In this study, repeatability tests aimed to evaluate the accuracy of the device and the reliability of the 366
experimental protocol, while reproducibility tests aimed to assess the representativeness of the 367
samples and the influence of the operator. If the uncertainty calculated from the repeatability tests 368
was of the same magnitude as the device accuracy, it gave confidence in the experimental 369
procedure. If the results obtained from the reproducibility tests were similar, this meant that the 370
sample was representative and the operator had no influence on the measurement. 371
4.
Material and sample preparation
372
The work presented in this paper was carried out in the framework of a larger project focusing on 373
earth and bio-based materials ([1], [40], [41], [42]). Preliminary tests were conducted on 4 different 374
materials, which were selected because of their presumed high sorption capacity and high risk for 375
mold growth, namely unfired clay, barley straw, hemp shiv and corncob. Early results (not presented 376
in this paper) showed that the highest adsorption levels were obtained with barley straw. It was also 377
observed that the mass stabilization was obtained faster for this material than for the others, which 378
suggested high vapor permeability. In this work, only one material was chosen as it was decided to 379
focus on the experimental procedure and the comparison between the DVS and SSS techniques 380
rather than on the material. 381
Therefore, barely straw appeared to suit the purposes of this study. First, a high sorption level should 382
lead to increased accuracy, as the ratio of mass content to systematic uncertainty would be higher. 383
Second, a fast mass stabilization means that the time needed for a single experiment is reduced, 384
which allows more ambitious experimental campaigns to be planned. In addition, straw samples can 385
be easily prepared to fit into holders of different sizes and shapes and, unlike the situation for 386
20 powders, it is easier to notice material losses. Finally, there is renewed interest for this material as a 387
building material, in Europe at least. Some examples of buildings made of straw were reported up to 388
1921 in France [43] as a solution for rebuilding after the war, but the development of straw buildings 389
was interrupted because of World War II. The sorption property of straw was measured for the first 390
time by Hedlin in 1967 [44]. The methodology used in Hedlin’s study was equivalent to the SSS 391
technique and five types of cereal straws were considered (thatcher wheat, cypress wheat, garry 392
oats, jubilee barley and redwood flax). More than 40 years later, research on the sorption property of 393
this material is still in progress ([45], [46]). In this study, barley straw samples were supplied by 394
Calyclay, a small French company created in 2014 and specializing in straw constructions and 395
coatings on straw support. 396
As building materials, bio-based materials like straw have gained popularity in the civil engineering 397
field over the last decades. The fact that they are renewable, carbon neutral and low in 398
environmental impact make them attractive [40]. Moreover, straw can be used to strengthen and/or 399
lighten earthen construction materials [48]. Recent studies reported the use of barley straw to 400
enhance the thermal insulation of plaster as presented in [49]. In [50], it was highlighted that straw is 401
an excellent hydric regulator which may improve the hygrothermal comfort in buildings. These 402
statements were confirmed and strengthened through a numerical modelling of the hygric response 403
of a small room in [47]. According to [50], it can also slow carbonation of the binder matrix due to its 404
property to make the environment more basic. 405
The straw was cut into 3 mm strands by means of triple-bladed scissors. This was done to ensure that 406
the samples fit into the holders for both techniques. For the SSS technique, the straw strands were 407
placed in a strainer of dimensions 2.5 x 6 cm² as illustrated in Figure 4. To avoid the loss of material 408
through the mesh of the strainer, it was placed in suspension in a plastic box. Aluminium wedges 409
were used to hold the strainer in place. For the DVS technique, all the samples were placed in a 410
21 hemispheric holder made of quartz (see Figure 4). The shape of this holder was selected because it 411
prevented the strands from being removed by the gas flux. 412
413
Figure 4 - Sample holder used with the SSS technique (left) and with the DVS technique (right) 414
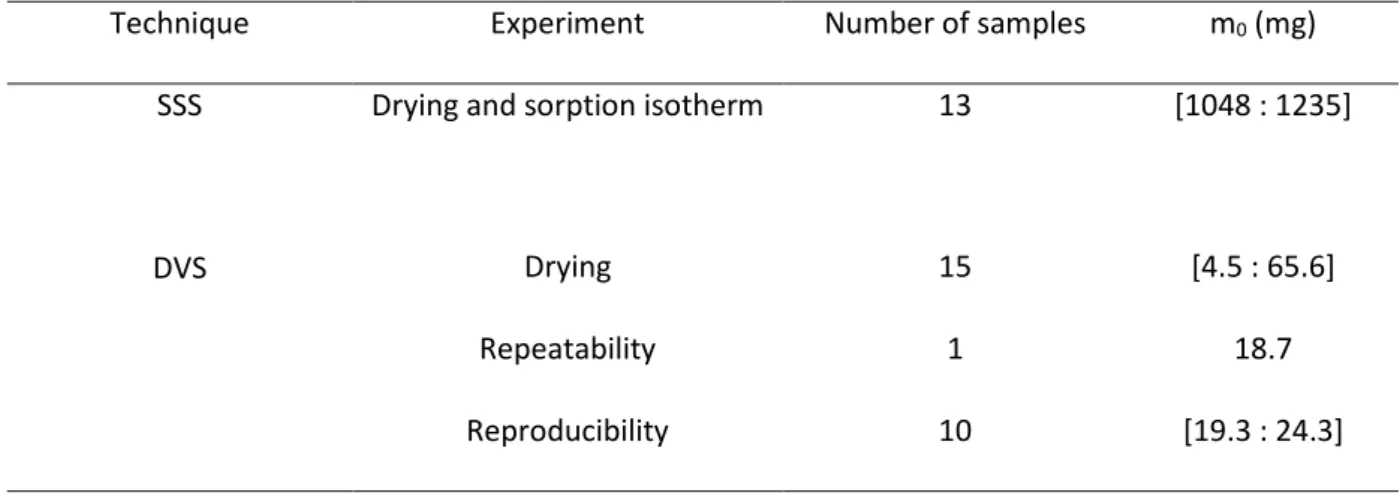
The number and dry masses of the samples used in this study are reported in Table 3. It should be 415
noted that the weight of the samples used with the SSS technique was 50 times higher than with the 416
DVS technique. This illustrates the main difference between the two techniques: faster mass 417
stabilization is obtained with the DVS technique, but it might lead to representativeness issues. 418
Second, although the DVS system can handle samples weighing up to 10 g, lighter samples were used 419
here because of the size of the holder. 420
421
Table 3 – Samples used for the different experiments 422
Technique Experiment Number of samples m0 (mg)
SSS Drying and sorption isotherm 13 [1048 : 1235]
DVS Drying 15 [4.5 : 65.6]
Repeatability 1 18.7
22
5.
Results and discussion
423
5.1.
Dry mass
424
For the SSS technique, the dry mass was obtained after 192 hours for all the samples; values are 425
indicated in Table 3. An average mass loss of 6.1% was observed. 426
In the literature, the technique used to obtain the dry mass achieved with the DVS technique is not 427
always specified, and may be improved. Indeed, a significant drop in the sample’s mass when it was 428
submitted to 0%RH was observed in [20] on clay masonry and in [26] on earth bricks. Similar 429
behavior was found in [23] on drugs. This suggests that the sample was not completely dry. In fact, 430
the procedure presented in the standard NF EN ISO 12570 allows decreasing the relative humidity of 431
the samples to a very low level, but the theoretical dry mass cannot be obtained. Indeed, the use of 432
an oven makes it impossible to reach 0% RH, unlike with nitrogen. An oven just heats up the ambient 433
air but does not remove any water vapor from it, making it impossible for the relative humidity to 434
decrease to 0%. In this paper, we have taken sides to compare the results obtained with a well-435
established method (the SSS technique) with the DVS technique. Therefore, we decided to 436
scrupulously apply the standard with the SSS technique so that the samples were placed in an oven 437
only. More precise results would have been expected if samples were exposed to nitrogen, but we 438
assumed that this would not have been representative of the usual SSS technique. For the DVS 439
technique, the samples were additionally exposed to dry air for 1 hour as already mentioned in 440
section 2.2.2. Thus, an average mass loss of 7.6% was observed for the samples with DVS. As 441
explained above, this result was expected. 442
As mentioned in section 2.1.1., the influence of the dry mass determination method has already 443
been underlined by others ([11], [24], [26]), yet this influence is hard to analyze. For example, 444
Peuhkuri et al. [24] showed that there was no significant difference between the results obtained 445
with cellulose samples dried at 20°C and 70°C, but sizeable differences were obtained for cellular 446
23 concrete. On the other hand, a shift between the sorption isotherms measured with both techniques 447
was observed in [26] for earth bricks. The debate on the determination of the dry mass is ongoing 448
but it is not specific to the SSS or the DVS technique. Therefore, the study of the influence of the dry 449
mass is slightly out of the scope of this paper. We will simply recall that the DVS system offers an 450
interesting opportunity to get closer to the theoretical value of the dry mass by using nitrogen. 451
Consequently, higher moisture content should be measured with the DVS technique. 452
5.2.
Water content measured with the SSS technique
453
The results for the 13 barley straw samples are presented in Table 4. The whole experiment lasted 4 454
months and 9 days. According to the Shapiro-Wilk test, the values of the water content were found 455
to be normally distributed except for the last relative humidity step (94% RH). 456
For this last value, mold growth was observed with the naked eye before the mass had stabilized. 457
According to [51], there is a moderate risk of mold growth on wheat straw at 20°C and 75% RH, but 458
mold growth is to be expected at higher relative humidity. In [52], it was stated that the 459
development of mold is conditioned by the relative humidity of the environment rather than by the 460
moisture content of the materials. In [8], visible mold growth was also observed at 93.6% RH on food 461
materials. For this reason, it was presumed that repeating the experiment at 94% RH would 462
systematically lead to mold growth, meaning that the SSS technique was not relevant at high 463
humidity for materials like straw. The last measurement obtained before mold growth was achieved 464
after one week of exposure. It was observed that the time needed for mass stabilization increased 465
with relative humidity. As stabilization took almost one month at 75.4% RH, the value of the water 466
content at 94% RH was probably not representative of the stabilized mass. However, it was also 467
observed that 97% of the mass variation between 63.2% RH and 75.4% RH was achieved within the 468
first week. So the magnitude of the last measurement, obtained at 94% RH, should be correct. It was 469
therefore used in this study. 470
24 Table 4 – Mean value and uncertainties obtained with the SSS technique
471
472
It was observed that the extended uncertainty U was generally dominated by the uA value, which
473
increased with the relative humidity. This led to a significant increase in the discrepancy of the 474
results at high relative humidity. Such a result has already been observed by other researchers for a 475
wide range of materials ([13], [18], [27], [41]). Several reasons were listed in [9], from the purity of 476
the salts to the value chosen to define mass stabilization. Another interesting reason, mentioned in 477
[11], is that the uncertainty on the RH of the salt solution has a much more significant effect for high 478
values of RH because of the asymptotic behavior of the sorption isotherm. Still, the SSS technique is 479
currently the only standardized method for obtaining a given value of relative humidity, in the field of 480
civil engineering at least. Therefore, it can be concluded that the increase of the uncertainty at high 481
relative humidity is not specific to straw and did not result from negligence in the experimental work. 482
It is inherent in the SSS technique. 483
It should be mentioned that the normal distribution is a limiting distribution, meaning that it can be 484
obtained for a very high number of samples only. When there are less than 20 samples, the 485
estimated standard deviation may be underestimated. More reliable results could be obtained by 486
considering a Student’s distribution [54]. However, this technique relies on the assumption that uB
487
values are significantly lower than uA values. As it was not clear whether the difference between the
488
two values was significant here or not, the uncertainty calculation was repeated using this second 489 Relative Humidity (%) 7.6 22.2 43.2 63.2 75.4 94.0 μw (kgV.kg-1) 1.44 3.73 5.94 9.78 11.77 21.78 uA ( kgV.kg-1) 0.03 0.05 0.09 0.12 0.18 0.63 uB ( kgV.kg-1) 0.02 0.02 0.03 0.03 0.03 0.05 U ( kgV.kg-1) (k=2) 0.1 0.1 0.2 0.3 0.4 1
25 approach. The values obtained for the extended uncertainty U were the same, indicating that the 490
first approach was valid. 491
5.3.
Water content measured with the DVS technique
492
A first test was conducted using 20 steps in relative humidity (from 0 to 90% in steps of 5%, plus one 493
point at 93%) and taking the default value of the mass variation criterion (10-4 %.min-1). Results are
494
presented in Figure 5. 495
496
Figure 5 - Mass variation of straw with time and relative humidity for a criterion value of 10-4 497
%.min-1 498
It took 180 hours to determine the whole sorption isotherm and the time required for the mass 499
stabilization criteria to be satisfied was observed to increase significantly with relative humidity: the 500
mass stabilized in less than 6h between 0 and 50% RH, in 6 to 12h between 50 and 75% RH and in up 501
to 29 h at 93% RH. This trend is similar to the one observed in [20] on unfired clay. In that study, 502
however, the device automatically stepped to the next value of relative humidity if mass stabilization 503
was not obtained after 6 hours. This corresponds to the default setting proposed by the 504
manufacturer. Results presented in Figure 5 clearly show that more accurate results can be obtained 505
by considering the mass variation criterion only. 506
26 The mass variation criterion used here (10-4 %.min-1) strongly depends on the kinetic of absorption of
507
the material as its calculation on a 10 min window could be too short. Furthermore, the material 508
could not absorb enough water to notice a significant mass change during the calculation window. 509
Accurate results were obtained on barley straw, but this criterion might not be precise enough for 510
other materials. However, this limitation also occurs for the SSS technique. 511
5.3.1.
Repeatability tests
512
The repeatability tests were carried out for a reduced number of relative humidity steps (9, 33, 55, 513
76, and 93%). These values were selected to be in agreement with typical values obtained with 514
saturated salt solutions. They do not correspond to the ones presented in Table 4 because some late 515
amendments had to be made with the SSS technique. 516
For the first three tests, exactly the same dry mass was obtained (18.74 mg). However, for the last 517
two tests, a slight increase was observed (+0.04 mg), which was higher than the balance uncertainty 518
(± 0.01 mg) but represented a mass variation of only 0.02%. This result raises some questions. If the 519
procedure applied for drying was biased, different values for the dry mass should have been 520
obtained because of the exposure to very high relative humidity (93% RH). However, this was not 521
observed for the first three tests. 522
To compare the results from these five experiments, the same value for dry mass, e.g. the minimum 523
of the mass for all of the experiments, was defined. The Shapiro-Wilk normality test was successfully 524
applied to the measurements, indicating that the values were normally distributed. The mean water 525
content μW and its uncertainty are presented in
27 Table 5 for all relative humidity steps.
527 528
28 Table 5 – Mean value and uncertainty obtained for the repeatability tests
529
530
The extended uncertainties are quite small with respect to the water content: the ratio between 531
these two values ranges from 1 to 9% (for 93% RH and 9% RH respectively). Moreover, the global 532
uncertainty is dominated by uB, except for the last relative humidity step, where uA and uB have the
533
same magnitude. This result is in accordance with the one obtained with the SSS technique. 534
Therefore, it can be concluded that an excellent repeatability was obtained for the measurement of 535
the sorption isotherm of straw, meaning that the procedure is valid. 536
5.3.1.
Reproducibility tests
537
The Shapiro-Wilk normality test was also successfully applied to the measurements. The results are 538
shown in Table 6. Note that the values selected for relative humidity were slightly different from the 539
ones used in Table 5. 540
Table 6 – Mean values and uncertainties obtained for the reproducibility test 541 Relative Humidity (%) 10 30 50 75 93 μw (kgV.kg-1) 2.1 4.4 7.3 12.4 21.6 uA (kgV.kg-1) 0.06 0.12 0.09 0.11 0.22 uB (kgV.kg-1) 0.08 0.08 0.08 0.09 0.09 U (kgV.kg-1) (k=2) 0.2 0.3 0.3 0.3 0.5 542 Relative Humidity (%) 9 33 55 76 93 μw (kgV.kg-1) 2.3 5.9 9.1 13.3 20.9 uA (kgV.kg-1) 0.03 0.03 0.04 0.04 0.08 uB (kgV.kg-1) 0.08 0.09 0.09 0.09 0.09 U (kgV.kg-1) (k=2) 0.2 0.2 0.2 0.2 0.2
29 uB values are very close to those obtained during the repeatability tests as they depend only slightly
543
on the mass of the sample. However, uA has significantly increased compared to the values obtained
544
for the repeatability tests (see 545
30 Table 5), and is now of the same magnitude as uB. It is logical for higher uncertainties to be observed
546
with reproducibility tests than with repeatability tests because additional sources of uncertainty 547
were introduced (the operator and the sampling of the material). However, the increase of uA does
548
not significantly influence the extended uncertainty, U, because of the quadratic sum (see (4)) and 549
the observed excellent repeatability. This indicates that a straw sample of 20 mg is representative 550
and that the influence of the operator and the samples has a limited impact on the results. 551
One notable exception concerns the highest relative humidity (93%) where uA is more than twice as
552
high as uB, leading to an extended uncertainty of ±0.5 kgV.kg-1. This trend is similar to the one
553
observed with the SSS technique, which strengthens the idea that it is very hard to obtain 554
reproducible high relative humidity values. However, it can be seen that the random uncertainties 555
obtained here are higher than those obtained with the SSS technique for relative humidity below 556
50%. The inverse tendency is observed for relative humidity above 50%. Finally, it is important to 557
note that all the experiments were performed in the same laboratory. Therefore, the same method 558
and device were used in roughly the same environment. However, Feng et al. [14] mentioned that 559
the biggest disparities were found when comparing results from different laboratories. This 560
parameter was not investigated in the present work. 561
5.4.
Comparison of the measurements obtained with the two techniques
562
The sorption isotherm obtained from the reproducibility tests with the DVS technique is compared 563
with the one obtained from the SSS technique in Figure 6. It should be observed that all the 564
isotherms were plotted by assuming that the water content was equal to 0% when the relative 565
humidity was equal to 0%. However, the dry mass obtained with the SSS technique might be 566
overestimated because of the ventilated oven, as mentioned in section 5.1. Also, Figure 6 compares 567
the present results with the ones obtained in 1967 by [55] on five types of grain straws. Higher RH 568
values were used in [55] (up to 99%), which resulted in a measured water content higher than 569
31 1 kgV.kg-1. For readability purposes, water contents have been plotted for relative humidity values up
570
to 94% RH , as this corresponds to the highest value measured in our study. 571
572
Figure 6 - Comparison of the isotherm measured with the two techniques and from Hedlin [55] 573
First, it was observed that the sorption values measured here were lower than the ones obtained in 574
[55], where jubilee barely straw was considered. However, no significant difference was observed 575
over the five types of straw in [55] for the lowest values of relative humidity: the maximum 576
difference of the water content was 0.3 kgV.kg-1 at 10% RH while the average difference was
577
1.1 kgV.kg-1 with the measurements made in our study. The influence of the type of straw was more
578
significant at higher relative humidity, but the difference with the measurements achieved here is 579
still noticeable. This raises questions on the reliability of the measured sorption values for general 580
calculation purposes. Straw is generally obtained directly from crops: its composition is not well-581
known or controlled as may be the case for other construction materials. Therefore, it should be kept 582
in mind that the low dispersion of the experimental results presented in this paper is not 583
representative of the presumed variability of the real material. 584
Focusing on the measurements made in the present study, it can be observed that the results are 585
very similar with both techniques, yet some differences can be observed. First, the moisture content 586
32 obtained with the DVS technique is slightly higher than the one obtained with SSS, although this 587
difference is within the order of magnitude of the measurement uncertainty. This result was 588
expected: because of the better drying of the samples with the DVS technique, the moisture content 589
measurement was expected to be higher. Second, the uncertainty was significantly higher at high 590
relative humidity for both techniques, as a result of a higher dispersion of the values (uA). A similar
591
phenomenon was identified in the literature for wood-based products [30], cob [53] and cereal straw 592
([21], [46], [55]). Here, the same mass variation criterion was used for each relative humidity step 593
with both techniques. This criterion may not be robust enough for high values of relative humidity 594
and may need to be reconsidered. This is also mentioned in [20] and [33]. Moreover, the slope of the 595
sorption isotherm is steep at high relative humidity. As a result, a small difference in the relative 596
humidity leads to a significant difference in the moisture content. Consequently, the uncertainty in 597
relative humidity may be too great to allow a precise comparison as underlined in [21]. Other 598
techniques can be used at high relative humidity, such as pressure plate, tension plate or pressure 599
membrane but cannot be used as replacement for the DVS and SSS as they are typically desorption 600
measurements. 601
Another issue is the development of mold at high relative humidity. As mentioned above, mold 602
growth was observed on straw samples for the SSS technique at 94% RH after one week of exposure 603
even though the boxes used to store the samples during the experiment were previously cleaned 604
with a product containing bleach. This was not done with the DVS technique. The reason is probably 605
that the time required for mass stabilization was shorter (approximately 30 hours) and there was a 606
lack of oxygen (samples were exposed to a mixture of only nitrogen and water vapor). In 607
consequence, it would be preferable to use the DVS technique at high values of relative humidity for 608
materials sensitive to mold growth. 609
33
5.5.
Comparison of the sorption curves
610
The standard NF EN ISO 12571 imposes at least 5 different relative humidity steps to measure a 611
sorption isotherm. However, 5 points may be insufficient, especially as the sorption isotherm is non-612
linear. This is why sorption isotherm models are needed. In our case, this would also ease the 613
comparison between the results obtained with the two techniques because different relative 614
humidity steps were used. 615
However, many models can be found in the literature. Here, we aim to compare the results obtained 616
with 13 models in order to choose the most appropriate for barley straw. All the equations are given 617
in Table 8 (see Appendix). The comparison relies on the calculated value of the “adjusted R-squared” 618
coefficient, the definition of which is very close to that of the widespread indicator R², except that it 619
includes the number of fitting parameters. This coefficient will allow the models to be compared and 620
the most accurate to be selected. The adjusted R-squared is defined as: 621 (13)
1
1
1
1
2 2
q
n
n
R
R
622The adjusted R-squared was calculated on sorption isotherms obtained by the DVS and the SSS 623
methods. Hence, the number of points, n, was set to 5 for the first method and 6 for the second. The 624
value of R remained between 0 and 1, where 1 corresponds to a perfect correlation and 0 to a total 625
dispersion between the model and the experimental curve. The fitted coefficients were obtained by 626
minimization of least squares applied to a point cloud [56]. In our case, best results were obtained 627
with the GAB model (quoted in [57]) (Fig. 8, see Appendix) as the determination coefficient was 628
equal to 0.9986 with measurements obtained with the DVS system and 0.9978 for those obtained 629
with the SSS technique. It is defined as follows: 630
34 (14)
W
mC
C
C
C
C
C
w
2 1 2 2 2 11
1
631Wm is a physical parameter based on Langmuir’s theory [58], which corresponds to the water content
632
when water molecules have covered the solid surface with a unimolecular layer. It was considered 633
here as a fitting parameter, the values of which remain between 0 and 0.1. The predominance of the 634
GAB model has already been observed by other authors. It was used in [59] for bentonite, in [53] 635
with cob and in [60] for clay. Moreover, a comparison made in [53] with the BET model and [59] with 636
the Henderson model, ranked GAB as the best fitting model. The values of the fitting parameters for 637
both techniques are given in Table 7. 638
Table 7 - Fitted parameters for GAB model 639
640
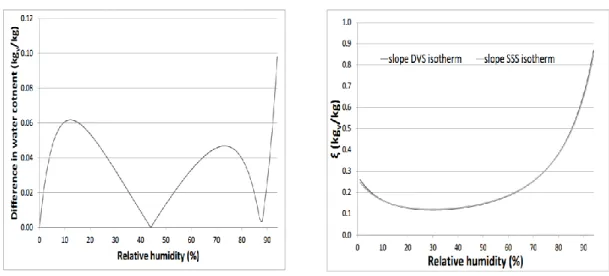
As the fitted parameters are very close, so are the sorption curves. For ease of comparison, it was 641
preferred to plot the difference between the calculated water content, as presented in Figure 7a. It 642
can be observed that the difference between the two isotherms is lower than 0.1 kgV.kg-1 over the
643
whole range of relative humidity used in this study. This means that the difference between the 644
results is lower than the measurement uncertainty, leading to the conclusion that the results are 645
independent of the method. 646
As mentioned in Section 1, the slope of the sorption isotherms are used in HAM models to compute 647
mass balance (see equation (1)). For this reason, the two slopes are compared in Figure 7b. Note that 648
Fitting parameters DVS SSS
C1 6.310 5.862
C2 0.831 0.825
35 the difference is very small (less than 0.1 kgV.kg-1), so the influence on the simulation results should
649
not be significant. 650
651
Figure 7 – 7a (left) Difference between water contents calculated by DVS and SSS, 7b (right) Slope 652
of the sorption isotherm measured with both techniques 653
To sum up, the results obtained with the DVS technique are the same as the ones obtained with the 654
SSS technique for barely straw: the differences between the two sorption curves were within the 655
uncertainty range. At high relative humidity, however, mold growth was observed with the SSS 656
technique, which led to the interruption of the experiment before its end. This did not happen with 657
the DVS technique, probably because of the shorter time of exposure and the absence of oxygen. 658
Nevertheless, it was acknowledged that the uncertainty increased with both techniques at such high 659
values of relative humidity. Therefore, it can be concluded that the DVS technique constitutes a good 660
alternative to the SSS technique for homogeneous materials such as straw. This statement applies 661
within the hygroscopic range only and the measurements are less reliable for high values of relative 662
humidity, as mentioned above. 663
Finally, it can be added that the operational costs were slightly lower for the DVS than for the SSS 664
technique. Indeed, all the experiments with the DVS (meaning the 20 points isotherms, 5 665
36 repeatability tests and 9 reproducibility tests) have consumed 3 nitrogen bottles. Each bottle has a 666
capacity of 9.4 m3 of gas and costs approximately 40 €, meaning 120 € for all the experiments. For
667
the SSS technique, the preparation of the solutions costed a bit less than 500 €, as shown on Table 2, 668
but the salts can be reused. While the operational cost of a DVS device is cheaper than preparing 669
saturated salt solutions, it is a considerable investment since the whole device costs around 75k€. 670
6.
Conclusion
671
An experimental comparison between two sorption isotherm measurement techniques (SSS and DVS 672
techniques) was proposed in this paper. The SSS method was achieved as described by standards NF 673
EN ISO 12570 and NF EN ISO 12571. As no standard exists for the DVS method, a specific protocol 674
was proposed for obtaining the dry state and the sorption isotherm. All the experiments were carried 675
out on a barley straw. The comparison was achieved thanks to the evaluation of the uncertainties. 676
Firstly, DVS gave excellent results for repeatability and reproducibility, validating the procedure and 677
proving that the straw sample was representative. The sorption isotherm measured with the DVS 678
technique was very close to the one measured with the SSS technique, the difference being lower 679
than 0.1%. The SSS method led to greater disparities in the measurements at humidity above 50%, 680
due to the impact of many factors inherent in the protocol, while the DVS method did not use them. 681
In DVS, the sample was confined in a climatic chamber and the measurements were automated. 682
Hence the environment had less influence and the impact of the operator was negligible. In contrast, 683
the SSS method seemed to perform better for relative humidities below 50%. To continue, the DVS 684
technique was much faster than the SSS technique because of the relatively small size of the sample 685
tested and the dynamic nature of the experiment. Its speed could be advantageous for 686
measurements on bio-based materials since a shorter exposure of the sample to high relative 687
humidity prevented the development of mold. 688


![Figure 6 - Comparison of the isotherm measured with the two techniques and from Hedlin [55]](https://thumb-eu.123doks.com/thumbv2/123doknet/14504846.528575/32.892.304.589.223.493/figure-comparison-isotherm-measured-techniques-hedlin.webp)