MIT Sloan School Working Paper 4743-09 8/4/2009
Cooperation Without Coordination: Influence Dynamics and the Emergence of Synchrony in Inter-Organizational Networks
© 2009 Jason P. Davis Jason P. Davis
All rights reserved. Short sections of text, not to exceed two paragraphs, may be quoted without explicit permission, provided that full credit including © notice is given to the source.
This paper also can be downloaded without charge from the Social Science Research Network Electronic Paper Collection:
i
COOPERATION WITHOUT COORDINATION:
INFLUENCE DYNAMICS AND THE EMERGENCE OF SYNCHRONY IN INTER-ORGANIZATIONAL NETWORKS
JASON P. DAVIS
Sloan School of Management Massachusetts Institute of Technology
50 Memorial Drive, E52-545 Cambridge, MA 02139
(617) 253-6727
jasond@mit.edu
Working Paper* August 4, 2009
I am especially grateful for the insightful comments and generous support of Rebecca Henderson, Ezra Zuckerman, Roberto Fernandez, Deborah Ancona, Wanda Orlikowski, Jan Rivkin, Chris Wheat, Pai-Ling Yin, Kathleen Eisenhardt, Mark Granovetter, Riitta Katila, Christoph Zott, and seminar participants in the MIT Distributed Leadership Research Group and the BYU/Utah Strategy Conference. Support for this research was provided by MIT’s Sloan School of Management. *This paper is an early draft; please do not cite or circulate without permission.
ABSTRACT
This paper explores the emergence of synchrony in cooperative inter-organizational networks. While some research suggests that synchronizing organizational actions like product releases is a form of collective behavior that generates advantages for organizations, most existing network theory focuses on dyads and not the larger organizational groups where networked cooperation is relevant. As a result, we know a lot about resource mobilization and information diffusion across dyads, but very little about how cooperation occurs in larger networks where collective behaviors like synchrony are important. Using a simple computational model grounded in prior research on inter-organizational networks, this paper develops a theoretical framework linking temporal dynamics to network theory that sheds light on the emergence of synchrony, why it emerges faster in some networks than others, and how organizations can shape synchrony to their own advantage. Specifically, I find that
synchrony emerges from influence across network ties without the need for a central coordinator or exogenous technology cycle. It emerges though a series of cooptation events across network ties wherein social influence accumulates to synchronize some organizations with others. The magnitude and time to reach synchrony varies predictably with features of network structure such as network size (N), mean degree (K), and tie strength (e), although an unexpected finding is that clustering (CC) diminishes synchrony by generating coalitions with rhythms that vary too widely. These dependencies can be understood with reference to three mechanisms – accelerated, coalitional, and conflicting influence – that shape cooptation dynamics. Finally, intentional coordination across
inter-organizational relationships accelerates the time to synchronize the entire network, creating temporal spillovers to non-coordinating organizations; moreover, coordinating organizations benefit from increased synchrony performance – i.e., they increase the relative likelihood that network
synchronization tips to their own underlying rhythm. The magnitude of this performance advantage depends on network size (N) and mean degree (K), but not on tie strength (e) or clustering (CC).
How do organizations cooperate? While most research on this question focuses on relationships between pairs of organizations, less has examined cooperation in larger organizational groups. Diverse groups of organizations appear to cooperate in pursuit of common objectives. Business groups lobby the government for preferential regulation (Ingram and Rao, 2004; Granovetter, 2005), social movement organizations mobilize activists to change society (McCarthy and Zald, 1977; McAdam, 1982), and high-technology firms build complicated product platforms using common technology standards (Browning, et al., 1995; Bresnahan and Greenstein, 1999). The focus of existing theory on dyadic cooperation has yielded valuable understanding of resource mobilization and information diffusion across various inter-organizational relationships including exchange alliances (Dyer and Singh, 1998; Gulati, 2007), R&D collaborations (Powell, et al., 1996; Ahuja, 2000), and endorsement arrangements (Baum and Oliver, 1991; Stuart, et al., 1999), but surprisingly little about the ways in which multiple interdependent organizations pursue common objectives in a timely fashion.
I begin with the observation that whether in business groups, social movements, or technology platforms, many organizations participate in a networked organizational form that enables cooperation in their organizational fields (Powell, 1990; Podolny and Page, 1998; Granovetter, 2005). This paper explores the temporal processes underlying networked cooperation, focusing on the synchronization of organizational actions as an essential aspect of collective behavior in inter-organizational networks. Defined as the process that enables multiple organizations to generate simultaneous actions,
synchronization ensures that the actions are perceived as unified by relevant stakeholders in the organizational environment.
To illustrate, consider the organizational networks responsible for creating information
technology platforms. A central insight of this literature is that competition occurs between groups of organizations committed to different platforms such as Wintel and Macintosh in the personal computer market or iPhone and Blackberry in the smartphone market (Bresnahan and Greenstein, 1999; Gawer
and Henderson, 2007). As a result, organizational performance depends not only on the quality of an organization’s own products (Clark and Fujimoto, 1991; Brown and Eisenhardt, 1995) or their
complementarity to other platform components (Teece, 1986; Yoffie and Kwak, 2006), but also on the effectiveness of group cooperation relative to other technology platform groups (Iansiti, 1995; Gawer and Cusumano, 2002). Groups that quickly synchronize releases of complementary products quickly can create more demand for their platform than the platforms of other groups (Milgrom, et al., 1991; Adner and Kapoor, 2006). Moreover, consistent synchronization across multiple generations of the platform creates a rhythm to which new entrants can align (Ancona and Waller, 2007; Gawer and
Henderson, 2007). Overall, synchronization may be an important element of networked cooperation and a critical capability of firms in highly interdependent environments.
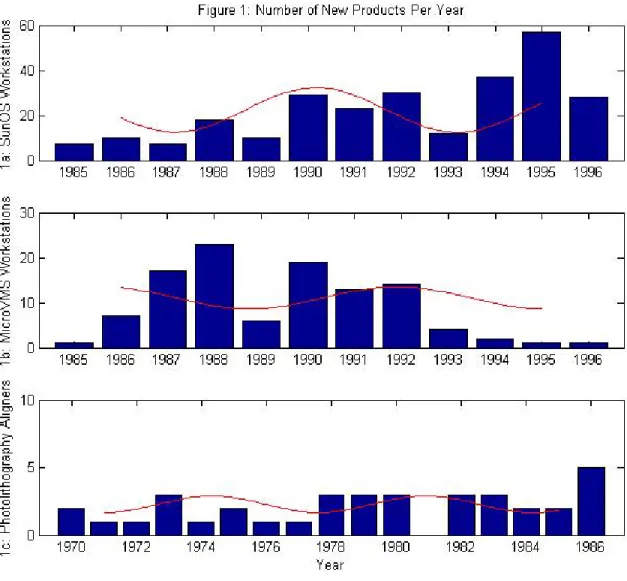
Synchrony emerges in multiple environmentsi. Consider the computer workstation sector, an environment with hundreds of product introductions on several operating system platforms (Sorenson, 2000). Figures 1a and 1b plot the total number of new product releases per year by workstation firms on the SunOS and MicroVMS operating system platforms, respectively. Over multiple years, an observed pattern of synchronization emerges within the expected bounds of the industry lifecycle (Abernathy and Utterback, 1978; Sorenson, 2003). New products are released in at least two major cycle peaks in each operating system category, as indicated by the fitted oscillating cycles. Similarly, Figure 1c plots the number of new product releases in the photolithography equipment sector that produces tools essential for circuit manufacturing (Henderson and Clark, 1990; Henderson, 1995). In comparison to workstation firms, photolithography firms exhibit less, although detectable, synchronyii. Taken together, these patterns of synchronous product introduction demand further explanation. How does synchrony emerge and why do some networks synchronize more readily than others?
There are multiple rationales for why organizations might prefer to synchronize. Economic rationales focus on organizations that produce complementary products with cross-elasticities of demand
– i.e., consumers pay more for available products when they are complementary (Milgrom, et al., 1991; Saloner and Shepard, 1995). Moreover, multi-sided markets involving different organizations working on the same platform (such as videogame consoles and software) create network externalities that can be captured by cooperating organizations if the products are simultaneously available (Rochet and Tirole, 2001; Armstrong, 2006). Social rationales focus on the perceptions of stakeholders – lobbying,
movement, and R&D efforts that are dispersed in time or weakly supported by a critical mass of relevant organizations may not meet the threshold necessary to achieve common objectives such as regulatory change (Kock and Guillen, 2001; Khanna and Yafeh, 2007), effective protest (McAdam, 1982; Davis and Greve, 1997), or technology adoption (Coleman, et al., 1966; Rogers, 1980). Yet while multiple rationales exist for when organizations prefer to synchronize, we lack insight into how synchrony actually emerges once these inducements are in place.
The central organizational puzzle is how large but sparsely connected networks become synchronized. Consider two organizations A and C that are not directly connected, but are linked through another n organizations, B1…Bn. If we assume that influence across network ties takes time,
then it is unclear how organizations communicate influence to become fully synchronized. In this stylized example, the influence from A may not reach C in time to synchronize; the influence of other nodes such as B1…Bn could mistime alignment; and the countercyclical influence of C on A could be
unproductive. In these networks, influence accumulates across all network ties in multiple directions over time, and the endogenous influence dynamics may not guarantee synchronization even if this is the preferred outcome of all organizations.
This puzzle is of interest to organization scholars because most inter-organizational network structures are only sparsely connected. Yet while few industry networks are fully clustered cliques, many of these networks do contain some highly clustered sub-groups. Geographically centralized business groups often form clusters that contain the most prominent organizations in their broader
industrial networks (Anand and Khanna, 2000; Owen-Smith and Powell, 2003; Ozcan and Eisenhardt, 2008). For example, Boston and Bay Area biotechnology firms are more clustered than similar firms in other regions and comprise the network’s main component (Owen-Smith and Powell, 2003). Existing theory suggests that densely clustered sub-networks facilitate the diffusion of information and effective search (McEvily and Zaheer, 1999; Sorenson, 2005; Fleming, et al., 2007). Moreover, dense clustering is often thought to engender a sense of belonging, trust, and risk-sharing amongst individuals in the cluster (Coleman, 1988; Portes and Sensenbrenner, 1993; Vaisey, 2007). This research has exploded with the discovery of small world network structures in many organizational contexts (Baum, et al., 2003; Davis, et al., 2003; Uzzi and Spiro, 2005; Schilling and Phelps, 2007), since small world
structures benefit from the positive effects of local clustering and the global reach of small path lengths (Watts and Strogatz, 1998; Zuckerman and Reagans, 2001). Despite considerable interest in clustering, its effect on the temporal dynamics of influence and synchrony is less well explored. Other features of network structure – size, degree, and centrality – could have other implications for the emergence of synchrony.
Additionally, the synchronization process is not necessarily uniform or stable, as illustrated by the varying degrees of product synchrony across different industrial networks (Ancona and Waller, 2007). While some fields like pharmaceuticals take a long time to synchronize and exhibit only partial synchrony, in other fields synchronization is faster and more complete. For example, new IT sectors (such as Web2.0 and Mobile Gaming) synchronize quickly, aligning organizations in a coordinated network of suppliers and complementors with each new technical generation (Gawer and Henderson, 2007; Ozcan and Eisenhardt, 2008).
Two major explanations of how synchrony emerges can be inferred from existing organizational theories. The first focuses on asymmetric resource dependence (Pfeffer and Salancik, 1978; Casciaro and Piskorski, 2005), suggesting that powerful firms are responsible for industrial synchrony. It is
possible that single firms could use their technical influence or market power to induce other firms to follow a preferred, common rhythm (Gawer and Cusumano, 2002; Lenox, 2006). For example, a powerful gaming console firm could pressure all videogame developers to synchronize their game releases with the arrival of each new generation of console hardware. The threat of incompatibility with a new generation of consoles is a strong incentive for these smaller videogame developers.
The second explanation suggests that exogenous market conditions or technology trajectories are the dominant drivers of synchronization (Dosi, 1982; Tushman and Anderson, 1986). For example, semiconductor firm strategy is shaped by Moore’s law, which describes the observed pace of processor improvements over time. These trajectories limit the rate at which new generations of microprocessors can be profitably released (Henderson, 1995). This, in turn, shapes the fundamental rhythm around which semiconductor firms synchronize. Collectively, these theories suggest that powerful firms or exogenous technology cycles are responsible for synchrony, yet provide little insight into the role of the network in the synchronization process.
Despite the seeming importance of synchrony in cooperative networks, fundamental questions about this relatively unexplored phenomenon remain unanswered. How does synchrony emerge when some organizations are not directly connected? Taken together, the literature rests on an unexpectedly common assumption that synchrony, and collective behavior more generally, is purposefully
coordinated by at least some of the member organizations (Khanna and Rivkin, 2001; Yiu, et al., 2007). Indeed, intentional coordination of temporal dynamics between pairs of organizations may contribute to synchrony, yet is intentional coordination a necessary condition of networked cooperation? There is reason to believe that intentional coordination may be too difficult or too costly to fully account for synchrony, especially when coordination is needed across long bridges that connect otherwise disconnected clusters in the organizational network (Centola and Macy, 2007; Schilling and Phelps,
2007). More broadly, why does synchrony emerge faster in some networks than others? And how can single organizations shape emergent synchrony to their own advantage?
The purpose of this paper is to understand how, when, and why synchrony emerges in cooperative inter-organizational networks. Building on prior literature about inter-organizational influence and oscillating resource dynamics at the dyadic level, I build a simple computational model of synchronization in large groups to generate insights about collective behavior at the network level. This approach enables a decoupling of cooperative effects due to repeated influence – which might
unintentionally synchronize organizations – from coordination mechanisms which organizations use to intentionally synchronize their relationships. The outcome is a theoretical framework linking temporal dynamics to network theory which sheds light on the emergence of collective behavior in organizational networks, including the role of the network in the emergence of synchrony and the advantages it
generates for different organizations.
The primary findings are theoretical insights about temporal dynamics in cooperative networks. First, in contrast to prior theory attributing synchrony either to powerful firms or exogenous technology trajectories, I find that synchrony can emerge without the need for intentional coordination. Synchrony emerges though a series of temporal cooptation events across network ties wherein some organizations influence others to become synchronized. While some features of network structure affect the
magnitude of and time to synchrony as expected, an unexpected finding is that clustering inhibits synchrony by generating organizational coalitions with conflicting rhythms, suggesting that some aspects of networked cooperation are difficult in small world networks. These findings can be understood with reference to three mechanisms – accelerated, coalitional, and conflicting influence – which shape the evolution of temporal cooptation across time.
Second, while synchrony can emerge unintentionally, intentional coordination across inter-organizational relationships accelerates the time to synchronize the network, generating temporal
spillovers to non-coordinating organizations. Coordinating organizations benefit from increased
synchrony performance, defined as a higher relative likelihood that network synchronization tips to their preferred underlying rhythm. I find that the magnitude of this performance advantage depends on some features of network structure such as density, but, counter-intuitively, not on others such as tie strength and clustering.
THEORY DEVELOPMENT
Social Influence and Resource Dynamics in Inter-Organizational Networks
Network Influence. Creating and maintaining synchronized action seems to depend upon the
relationships between organizations because such relationships are a valuable source of communication and coordination across the network. In fact, multiple theoretical traditions suggest that organizations influence each other through direct network ties. For instance, institutional analyses often focus on relationships between organizations (DiMaggio and Powell, 1983; Selznick, 1996; Scott, 2001). For instance, Selznick’s (1949) study of the Tennessee Valley Authority (TVA), a government agency created to improve economic conditions in the Tennessee Valley during the Depression era, highlights the importance of evolving relationships between groups. He describes how relationships between the TVA and local governments enabled TVA authorities to include local leaders in the decision-making process and, thus, increase local support for the TVA’s objectives. Selznick (1949) called this process cooptation –bringing in external stakeholders into the organizing process to influence them to support its objectives.
New institutional research suggests that inter-organizational relationships can influence
organizations to adopt new practices as well (Coleman, et al., 1966; Burt, 1987; Davis and Greve, 1997). For example, Davis and Greve (1997) found that, in response to a wave of hostile takeovers, most large American corporations adopted defensive practices that they learned from other connected
rates because they spread across different networks. Poison pills spread quickly through board interlock ties, whereas golden parachutes spread slowly across regional elite networks (Davis and Greve, 1997). The important point in this and other studies is that some network ties may be more influential than others (Keister, 2001; Owen-Smith and Powell, 2003; Khanna and Rivkin, 2006).
The resource dependence tradition also suggests that inter-organizational relationships shape organizational actions by influencing the resource acquisition and development processes within organizations (Pfeffer and Salancik, 1978; Casciaro and Piskorski, 2005). In this perspective, an
organization’s resources can oscillate dramatically in response to environmental demands, and managers use resource acquisition processes to buffer themselves against environmental uncertainty. These organizations use corporate venture capital or equity alliances with larger organizations to acquire needed resources to support ongoing activities (Eisenhardt and Schoonhoven, 1996; Stuart, 1998; Dushnitsky and Lenox, 2005; Rosenberger, et al., 2008). That is, the flow of resources across direct network ties can be an important source of influence causing organizations to synchronize.
Unlike the prior examples, social influence need not involve a diffusion of practices or flow of resources from one organization to another. Merely observing another organization’s actions can provide a signal that influences the focal organization’s resource dynamics (Podolny, 2001). For example, a product release by one organization can influence other organizations to accelerate product development (Eisenhardt and Tabrizi, 1995; Pacheco-de-Almeida and Zemsky, 2002) and product introduction into new markets (Haveman, 1993). Moreover, product releases by other organizations can legitimize new markets (Baum and Oliver, 1991), enable cost and resource sharing (Miner, et al., 1990), and increase demand if the organization’s products are complementary (Adner and Kapoor, 2006). The key point is that observable, environmental actions by some organizations can influence the internal dynamics of other organizations. The magnitude of these dynamics is shaped by the degree of social influence that organizations have on each other – that is, the strength of these ties.
Resource Dynamics. In summary, well known theories of organization and environment suggest
that an organization’s internal dynamics are contingent on external factors such as relationships with other organizations (Thompson, 1967; Pfeffer and Salancik, 1978; DiMaggio and Powell, 1983; Guillen, 2000). In addition, resource-based views of strategic interaction suggest that organizations will act to reduce these dependencies by developing new resources internally or acquiring them on the market (Williamson, 1975; Barney, 1991). That is, inter-organizational dependencies create incentives for managers to reduce those dependencies, if possible. These lines of argument have found broad empirical support (Dyer, 1997; Poppo and Zenger, 1998; Casciaro and Piskorski, 2005; Gulati and Sytch, 2007).
Other studies have extended this research by exploring resource dynamics, including the fluctuation of resources in response to environmental turbulence (Nickerson and Zenger, 2002), or internal reconfigurations to pursue new opportunities (Karim and Mitchell, 2000; Siggelkow, 2002). For example, in product development organizations, resources like available cash and even engineering talent fluctuate with the retail seasons or product development cycles (Clark and Fujimoto, 1991). Moreover, organizations influence each other through the flow of resources across equity alliances and corporate venture capital relationships (Doz, 1996; Casciaro and Piskorski, 2005; Dushnitsky and Lenox, 2005). In fact, it is possible that these discrete influence events can change the behavior of multiple firms in the inter-organizational network, perhaps leading to synchrony, although the temporal dynamics of this behavior have not been well explored because of methodological difficulties (although see Marsden and Friedkin, 1993).
Intentional Coordination and Network Leadership
The discussion above implies that synchronization may be generated from the influences that connected organizations exert upon each other’s resource development processes. However, other organizational research suggests another possibility – that pairs of organizations might use their
relationships to intentionally coordinate temporal processes (Im, et al., 2005; Adner and Kapoor, 2006; Davis, 2009). For instance, firms use strategic alliance relationships to conduct joint R&D and align their technological trajectories (Powell, et al., 1996; Stuart, 2000). In a study of eight inter-firm technology relationships in the computer industry, Davis (2009) finds that pairs of firms that jointly develop new technologies deliberately entrained important milestones like product releases and coordinated their resource development processes over time. Inter-firm coordination ensures that external actions of partners are synchronized by intentionally aligning internal processes. As a result, the two organizations can act as one in their environment, and potentially use their combined influence with other organizations (Ingram and Inman, 1996; Davis, 2009).
Indeed, other research in the computer industry finds that pairs or small groups of firms
repeatedly use their relationships to change the technical architecture to their own advantage, and usurp technical leadership from incumbents (Bresnahan and Greenstein, 1999; Gawer and Cusumano, 2002). For instance, Intel and Microsoft used the their long term symbiotic relationship to develop new
interface technologies, create new markets for complementary products, and control the evolution of the computer industry:
“Andy Grove described the relationship…as ‘two companies joined at the hip.’ While constantly vying for perceived leadership of the PC industry and jealously guarding their own spheres of influence (software for Microsoft and hardware for Intel) most of the time the two companies were able to maintain their symbiotic relationship… “ Burgelman (2002: 341)
Indeed, the firms coordinated effectively and developed a number of complementary technologies underlying the “Wintel” product platform (Bresnahan and Greenstein, 1999; Casadesus-Masanell and Yoffie, 2007).
Organizational Performance in the Context of Synchrony
Implicit in these arguments is a well known tension between cooperation and competition in inter-organizational relationships (Hamel, 1991; Khanna, et al., 1998; Casadesus-Masanell and Yoffie, 2007; Rosenberger, et al., 2008), which has implications for the temporal dynamics of synchrony. Even
in relationships characterized by high complementarity and significant incentives to synchronize, some partners may enjoy more benefits from synchrony than others. This suggests that even organizations wishing to cooperate may have two important, but potentially conflicting, objectives. On the one hand, organizations cooperating within the same industrial networks – for instance, complementors on the same platform – prefer that their network synchronize faster than competing networks. As described above, this underlies the incentives to cooperate in accelerating network-wide synchrony if possible.
On the other hand, organizations prefer their own dynamics be most influential in generating synchrony. Organizations may have multiple rationales for preferring their own rhythm to their
partners’ rhythms. One line of economic argument focuses on the cost of changing the pace of resource development due to inter-organizational influence. For instance, accelerating product development can be costly (Eisenhardt and Tabrizi, 1995; Pacheco de Almeida and Zemsky, 2002), and multiple studies of organizational inertia highlight the difficulty of changing internal structures and processes (Haveman, 1992; Greve, 1999). Other economic arguments suggest that organizations may forgo important revenue opportunities if they allow their rhythm to be shifted away from an optimal temporal segmentation of market demand (Tirole, 2007; Zemsky and Pacheco-de-Almeida, 2007). All else equal, organizations prefer that their partners undergo the difficult scheduling changes to achieve synchrony, and become coopted to their own, underlying rhythm.
For instance, in highly interdependent environments like the personal computer industry, controlling the rhythm of technological evolution is an important aspect of platform leadership (Bresnahan and Greenstein, 1999; Fine, 1999; Gawer and Cusumano, 2002). Organizations in these environments prefer that synchrony tip to their own underlying rhythm to control the pace of
development. In support, Bresnahan and Greenstein (1999) describe how Intel, Microsoft, and IBM, while ostensibly cooperating in developing the PC platform, fought for technological leadership within the PC platform network. By partnering with other manufacturers like Compaq, and coordinating their
efforts, Intel and Microsoft wrested industry leadership from IBM and controlled the pace and direction of platform development (Bresnahan and Greenstein, 1999).
Indeed, while coordinating the rhythm of technological development can provide an advantage to some organizations over others within the winning network, the two objectives of organizations
(synchronizing quickly and synchronizing to one’s preferred rhythm) may not be in conflict if
intentional coordination actually accelerates synchronization for all members of the network. In such a world, coordinating organizations, while ostensibly coordinating in order to enjoy the benefits of network leadership, could create benefits for non-coordinating organizations by accelerating
synchronization. Developing theory about synchronization could improve our understanding of the relationship between cooperation and coordination in organizational networks over time.
Taken together, I wish to explore the impact of influence and coordination mechanisms on synchrony in cooperative networks. I turn now to the simple model I use to address these issues.
METHODS
The prior discussion suggests that the emergence of synchrony in inter-organizational networks has important implications for understanding how organizations cooperate. Despite the importance of this phenomenon, however, it has not been well explored because of the difficulty of studying temporal dynamics in networks. To explore this issue, I employ an inductive approach using simulation methods (Davis, et al., 2007). Specifically, I seek to develop a simple computational model grounded in existing research on inter-organizational network dynamics which can be used to explore the emergence of synchrony in a controlled, virtual environment (Burton and Obel, 1995; Davis, et al., 2007).
Simulation is a particularly effective method for research such as this where some of the basic elements of the theory are understood, but its underlying theoretical logic is limited (Davis, et al., 2007). As Rudolph and Repenning (2002: 4) note, simulation “facilitates the identification of structures
validation of theoretical logic as well as the elaboration of theory through experimentation (March, 1991; Zott, 2003). Simulation is also an especially useful method when the phenomenon is non-linear (Lennox, et al., 2006; Davis, et al., 2007). While case and statistical methods may indicate
non-linearities, they are less precise than simulation in elucidating complex temporal effects such as tipping points, entrainment, and synchrony. Additionally, simulation is a useful method for research such as this in which empirical data are unavailable (Davis, et al., 2007). For example, simulation enables me to study inter-organizational influence on intra-organizational resource dynamics over time, a network-based phenomenon where longitudinal data may be difficult to obtain (Watts and Strogatz, 1998; Albert, et al., 2000).
Modeling Precedents: From Diffusion and Interdependence to the Network Dynamics of Influence
This research builds upon a trend towards utilizing endogenous and/or network models to understand social and organizational phenomena (Strang and Macy, 2001; Repenning and Sterman, 2002; Zott, 2003; Centola and Macy, 2007; Lenox, et al., 2007). Such models are often more realistic and can reveal potentially surprising behaviors that are difficult to discern in exogenous or cross-sectional models that do not involve interdependencies (Davis, et al., 2007). Many researchers are considering the impact of endogenous dynamics that are generated by the simultaneous interactions of multiple variables or agents over time (Sastry, 1997; Strang and Macy, 2001; Repenning and Sterman, 2002; Zott, 2003). For instance, Strang and Macy (2001) model the abandonment and adoption of innovations based on the perception of other organizations’ similar decisions, generating faddish cycles of innovation use that are only moderately related to outcomes. DiMaggio and Garip (2008) model stratification as depending on the adoption of services with network externalities where the value of adoption depends upon the extent of adoption by other agents. Rudolph and Repenning (2002) use an interrelated model of stress and interruptions to model the emergence of tipping points leading to organizational collapse.
In addition, diverse network models have made inroads into organization studies. The NK model has been particularly successful in advancing our understanding of interdependence and adaptation (Levinthal, 1997; Gavetti and Levinthal, 2000; Rivkin, 2001; Rivkin and Siggelkow, 2003). In a recent advance, Lennox and colleagues (2006) combined the NK structure with a well known model of
(Cournot) competition to explore the evolution of firm choices about product interdependencies and production levels that lead to industry lifecycle dynamics. Other network models explore diffusion across social network structures (Strang and Soule, 1998; Centola and Macy, 2007; Jackson and Yariv, 2009). For example, Centola and Macy (2007) found that complex contagions requiring multiple sources of exposure diffuse more readily across networks with multiple paths between nodes. Moreover, Reagans and Zuckerman (2008) show that in small world networks with short paths connecting distant clusters, diffusion that requires costly exchange is less efficient than costless exchange because middlemen become information bottlenecks.
This study differs from the emerging work on diffusion and interdependence by seeking to understand the temporal dynamics of accumulated influence and its link to collective behavior. As in other threshold models (Granovetter, 1978; Schelling, 1978), we seek a model where influence accumulates across network ties over time until “enough” influence causes an agent’s behavior to change. However, unlike many contagion models, which only require one diffusion event to cause “infection,” we seek a more general model where zero, one, or many influence events can generate behavior depending on the dynamics of accumulated influence. In seeking generality, I assume that behaviors can emerge from the influence of one or many actors and, thus, can be either simple or complex, and that transmission only occurs through network ties. Consistent with extant theory about social influence (c.f. Zajonc, 1965; Freedman and Fraser, 1966; Cialdini, et al., 1975), the exact timing of influence arrival is critical since the likelihood of behavior depends on the organization’s current distance to the threshold. Finally, to study the temporal dynamics of collective influence, we seek a
model of multiple behaviors, as opposed to models where organizations act only once. In the language of system dynamics, this implies that the delay between behaviors will be endogenously determined by the influence dynamics across agents in the network (Sastry, 1997; Repenning, 2003).
Modeling Oscillating Organizations: Time Varying Resource Dependence and Organizational Actions
To explore cooperation in organizational networks, the analysis here develops a simple analytical structure to model the oscillation of an organization’s resources, the occasional generation of actions by these organizations, and the influence of these actions on other organizations in a network. In doing so, it builds upon the work of Mirollo and Strogatz (1990) and Peskin (1975). These researchers developed a simple but powerful analytic structure to represent a network of oscillating agents called the pulse-coupled oscillator model. This model is adapted to the organizational context as follows. Each agent i, an organization for our purposes, is characterized by Xi, a state variable representing the amount of
resources at a given time. These resources oscillate between minimum and maximum values which are normalized to 0 and 1 with period T and frequency of 1/T. The oscillation dynamics are described by a simple differential equation of the form below where S is the constant growth and -b generates
diminishing marginal growth, resulting in a slowing upward curve of resources over time. dXi/dt = S – b*Xi
Organizational actions are generated in what biologists call an “integrate-and-fire” fashion: resources rise steadily until they reach the threshold of 1, when an action is generated. In practice, these dynamics are instantiated in a discrete time simulation and the resource state is updated every time period
according to ∆Xi = (S – b*Xi)* ∆t, as is standard in stochastic process modeling (Law and Kelton,
1991). Actions are discontinuous pulses lasting a single time period. The organization’s resources are utilized during the action pulse, and reset to zero in the next time period. Figure 2a depicts the resources and actions of one such organization: left alone, a single organization’s resource stock will increase at
the diminishing rate until it reaches the threshold of 1. At the threshold, an action is generated,
resources are reset to zero, and the organization begins the cycle again. Overall, this model captures the important insight that an organization’s resources (like free cash flow or engineering talent) can oscillate over time and, thus, influence the timing of actions in the environment (like product releases). It makes the critical assumption that managers prefer to increase their resources, but that these resources are utilized with each new action.
Pulse Coupled Inter-Organizational Networks
In a network of multiple organizations, each organization is assumed to influence the others through its actions alone. An action by any organization, i, influences all other organizations to which it is linked; specifically, each j-th organization that is linked to i will increase its resources Xj by an
amount equal to the tie strength, e. By convention, this influence is modeled as occurring in the next time period before the state changes. That is, if organization i generates an action in time t, then for all organizations j that are linked to organization i:
Xj(t+1) = Xj(t) + e
In this way, organizations are repeatedly influencing each other’s resources Xj and subsequent distance
to the threshold, so that the time of action generation for any organization in the network is endogenous to the overall system dynamics. In this model, the ties between organizations have equal tie strength, e, although this assumption can be relaxed in future research. The model can be depicted with a simple system dynamics diagram as in Figure 2b, which is described below.
System Dynamics and Initial Conditions
The pulse-coupled oscillator model has been used to successfully model biological systems such as cardiac pacemakers, the wake/sleep cycle, and the rhythmic flashing of fireflies. The model has become prominent in mathematical biology because of the emergent property of synchrony. Synchrony is often observed in nature, as in the case of fireflies that congregate in the Mangrove trees of Southeast
Asia. Fireflies begin their flashing in chaotic patterns that are out-of-sync, but over time their flashes become synchronized. The dramatic result is a bright, synchronous flashing of the entire population that can be seen for miles.
As Peskin (1975) first showed for the two oscillator case, and Mirollo and Strogatz (1990) showed for arbitrarily many oscillators, under most conditions a network of pulse coupled oscillators will eventually synchronize its actions even if each other started with different resource states. What is remarkable about this model is that influence occurs only through the pulse-like interactions. There is no central “clock” that coordinates synchrony – synchrony emerges from the interactions in the system. Central to their proof is the notion of temporal cooptation – what Mirollo and Strogatz (1990) term “absorption” – that is, the idea that over time the influence of some oscillators on others through the discrete jumps, e, would cause them to share the same frequency. Mirollo and Strogatz (1990) showed that once temporal cooptation occurs, these oscillators share the same rhythm indefinitely. In this manner, all oscillators eventually become coopted and remain synchronized. The proof assumes that the resources of each oscillator are monotonically increasing and concave down, as in dXi/dt above, and that
each is linked to each otheriii.
The emergence of synchrony in these systems is surprising from an organizational perspective because it is not necessarily the intended outcome of any single agent. That is, it may or may not be a deliberate strategy. Instead, systems come to be synchronized through a series of cooptation events, such as those depicted in Figure 3. In the organizations literature, the notion of cooptation begins with Selznick (1949), who described how allowing local leaders to participate in the TVA program in exchange for agreement with its objectives accelerated support for the program among the local population. In general, cooptation is a process whereby external elements are incorporated into the processes of a broader coalition (Scott, 2003: 71), whether a single organization or a group of organizations. From the perspective of temporal dynamics and synchrony, it will be instructive to
examine temporal cooptation events defined as occurring when an action by one organization influences another organization to increase its resources to threshold and, therefore, become synchronized with the other organization.
What is unexplored in this model is the impact of network structure on synchrony, the impact of inter-organizational coordination on synchrony, and the differential performance of organizations in a temporal sense as the network approaches synchrony. How does intentional coordination by two organizations of the sort found in the field study by Davis (2009) affect broader network
synchronization? Furthermore, it is unclear how long it takes to synchronize and engage in temporal cooptation in networks with different structures. To explore these questions, the analysis below adapts this model to the organizational context, and systematically explores the questions using simulation experiments. By manipulating the initial conditions and experimental parameters of the model, we can better understand synchrony in cooperative inter-organizational networks.
The system dynamics of a network of oscillating organizations is depicted in Figure 2a and 2b; it can be summarized as follows: Each organization begins with resources, Xi. In each time period, t,
each organization increases its resources Xi by an amount given by dXi/dt. If an organization’s
resources reach a threshold of 1, the organization generates an action and resets its resources to 0. This action influences all other organizations to which the focal organization is linked, causing them to increase their resources by an amount equal to the tie strength, e, in the next time period, t +1. This system generates a time series of continuous resource states Xi(t), and a time series of discrete action
events Ai(t) for each organization i like those depicted in Figure 1.
Assumptions and Model Boundaries
Like all research, this model involves a few important assumptions. Focusing on influence and resource dynamics, the model operationalizes these temporal processes with oscillating resources and discontinuous action pulses. While organizations no doubt have multiple rhythms and types of actions,
this model presents one such combination for the sake of simplicity and tractability (although future research could relax these assumptions). Future research could explore multiple, heterogeneous features of organizations. Moreover, social influence and resource processes are conspicuously at the macro-organizational level, although future research could detail the individual demographics and networks that no doubt underpin these organizational mechanisms.
Like all models, this one is a simplified picture of the world that represents “some but not all features of that world” in order to address a focused set of research questions (e.g., the impact of various network structures on the amount of sync and time to sync) (Lave and March, 1975). The research strategy investigates the emergence of synchrony as an important, but certainly not exclusive, element of networked cooperation. Indeed, generating collective behaviors in networks no doubt involves other important processes such as possessing mutual incentives to act jointly, agreement on means and ends, and acquisition of adequate resources to act in concert. In this research, I make the critical assumption that organizations wish to cooperate, have adequate incentives to do so (when possible), can agree on the appropriate actions (since there is only one type), and can gain resources to (eventually) cooperate. Making these assumptions allows me to focus on less well-explored issues related to the temporal dynamics of networked cooperation. While reasonable, future research could explore these assumptions as well.
Operationalizing Regular and Random Networks
Each simulation run used in the experiments presented below uses a newly generated network. Thus, each experiment may require 1000 or more networks to be generated. To quickly generate these networks, I rely on three standard models in the literature on network dynamics and computation (Watts and Strogatz, 1998; Barabasi and Albert, 1999). As a baseline model, I sometimes generate regular ring lattice networks defined by parameters N and K. These networks are simply N nodes connected in a ring to each of their closest K neighbors. Ring lattice networks are said to be “regular” because they
repeat a pattern for all nodes and ties – that is, a ring. These networks provide an easy manipulation check on the role that N and K play in network models since they are deterministic; consequently, known network statistics (density, centralization, etc.) are analytically computable for any choices of N and K. However, it is well known that the regularity of ring lattices can produce artifactual results that do not reflect the full range of dynamical behaviors. To explore the fuller parameter space of network dynamics and make appropriate inferences, random network models are needed. As a result, I only report the results of random network models. However, I should note that I ran both major analyses below – the time-to-sync and performance analyses – on ring lattices as a manipulation check and found that they displayed similar behavior to those of the second network generating model (see below).
The second network generating model is the Erdös-Renyi (ER) random network model. This model is very simple to operationalize. The network begins with N unconnected nodes. The parameter PER is the uniform probability ranging between 0 and 1 that a tie exists between any two nodes. In
simulations, a random number can be compared to PER in order to determine whether any two nodes i
and j have a tie. Since the expected number of ties is the same for each node, the PER that generates ER
random networks with mean degree equal to K can be determined. (Note: For convenience, I use “K” as the label for mean degree in the analyses that follow, and d(ni) for the exact degree of node i – i.e., the
actual number of ties emanating from node i.) Thus, network size (N) and mean degree (K) can be independently varied with these models. It should be noted, though, that ER networks sometimes produce disconnected networks where no paths exist between some stranded “islands” of nodes. The synchronization process can not work across islands. Thus, I make one important modification to the ER random network model. To ensure that networks are connected, I seed the ER network generator with a ring lattice with K=2 where every node is connected to at least two others, and make the
appropriate correction to PER that ensures mean degree (K) is correct. This guarantees that all networks
conduct all experiments involving N and K, which are parameters in the model, as well as tie strength (e).
Finally, to explore clustering (CC), I utilize the Watts-Strogatz (WS) small world model, a random network model of growing popularity. The algorithm to generate a WS network is also simple (Watts and Strogatz, 1998). Let N be the number of nodes, K be the desired mean degree, and Beta be the probability of rewiring. Then the model begins with a regular ring lattice of N nodes connected to K neighbors. For every focal node i, the probability Beta determines if each of i’s ties will be rewired to a different node. Each other possible node is equally probable within the set of nodes that wouldn’t generate self-ties or duplicate ties. Similar to the ER network algorithm, whether a tie is rewired can be determined by comparing Beta to a random number generated by the computer. After the algorithm is has examined each node’s ties, the program is finished generating the new network. N and K can be varied by varying the N and K in the original ring lattice since the algorithm eliminates no nodes or ties. More significantly, Watts and Strogatz (1998) showed empirically that Beta in an intermediate region of .01 and .1 generates high clustering coefficients (CC) but relatively short path lengths. Figure 2 in their paper shows that clustering increases dramatically in this region, but that path lengths remain almost as short as they were with Beta=1 (Watts and Strogatz, 1998). As a result, this is key region in which to explore clustering.
Population and Organization-Level Measures: Synchrony, Cooptation, and Performance
To explore the behavior of the system, it is helpful to define a number of measures. The
mathematical model suggests that synchrony of the population to a common rhythm is a possible system outcome, so it is useful to have a continuous measure that describes the amount of synchrony in the system as a whole and can be tracked over time. To enable a fine-grained tracking of synchrony across time, it is instructive to analyze the alignment of resources as the measure of synchrony since (1) it is defined for all organizations at all time points and (2) directly determines the generation of actions,
which are more occasional. Fortunately, simulation methods enable us to track these resource states at all times.
While multiple such measures of synchrony can be defined, perhaps the most basic definition of synchrony is simply the number of agents whose resource states are the same in that time period. Of course, different coalitions of organizations acting at different times can emerge. For example, in a network of 10 organizations at a given time period t=100, two organizations may be synchronized with X1=X2=.16, while three other organizations may be synchronized with X8=X9=X10=.49. That is, two
different synchronized groups have emerged. To accommodate this difference, we simply take the maximum proportion of organizations with equal resources in that time period as our measure of synchrony:
Sync(t) = maxi (∑ij orgs with Xi=Xj) / total # of orgs
In the example above, the network of 10 organizations has Sync(100)=3/10=.3 at time t=100. Generally, this measure of synchrony will grow over time as some coalitions of organizations acting with one rhythm coopt those acting with other rhythms. That is, this measure of synchrony has the advantage of capturing the process of temporal cooptation – as the entire network nears synchrony this measure will grow until all the organizations are acting in unison. It should be noted, though, that the results in the analysis that follow are robust to multiple other measures of synchronization in the mathematical literature iv.
To examine the synchronization process more directly and reveal the causal mechanisms at work, it is helpful to define the cooptation rate, λc. A cooptation event occurs when the generation of an
action by organization i causes the resources of another organization j that is not synchronized in time period t to become synchronized in time period t+1. Formally, a cooptation event in t+1, Kj(t+1), requires that Xi(t)≠ Xj(t) and Xi(t+1)= Xj(t+1). Kj(t) takes only the values 1 (cooptation of j in time t) or
rates of these events, a common technique in population-level organizational analysis. The hazard rate of cooptation, λc, is defined as:
λc = lim P(t≤T<t+∆t | t≤T)
∆tÆ0 ∆t
where T is a positive and continuous random variable denoting the time of event transition from “non-cooptation of j” to ““non-cooptation of j” and P(·) is simply the probability of “non-cooptation between time t and t+∆t v. Together with the synchrony measure above, this measure of the cooptation rate will be helpful in understanding how network synchronization unfolds over time.
Finally, it is useful to measure the performance of individual organizations in the context of synchronization. As described above, our intuition is that organizations might prefer to have the network synchrony tip to their own, underlying rhythm. Thus, a high-performing organization in a temporal sense is one that seeds the emergent synchronous cycle with its own underlying rhythm; conversely, low-performing organizations are those who are more likely to synchronize to other organization’s rhythmic impulses.
While many such measures are possible, in this context it is natural to contrast organizations that are coopted to those that do the coopting. Synchronization occurs in a step-by-step fashion in this model: early on, one or more organizations are coopted to the rhythm of another focal organization, w. As the model progresses, more organizations may be coopted to the coalition that contains this original organization w until some time when all organizations are synchronized to this rhythm. Of course, the actions of other organizations may change the exact rhythm of organization w and its growing coalition of synchronized organizations but, nonetheless, it is possible to find this original organization w – the temporal “winner” – which ultimately coopts all other organizations. Simulation analysis enables detailed tracking of the exact timecourse of cooptation so that the winning organization w can be found by backtracking through the simulation output. For each simulation run, I record Wsync(i) for each
Wsync(i) = { 1 if i=w
0 if i≠w }
That is, Wsync(i) is 1 if i is the winning organization w and 0 otherwise. When averaged over multiple
simulation runs the mean of wins and losses, <Wsync(i)>, represents the likelihood of winning for
organization i, and ranges from 0 to 1.
While informative, <Wsync(i)> does not conform to our notion of performance. In the analyses
that follow, the objective will be to manipulate some characteristic of organization i – e.g., whether i coordinates – in a controlled experiment and observe direct effects of that characteristic on performance. Thus, we desire a performance metric that compares organization i’s likelihood of winning with this characteristic relative to its likelihood of winning without this characteristic – i.e., in treatment vs. control experimental conditions holding all other variables constantvi. That is, to draw inferences about the effect of the treatment conditions on the likelihood of winning we need to adjust for the baseline likelihood of winning in the environment. To do so, we simply subtract this baseline likelihood of winning from the likelihood of winning with the treatment condition to give us the performance advantage of those conditions, labeled Psync(i):
Psync(i) = <Wsync(i)> treatment – <Wsync(i)> control
The i’th organization’s likelihood of winning for treatment and control must be calculated from separate simulation runs because, as will be seen in the analysis, the introduction of a treatment condition for even one organization i can have a profound effect on statistics for other organizations j in the network. Control simulations have all the same conditions as treatment simulations including the same values of N, K, e, and other constructs, except for the introduction of the treatment condition.
This measure of performance captures the intuition that an organization’s performance in the context of synchrony depends upon their relative capacity to coopt the network of other organizations to their own preferred rhythm. The measure provides an objective metric in which to compare the efficacy
clustered) at the organization level. Since the analysis relies upon average results over multiple runs of the simulation, the sync performance of an organization ranges between -1 and 1.
ANALYSIS
I use this analytical structure of a network of oscillating organizations and influence through action pulses to engage in two sets of analyses. The first examines the emergence of synchrony – including the magnitude and timecourse of synchrony, the evolution of cooptation, and the time to reach synchrony – and its dependence on features of network structure such as size (N), degree (K), tie
strength (e), and clustering coefficient (CC). This analysis begins by examining the emergence of synchrony in a network where no organization necessarily intends to synchronize, showing that
unintentional influence dynamics alone can generate synchronized actions in a population of connected organizations. I then analyze the impact of intentional coordination across dyads or triads on
synchronization, investigating the existence of temporal spillovers from the coordinated efforts of some organizations to other organizations in the network.
The second analysis examines the performance of different organizations under different conditions. The impact of intentional coordination on performance is examined, including its
dependence on features of network structure such as size (N), degree (K), tie strength (e), and clustering coefficient (CC). Taken together, these two analyses investigate synchrony at the both the network and organizational levels.
To ensure that the results reflect the underlying synchronization process and not merely particular outputs of stochastically generated initial conditions, the results are based on the average behavior of at least 1000 independent runs of the simulation. For each of these runs, a distinct set of initial resource conditions for each organization are generated using multiple draws from uniform random variables between 0 and 1. Thus, to explore the impact of increasing one parameter – for
parameter and the outputs are averaged while all other parameters (e.g., tie strength e, oscillation frequency 1/T, resource growth rate S, etc.) are held constant. In this manner, the impact of varying multiple parameters on model behavior can be systematically explored. Unless stated otherwise, the parameters conform to standard parameter settings used by Mirollo and Strogatz (1990) in their simulations. The standard parameter settings include a resource growth rate S=2, resource growth dissipation rate b=1, frequency of oscillation 1/T = 1/10, tie strength e=.3, and time=50, and resources Xi normalized to a range of 0 to 1. Further sensitivity analyses where multiple parameters are
simultaneously varied are conducted to confirm the robustness of the simulation results.
Emergence of Synchrony from Network Influence
Since this model is used to explore the conditions affecting synchrony emergence, it is important to verify the computational model for this purpose since all further experiments (e.g., various network structures, coordination, etc.) depend on this model (Davis, et al., 2007: 491). Thus, it is helpful to examine the outputs of a single representative run of the simulation, depicted in Figure 4, to examine how synchrony emerges. Ten fully connected organizations begin with randomly determined resource states between 0 and 1. Some organizations begin with resources closer to others, while others are farther apart. As the simulation progresses, some organizations reach threshold, produce an action, and thereby influence all other linked organizations. This influence increases the resources of other
organizations, causing some of them to reach threshold and come into synchrony in the next time period. Over time, groups of organizations quickly form coalitions that act in unison, as can be observed in the lower graph in Figure 4. By t=13 five organizations are acting in unison; by t=22 eight organizations are acting in unison. The resources of all ten organizations are synchronized by t=24, causing them to act in unison forever. That is, the network is synchronized.
Dependence of Synchronization on Network Size (N). Changing the features of the network
discover the underlying factors that shape synchrony, this first experiment systematically varies network size, N. To isolate only the effect of varying N, all other parameters are held constant including the mean degree (K), tie strength (e), and cluster coefficient (CC). It will be the standard practice in these experiments to hold all else constant while varying only one experimental parameter. As described in the Methods section, I use an ER model to generate a new random network with randomly distributed resource states on each simulation runvii. The upper graph in Figure 5 plots the evolution of synchrony in networks with eight, twelve, and twenty organizations for 100 time periods. As described in the methods, the amount of synchrony, Sync(t), is defined as maximum proportion of agents whose resource states are the same at time period t. Each point on the graph is the average synchrony over 1000
simulation runs.
The results indicate that networks of all sizes eventually converge to complete synchrony (Sync=1). As long as the network is connected, synchrony increases steadily until all organizations are ultimately synchronized to a common rhythm. While all are ultimately convergent, the results indicate important differences for the three different sized networks. As network size increases, the magnitude of synchrony decreasesviii. Put another way, synchrony grows more slowly in large networks than small networks. Why does synchronization depend on network size?
To understand the size dependence of synchrony, I conduct an event history analysis of
cooptation events. The cooptation rate, λc, measures the degree of influence of some organizations on
others over time. This analysis is plotted in the lower graph of Figure 5. While the rate of cooptation peaks around t=8 for all network sizes, this rate is actually lower in larger networks. To understand this, recall that the cooptation rate is normalized by network size in order to make appropriate inferences about the likelihood of cooptation for each organization across variations (see endnote iv for details). In larger networks, there are more organizations to be coopted and, thus, a lower cooptation rate. Indeed, multiple competing rhythms may coexist in large networks for a long time before one dominant rhythm
emerges, which is reflected in the weaker synchronization in large networks. Overall, synchrony (the upper graph) is weaker and slower in larger networks than smaller networks because of the weaker relative effect of cooptation (the lower graph).
Dependence of Synchronization on Mean Degree (K). The second experiment explores the
dependence of synchrony on the number of ties per node – i.e., called “degree” in social network terminology. Again, I draw random networks from an ER random network model, but now vary the mean degree (K) while holding all other parameters (N, e, etc.) constant ix. The upper graph in Figure 6 plots the evolution of synchrony in a moderately sized network (N=20) with low, medium, and high mean degree – that is, K=2, K=10, and K=14, respectively. What is clear from this graph is that the amount of synchrony increases as the number of ties increases. The event history analysis indicates that the rate of cooptation is higher in networks with more ties since these organizations possess more ties across which influence can occur. While all networks eventually reach synchrony, networks with fewer ties per organization take much longer to synchronize than those with more ties per organization because of these diminished opportunities for direct cooptation. I explore this mechanism in more depth below.
Dependence of Synchronization on Tie Strength (e). The next experiment explores the
dependence of synchrony on the strength of ties. The upper graph in Figure 7 plots the evolution of synchrony in networks with low, medium, and high tie strength – that is, e=.05, e=.1, and e=.25,
respectively. What is clear from the graph is that, much like increasing mean degree (K), increasing tie strength (e) increases the amount of synchrony. In fact, the differences are so stark that simulations with low tie strength (e=.05 and e=.1) may appear to oscillate or never fully synchronize. The oscillations are an artifact of the very low tie strength: a few organizations are repeatedly coopted into different sized coalitions until the influence dynamics cause one coalition to gradually coopt another entire coalition
and the oscillations disappear. Of course, these and other networks in this experiment do eventually synchronize.
To understand these dynamics, 40 time periods of this analysis have been plotted on both the lower and upper graphs of Figure 7. At this level of granularity, important differences in the cooptation rates on the lower graph can be observed. While the peak cooptation rate is the same for all three variations, these curves are offset across time. Higher tie strength accelerates cooptation because fewer attempts at influence are needed to push an organization’s resources over threshold and, thus, generate a cooptation event. In contrast, cooptation is a weaker force in networks with lower tie strength: influence accumulates slowly and cooptation is delayed relative to higher tie strength networks. As tie strength approaches 1, cooptation becomes more certain, occurring even within a single time period, in contrast to the slower accumulation of influence over many time periods when tie strength is low.
Dependence of Synchronization on Clustering (CC). The next experiment explores the impact
of clustering on the evolution of synchrony. Clustering is the degree to which the set of organizations that are tied to each organization are themselves tied to each other – i.e., “friends of friends are
themselves friends.” Networks with high clustering may have subgroups which are fully connected cliques. To explore clustering, I utilize the WS small world model to generate random networks with different cluster coefficients by varying a key parameter (Beta, the likelihood of rewiring) in the model. Watts and Strogatz (1998) showed that decreasing Beta increases clustering but decreases the length of paths between nodes. With intermediate Beta valuesx, the model generates networks with high
clustering but relatively short path lengths, often called “small world” networks (Watts and Strogatz, 1998). To focus on clustering, I examine moderately sized networks (N=100) with a high mean degree (K=60) where the path lengths between pairs of organizations are relatively short.
To interpret the top graph in Figure 8, recall that the cluster coefficient declines as Beta
increasing clustering decreases the magnitude and speed of synchronization. Zooming in on a small segment – from t=350 to 400 – is clarifying. Of course, it should be noted that this effect is rather weak compared to synchrony’s dependence on N, K, and e. The effect of clustering on synchrony can only be observed over very long time periods when the accumulated differences in synchrony are visible, and in very large networks where differences in clustering can be greater (Watts and Strogatz, 1998).
However, this effect, while weaker and limited to larger networks, can be explained by
examining the simulation output over time. In even slightly clustered networks, cooptation works very quickly to create synchronized coalitions within clustered regions. A closer inspection of the cooptation rate in the lower graph – for example, zooming in between time periods 0 and 25 – tells us very little: because most of the cooptation occurs quickly, these graphs are almost perfectly superimposed over each other. While cooptation within clusters is quick, the rhythms across clusters are more variable, leading to longer times for coalitions to coopt each other and generate network-wide synchrony. By contrast, less clustered networks have more evenly distributed ties, which enable organizations to coopt each other more uniformly such that network-wide synchrony can emerge more quickly. This intriguing result is explored below.
Identifying Three Theoretical Mechanisms: Accelerated, Coalitional and Conflicting Influence.
One advantage of simulation methods is that they can be used to understand the theoretical mechanisms that generate important findings (Davis, et al., 2007). Social mechanisms are causal logics that, while not always true, are at work when the conditions in the system are appropriate (Hedstrom and Swedberg, 1998; Davis and Marquis, 2005). The experiments above found that synchrony depends upon network size, mean degree, tie strength, and clustering coefficient. Taking this analysis a step further, the event history analysis sheds further light on these dependencies by linking differences in the cooptation rate to synchronization outcomes. By examining the simulation over time – including
differences in temporal cooptation – we can better understand the specific mechanisms that generate these findings. Three important mechanisms emerge. They are depicted in Figure 9.
Accelerated Influence. Consider the dependence of synchrony on the strength of ties.
Examining the event history analysis in the lower graph of Figure 7 revealed a very simple finding: increasing tie strength shifted the cooptation rate curve forward in time. Comparing multiple time series of cooptation events reveals the very simple mechanism at the heart of this finding. When tie strength is low, cooptation is generated by many cycles of accumulated influence that push the coopted
organization closer to synchrony with the coopting organization. As tie strength increases the likelihood of accelerated influence increases, which reduces the number of cycles necessary for cooptation. The net effect is to accelerate cooptation between connected organizations and shift the cooptation rate curves forward in time. At the limit of maximum tie strength (e=1), a single influence attempt will coopt a given organization, as depicted in Figure 9.
Coalitional Influence. Consider the dependence of synchrony on the number of ties per node –
that is, the mean degree (K). The event history analysis in the lower graph of Figure 6 indicated that the cooptation rate increases when the number of ties increases. Examining the simulation output reveals that this effect occurs because possessing more ties increases the number of organizations that can coopt any other organization. As a result, multiple coalitions of organizations that share the same rhythm are more likely to emerge, and these coalitions use their combined influence to quickly coopt single
organizations or smaller coalitions, as depicted in Figure 9. This coalitional influence is often observed as K increases – the outputs of simulations with high K begin with single organizations acting
asynchronously, but these individual organizations quickly form small coalitions which combine with other coalitions until all are synchronized. Finally, it should be noted that the combined influence of these larger groups accelerates influence as well. Multiple organizations acting as one can substitute for a single organization with strong influence, as can readily be seen from the forward shifting cooptation