HAL Id: inserm-00739520
https://www.hal.inserm.fr/inserm-00739520
Submitted on 12 Jul 2013HAL is a multi-disciplinary open access archive for the deposit and dissemination of sci-entific research documents, whether they are pub-lished or not. The documents may come from teaching and research institutions in France or abroad, or from public or private research centers.
L’archive ouverte pluridisciplinaire HAL, est destinée au dépôt et à la diffusion de documents scientifiques de niveau recherche, publiés ou non, émanant des établissements d’enseignement et de recherche français ou étrangers, des laboratoires publics ou privés.
Ibrahima Diouf, Jérémie Botton, Marie Aline Charles, Olivier Morel, Anne
Forhan, Monique Kaminski, Barbara Heude
To cite this version:
Ibrahima Diouf, Jérémie Botton, Marie Aline Charles, Olivier Morel, Anne Forhan, et al.. Specific role of maternal weight change in the first trimester of pregnancy on birth size.: Weight change in the first trimester and birth size. Maternal and Child Nutrition, Wiley, 2012, 10 (3), pp.315-326 �10.1111/j.1740-8709.2012.00423.x�. �inserm-00739520�
Specific role of maternal weight change in the first trimester of
1pregnancy on birth size
2Ibrahima Diouf,1,2 Jérémie Botton, 1 Marie Aline Charles,1,2 Olivier Morel, 3 Anne Forhan,1,2 3
Monique Kaminski,4,5 Barbara Heude,1,2 and the EDEN Study Group 4
Authors’ affiliations 5
1
INSERM, CESP Centre for Research in Epidemiology and Populations Health, U1018 Team 10
6
"Lifelong epidemiology of obesity, diabetes and chronic renal disease", F-94807, Villejuif,
7
France; 2Univ Paris-Sud 11, UMRS 1018, F-94807, Villejuif, France; 3Regional Maternity,
8
University of Nancy; 4INSERM, UMRS 953, Epidemiological research on perinatal health and
9
women’s and children’s health, F-94807 Villejuif, France; 5
UPMC Univ Paris 06, F-75005,
10
Paris, France.
11
Constitution of the EDEN Mother-child cohort study group : MA Charles, M de Agostini, A 12
Forhan, B Heude, P Ducimetière, M Kaminski, MJ Saurel-Cubizolles, P Dargent, X Fritel, B 13
Larroque, N Lelong, L Marchand, C Nabet, I Annesi-Maesano, R Slama, V Goua, G Magnin, R 14
Hankard, O Thiebaugeorges, M Schweitzer, B Foliguet, N Job-Spira 15
Corresponding author
16
Ibrahima Diouf 17
INSERM U1018 16 Avenue Paul Vaillant Couturier 18
94807 Villejuif cedex, FRANCE 19
Tel: +33 1 45 59 51 01 Fax: +33 1 47 26 94 54 20
ibrahima.diouf@inserm.fr
21
Running head : Weight change in the first trimester and birth size 22
23
Acknowledgments:
24Ibrahima Diouf: analyzed data and wrote paper 25
Marie-Aline Charles and Monique Kaminski: designed research 26
Jérémie Botton: gave advices for statistical analyses 27
Olivier Morel: Gave advices for manuscript redaction 28
Anne Forhan: conducted research 29
Barbara Heude: had primary responsibility for final content 30
31
We thank Beverley Balkau who reviewed the manuscript for content and language. 32 33 34 35
Introduction
36Maternal prepregnancy body mass index (BMI) is strongly and positively associated with 37
birthweight after accounting for gestational age (Kramer et al., 2002). When BMI before 38
pregnancy is taken into account, maternal weight gain during pregnancy has an independent 39
positive effect on birthweight (Heude et al., Kari, 2007, Kinnunen et al., 2003). High maternal 40
prepregnancy BMI is associated with lower weight gain during pregnancy, which may in part 41
be due to medical advice but may also indicate a regulation of gestational weight gain based 42
on maternal fat stores at the start of pregnancy (Heude et al.). Maternal weight gain in early 43
pregnancy is explained mainly by both an expansion of plasma volume and of fat stores to 44
sustain fetal perfusion and nutrition throughout pregnancy (Bernstein et al., 2001, Naeye 45
and Tafari, 1985). Maternal weight gain later in pregnancy is more influenced by fetal and 46
placental weight increase and fluid retention. Therefore, maternal weight gain in the first 47
trimester of pregnancy may have a specific effect on fetal growth. Few studies have focused 48
on the pattern of weight gain during pregnancy, in relation with pregnancy outcomes. 49
Abrahams et al. reported that each kilogram of maternal weight gain during the first and 50
second trimesters was associated with an increase in birthweight (Abrams and Selvin, 51
1995). Neufeld et al. showed that maternal weight change from the first to the second 52
trimester (between the 3rd and 6th month) was strongly associated with birth length, but not 53
weight change between the 6th and 9th month, and concluded that mid-gestation may be a 54
sensitive period for linear fetal growth (Neufeld et al., 2004). 55
Maternal weight change early in pregnancy may influence fetal growth through various 56
mechanisms: quantitative and qualitative difference in energy intake and therefore an 57
availability of nutrients for fetal and placental growth (Rosso, 1980, Abrams and Selvin, 58
1995); plasma volume expansion and fat storage in early pregnancy (Naeye and Tafari, 59
1985). On the other hand, obesity and vomiting in early pregnancy appear to be specifically 60
related to maternal weight change in early pregnancy. 61
The aim of this study was to investigate the specific relationship between maternal weight 62
change in the first trimester of pregnancy and fetal growth and birth size and to test whether 63
this association could be mediated by placental placental growth. 64
Methods
65Participants
66
Data were collected for mother-child pairs enrolled in the ongoing EDEN mother-child 67
cohort (study of pre- and early postnatal determinants of child development and health), 68
from University Hospitals in Nancy and Poitiers, France (Drouillet et al., 2008). Women 69
attending their first prenatal visit before 24 weeks of gestation at these two maternity 70
departments were invited to participate in this study. Enrolment in the study started in 71
February and September 2003 in Poitiers and Nancy respectively, and lasted 27 months in 72
each centre. Exclusion criteria were: multiple pregnancies, known pregestational diabetes, 73
plans to move outside the region in the next three years, lack of ability to speak and read 74
French. Among eligible women 55% (2002 women) accepted to participate (1 034 women in 75
Nancy and 968 in Poitiers). The women and their offspring are being followed over five 76
years. 77
Written consent was obtained for the mother and for her offspring after delivery. The EDEN 78
study has been approved by the ethics committee (Comité Consultatif pour la Protection des 79
personnes dans la Recherche Biomédicale) of Kremlin Bicêtre Hospital, and by the
80
Commission Nationale de l’Informatique et des Libertés (CNIL).
81
Data collection
82
The mothers’ prepregnancy weight and educational level were obtained by interview at 83
inclusion. At 24-28 weeks of gestation, they answered a self-administered questionnaire and 84
a clinical examination was performed by midwife research assistants. Maternal height was 85
measured with a wall Seca 2006 stadiometer (Hamburg, Germany) to the nearest 0.2cm. 86
Also during this clinical examination women’s were weighed with an electronic scales 87
Terraillon SL 351 (Hanson Ltd, United Kindom). Measures of fetal anthropometry (head 88
circumference (HC), abdominal circumference (AC), biparietal diameter (BD), femoral length 89
(FL)) were obtained from routine ultrasound of pregnancy monitoring at about 22 weeks, 90
and 32 weeks of amenorrhea. 91
The same research assistants performed a second clinical examination, on average two days 92
after delivery. The mother’s weight was measured with the same protocol as above. The 93
newborn were weighed using an electronic Seca scales (Hamburg, Germany: Seca 737 in 94
Nancy and Seca 335 in Poitiers) and birth length was measured with a wooden somatometer 95
(Testut, Béthune, France). 96
Additional data were extracted from the maternity records: mother’s weight measured and 97
reported by clinicians at each prenatal visit (eight measures on average), parity and 98
placental weight at birth. Placental weight was systematically recorded in Poitiers centre 99
whereas in Nancy it tended to be more recorded in case of caesarean. Data on frequent 100
vomiting in early pregnancy were obtained by questionnaire at recruitment. Data on 101
cigarette use before pregnancy was obtained by questionnaire at 24-28 weeks of gestation 102
and those for cigarette use during the third trimester of gestation were obtained by 103
questionnaire in the post partum period. 104
Generated variables 105
Maternal education was categorised in three levels: “Before admission at university”, 106
“Admission at university” and “≥2 years after admission at university”. We defined three 107
categories of cigarette smoking: “never” for women who did not smoke both before and 108
during pregnancy; “before pregnancy only” for women who smoked before but not during 109
pregnancy; and “in pregnancy” for women who declared smoking during pregnancy. We 110
estimated fetal weight (EFW) during the second and third trimester of gestation using the 111
Hadlock formula based on four measures: head circumference, abdominal circumference, 112
biparietal diameter, femoral length (Hadlock et al., 1985). Fetal growth between the second 113
and the third trimester of pregnancy was estimated by calculating the EFW in the third 114
trimester minus EFW in the second trimester. Also fetal growth between 6 months and 115
delivery was calculated as birthweight minus EFW at 6 months. Large for gestational age 116
(LGA) and small for gestational age (SGA) were defined as birthweights over the 90th 117
percentile and below the 10th percentile, respectively, of French gestational age and gender 118
specific reference curves (Mamelle et al., 1996). The newborn’s ponderal index was 119
computed as birthweight (kg) divided by birth length (m) cubed. Prepregnancy BMI was 120
calculated as reported weight before pregnancy divided by height (m) squared. BMI 121
categories were defined by: thin (BMI <18.5 kg/m2), normal (BMI between 18.5 and 25 kg/ 122
m2), overweight (BMI between 25 and 30 kg/ m2) and obese (BMI ≥30 kg/ m2). 123
Population selection
124
From the 2002 mothers included in the EDEN study, we excluded 142 mother-child pairs 125
with fewer than five measures of maternal weight during pregnancy. Among the mothers 126
with at least five measures of weight during pregnancy we excluded 14 whose weight before 127
pregnancy was missing. From the remaining mothers, we excluded from this analysis the 128
102 with preterm births, as weight change in the first trimester was not related to 129
prematurity and preterm babies may have experienced specific situations which would have 130
affected their growth in utero. Analyses were performed for 1744 mother-child pairs. 131
Estimation of weight change
132
In the EDEN study measures of women’s weight through pregnancy were not obtained at the 133
same gestational ages. Therefore, we would have many missing values if we studied weight 134
change at given period during pregnancy. The important number of measures of women’s 135
weight at different times during pregnancy (8 measures on average) allowed us to have a 136
precise estimation of women’s weight at each week of gestation. 137
Maternal weight, at each week of gestation was estimated using a third-degree polynomial 138
model, which included a subject random effect on the intercept, slope and curvature and 139
based on women’s weights measured during prenatal visits. When compared, the observed 140
weight before pregnancy (mean ± standard deviation = 62.2±12.8, which was not included in 141
the model) and the predicted weight (mean ± standard deviation = 62.3±12.7) were highly 142
correlated (r=0.99). Thereafter we computed weight change at each trimester of pregnancy: 143
for the first trimester (WCT1), predicted weight at 14 completed weeks minus predicted 144
weight at start of gestation; for the second trimester (WCT2), predicted weight at 28 145
completed weeks minus predicted weight at 14 weeks; for the third trimester (WCT3), 146
predicted weight at delivery (adjusted for gestational age) minus predicted weight at 28 147
weeks. 148
Statistical analysis
149
Characteristics of the mother and their newborns are described by means ± standard 150
deviations and percentages (n). The evolution of the average weight of mothers during 151
gestation was modelled within BMI strata. Associations between WCT1 and maternal 152
characteristics (age, BMI, cigarette smoking, parity, education, frequent vomiting in early 153
pregnancy and recruitment centre) were estimated with a linear regression model. 154
The associations between WCT1 and fetal growth and birth size were analysed in three steps 155
Firstly, the associations between WCT1 and fetal growth, birthweight, placental weight and 156
birth length were analysed by linear models, with adjustment for recruitment centre, 157
maternal age, education, prepregnancy BMI, maternal height, and additional adjustment for 158
gestational age (gestational age at ultrasound for the EFW at the second and third trimester), 159
cigarette smoking, parity and the newborn’s gender. The relations between WCT1 and SGA 160
and LGA were analysed with a logistic model with the same adjustments as before, except 161
for gestational age and newborn gender. 162
In a second step, we adjusted for WCT2 and WCT3 to investigate whether the observed 163
associations were independent of weight gain in later gestation. 164
In the final step, we selected the 1304 mother-child pairs for whom placental weight was 165
available. Placental weight at delivery was considered to be a marker of placental growth 166
and function. As used before in the EDEN study we adopted path analysis to investigate 167
whether a causal relationship between WCT1 and birth size (birth weight and length) was 168
mediated by the placenta (Regnault et al., 2011). Figure 1 displays the model we postulated 169
for birthweight. A single-headed arrow represents the direct effect of one variable on 170
another, with a relation defined by a linear equation. We postulated that WCT1 might 171
influence birthweight through placental function. In path models a given variable can be an 172
explanatory variable in one equation and an outcome in another one. The assumption of 173
normality is required for all variables that are influenced by at least one variable (Loehlin, 174
2004). Variables included in the model were pre-adjusted for variables that were 175
significantly related with them, when considered in multivariable models (see legend of 176
Figure 1). Path analyses allow an estimation of the indirect effects of a variable on an 177
outcome (effects that are mediated by other variables) (Loehlin, 2004). 178
The conditions of validity of the path model were verified with some usual criteria: the 179
hierarchical chi-square test (p value >0.05), the Goodness of Fit Index (GFI between 0.95 and 180
1), the Adjusted Goodness of Fit Index (AGFI between 0.95 and 1) and the Root Mean Square 181
Error of Approximation (RMSEA <0.05) (Loehlin, 2004). 182
The different paths in the model (representing the relations between the different variables) 183
can be associated with standardized partial correlation coefficients that are interpreted as 184
coefficients of correlation between two variables when all the other variables are held 185
constant. 186
The same approach was used to assess the potential mediation of the placenta in the 187
association between WCT1 and birth length. We assessed whether the relations were 188
different by recruitment centre, newborn gender, parity, BMI and cigarette smoking, and 189
vomiting in early pregnancy. Also we investigated whether or not taking into account 190
gestational diabetes and gestational hypertension modified or results. 191
For sensitivity analyses we have done the same investigations in subjects from Poitiers 192
centre only where placental weight was systematically recorded. 193
All analyses used SAS software (version 9.2). In particular, the TCALIS procedure was used 194
for path analyses. 195
Results
196In a first step of our analysis we excluded women with less than five measures of weight 197
during pregnancy. When we compared women who were included versus those who were 198
excluded in term-births, those who were included declared less tabacco use before and 199
during pregnancy (p=0.006) and had a higher study level (p=0.02). 200
In a second step, we excluded mother-child paires whose placental weight at delivery was 201
not available. About 94% of women from Poitiers centre had a measure of placental weight 202
versus 43% for those from Nancy centre. In term-births, women without a measure 203
placental weight were more frequently diagnosed for gestational hypertension and had a 204
higher study level. Whereas birth weight and birth length were higher in those whose 205
placental weight was measured (table 1 in supplementary on-line information). These 206
differences were due to differences in these characteristics between study centres. Women 207
from Nancy were more frequently diagnosed for gestational hypertension (5.6% versus 208
2.8%, p=0.005) and had a higher educational level (p<0.0001). Whereas offspring’s mean 209
birth weight and height were higher in Poitiers centre (p=0.007). 210
The mean weight gain of mothers in the first trimester was 3.3kg and they gained 13.6kg on 211
average during pregnancy (Table 1). The proportion of women with frequent vomiting in 212
early pregnancy was 23.6%. Figure 2 illustrates a sigmoid curve for weight during 213
pregnancy. Thin and normal weight women gained more weight during pregnancy. WCT1 214
was positively associated with maternal age whereas there was a negative association with 215
maternal prepregnancy BMI (Table 2). Women from the Poitiers centre gained more weight 216
in the first trimester than those from Nancy. Women who smoked before pregnancy only 217
and those who were still smoking during pregnancy gained more weight in the first 218
trimester. Educational level was negatively associated with WCT1. Frequent vomiting in 219
early pregnancy was associated with a lower WCT1 (Table 2). 220
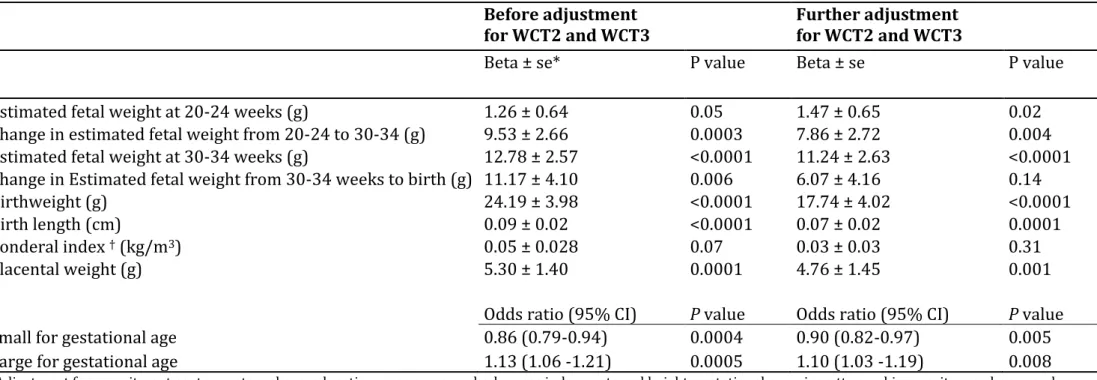
When adjusted for maternal and pregnancy characteristics (recruitment centre, maternal 221
age, educational, prepregnancy BMI, maternal height, gestational age, cigarette smoking, 222
parity, the newborn’s gender), WCT1 was positively associated with fetal growth (EFW at 223
second and third trimester, and change in EFW from second to third trimester, change in 224
EFW between third trimester and delivery and placental weight) (Table 3). Further, WCT1 225
was positively associated with birthweight, birth length and risk of LGA, with a negative 226
relation with risk of SGA. These associations remained significant when further adjusted for 227
WCT2 and WCT3 (Table 3). 228
Figure 1 displays the path diagram depicting the direct associations between prepregnancy 229
BMI, WCT1, WCT2, WCT3 and placental weight and their direct association with birthweight. 230
The total, direct and indirect associations are reported in Table 4. 231
Results of path analysis showed that prepregnancy BMI was negatively associated with 232
WCT1 (r= -0.30) and WCT2 (r= -0.20) while it was positively associated with WCT3 (r= 0.13, 233
p <0.0001). According to the postulated path diagram, prepregnancy BMI was also 234
independently associated with placental weight (r= 0.18) and birthweight (r= 0.11, p 235
<0.0001). 236
WCT1 was not independently associated with birthweight, but a significant indirect 237
association was found (r= 0.10, p <0.0001) (Table 4). WCT1 was directly associated with 238
placental weight (r= 0.10, p=0.002), which in turn was independently associated with 239
birthweight (r= 0.52). There was a direct association between WCT1 and WCT2 (r= 0.28), 240
which was independently associated with birthweight (r= 0.13, p <0.0001) and had a small 241
direct association with placental weight (r= 0.07, p = 0.03). 242
There was only a weak association between WCT3 and birthweight (r= 0.06, p =0.03). As 243
there was no direct association between WCT3 and placental weight, this path was removed 244
from the model. 245
The associations with birth length in place of birthweight were similar to that observed for 246
birthweight (Figure 1 and table 2 in supplementary on-line information). However a small 247
independent association between WCT1 and birth length was observed (r= 0.07, p =0.01). 248
In summary WCT1 influenced birthweight and birth length mainly through its effects on 249
placental weight and WCT2. 250
Further adjustment for gestational diabetes and gestational hypertension did not change the 251
association between WCT1 and newborn anthropometry. When the same analyses were 252
restricted to Poitiers centre where placental weight was systematically measured for 253
sensitivity analyses, the same results were observed. 254
Discussion
255Weight change in the first trimester was associated with fetal growth and birth size even 256
when weight changes in later gestation were taken into account. Results of path analysis 257
showed that the relation between weight change in the first trimester and birth size was in 258
part mediated by placental weight at birth, which we used as a proxy of placental growth 259
and function. As women in our study centres appeared to be quite different and that 260
placental weight was systematically recorded in Poitiers centre but not in Nancy, we 261
restricted our analysis to women in Poitiers centre and observed similar results. No 262
difference in weight gain during the first trimester was observed between women who had a 263
measure of placental weight (3.3g) and those without a measure of placental weight (3.2kg, 264
p=0.7). 265
Weights at each week of gestation were estimated based on measures of weight during 266
pregnancy (eight on average). Previous studies used piecewise linear regression models to 267
estimate weight change at each trimester of pregnancy from measured weights during 268
pregnancy (Abrams, 1995, Carmichael et al., 1997). In our study a polynomial model and 269
three degrees was adequate, as the quadratic term was not significant. The important 270
number of measures of women’s weight (eight measures on average) at different moments 271
of pregnancy in the EDEN study allowed a precise estimation of women’s weight at each 272
week of gestation. To verify that our model gave good estimations of women’s weights 273
during pregnancy, we compared women’s reported prepregnancy weight (mean= 62.2kg 274
±12.8kg, which was not included in our model) to women’s prepregnancy weight obtained 275
with the model (mean=62.3kg ±12.7). These two measures were comparable and highly 276
correlated (r=0.99). The same verification was done with women’s weight measured 277
between 24 and28 weeks (25th week on average) and women’s weight at 25 weeks of 278
gestation obtained with our model. The two measures were also comparable and highly 279
correlated. Thereafter we added women’s weight measured between 24 and 28 weeks of 280
gestation to our model to reduce the number of women with less than 5 measures of weight 281
in our sample. 282
In this study weight change in the first trimester is considered as an indicator of women’s 283
nutritional status in early pregnancy. One may argue that, due to physiological changes in 284
early pregnancy, weight change in the first trimester of pregnancy may not fully reflect the 285
women’s nutritional status. However the physiological changes in early pregnancy are 286
related to women’s nutrition status. The choice of the first trimester as a limit of the early 287
pregnancy period may be found arbitrary. However it is more common to adopt the limits of 288
different trimesters as different stages of pregnancy. Also, it would have been interesting to 289
have a longitudinal model of repeated measurements of fetal biometry, but since we had 290
only two fetal measurements during pregnancy, this was not possible in this study. The use 291
of birthweight minus estimated fetal weight at 6th month of pregnancy as an indicator of 292
fetal growth may be weakened by the fact that the error of measurement of brithweight may 293
be different to the error of measurement of fetal size by ultrasound (errors related to the use 294
of ultrasound). 295
The relation between WCT1 and birthweight and birth length may be explained by several 296
mechanisms: an adequate placental development which in turn influences fetal growth; fat 297
storage in early pregnancy and its later release for fetal growth; an availability of 298
macronutrients and micronutrients for early fetal growth. 299
The mother provides oxygen, nutrients, hormones, and antibodies to the foetus via the 300
placenta, and the end products of fetal metabolism are removed via the placenta. Placental 301
weight at delivery is positively correlated with the newborn’s weight but the maximal 302
growth of the placenta precedes that of the foetus. Its growth rate is initially greater than 303
that of the fetus (Thame et al., 2004). A small placenta usually alters fetal growth (Belkacemi 304
et al.). Maternal nutrition is associated with placental weight (Belkacemi et al., 2010) and a 305
reduction in maternal nutrition in early pregnancy may alter placental growth and birth 306
weight. In our study, maternal weight gain (used as a proxy of nutritional state) in the first 307
trimester influenced placental weight at delivery. Thame et al. found that placental volume 308
at 14 weeks of gestation and the rate of placental growth between 17 weeks and 20 weeks 309
were significantly associated with fetal measurement at 35 weeks, even when placental 310
volume at 24 weeks was added to the model (Thame et al., 2004). The rapid growth of the 311
placenta early in pregnancy is important to supply nutrients necessary for fetal growth. All 312
these findings confirm the hypothesis that placental volume and placental growth are 313
influenced by maternal nutrition in early pregnancy, and in turn, also contribute to fetal 314
growth. 315
Plasma volume expansion in early pregnancy was identified as an important factor of weight 316
gain in early pregnancy and particularly necessary for fetal growth. Abrahams et al. 317
suggested that a low plasma volume expansion might limit uteroplacental flow, reducing the 318
transfer of nutrients to support fetal growth (Abrams and Selvin, 1995). 319
Neufeld et al. reported that weight change between the 3rd and 6th month of gestation had a 320
positive effect on linear fetal growth and not weight change from 6 to 9 months of gestation 321
(Neufeld et al., 2004). In our study we found an effect of WCT1 on birth length 322
independently of placental weight suggesting that the influence of weight change in early 323
pregnancy on birth length may begin early in the first three months but this independent 324
effect of WCT1 on birth length was small. Weight change in the first trimester may reflect 325
energy intake at this stage of pregnancy and therefore correspond to an availability of 326
nutrients that supply fetal growth even in the earliest stage of the first trimester, before the 327
contact between the embryo and maternal blood via the placenta (Burton et al., 2007). It has 328
been suggested that endometrial-decidual glands are sources of nutrients for the embryo, 329
the endometrium contains large accumulations of glycogen that are greatest close to the 330
materno-fetal interface (Burton et al., 2007). The endometrial-decidual glands have also 331
been identified as a source of growth factors such as the epidermal growth factor (Burton et 332
al., 2007, Hempstock et al., 2004) which stimulates cytotrophoblast cell proliferation which 333
represents the materno-fetal interface during early pregnancy (Hamilton and Boyd, 1960). 334
Studies suggested that weight change in the first trimester may influence fetal growth 335
through fat storage in early pregnancy. There is a specific pattern of fat deposition during 336
pregnancy (Taggart et al., 1967). Starting from early pregnancy fat appears to be deposited 337
preferentially over the hips, back, and upper thighs. Fat stored in early pregnancy is released 338
for fetal growth as pregnancy advances (Naeye and Tafari, 1985). 339
Studies reported that total pregnancy weight gain is negatively associated with 340
prepregnancy BMI (Diouf et al., 2011). To our knowledge the pattern of weight gain 341
(through the trimesters of pregnancy) in association with prepregnancy BMI has not been 342
reported before. We found that prepregnancy BMI was negatively associated with weight 343
gain in the first and second trimesters of pregnancy, but it was positively associated with 344
weight gain in the third trimester. Weight change in the first trimester seemed to be a result 345
of physiologic adptations to the mothers’ periconceptional fat. The lower weight gain during 346
the first trimester in mothers with higher BMI did not impact on fetal growth. Women’s with 347
higher BMI have sufficient nutrient availability to support fetal and placental growth. BMI 348
before pregnancy had significant independent effects on the newborn and placental weights 349
(Kramer et al., 2002). 350
An excessive weight gain during pregnancy is associated with adverse pregnanacy outcomes 351
(caesarean sections, gestational hypertension, macrosomia) (Crane et al., 2009). Conversely 352
women who gained less than the recommended weight gain have higher risks of 353
preeclampsia, caesarean sections, macrosomia, and low birth weight (Langford et al., 2009). 354
In this study we found that weight change in the first trimester of pregnancy was associated 355
with fetal growth and risk of large for gestational age. We did not found any association 356
between weight change in the first trimester of pregnancy and adverse pregnancy outcomes 357
like gestational diabetes, gestational hypertension or risk of caesarean sections. If these 358
results are confirmed, the monitoring of weight change in early pregnancy may be 359
considered by clinicians as an important factor in the management of fetal growth without 360
threatened effect on women’s health. 361
In this study we found that frequent vomiting in early pregnancy was associated with poor 362
weight gain in the first trimester. Other studies also reported that vomiting in early 363
pregnancy is associated with weight loss in early pregnancy (Heude et al., Kari, 2007, 364
Kinnunen et al., 2003). When compared to infants of mothers who gained weight in early 365
pregnancy, infants of mothers who lost weight in early pregnancy were found to more often 366
have poor fetal growth and to be SGA (Niebyl, 2010). In our study, we did not find a 367
statistically significant relationship between weight loss in the first three months of 368
gestation and risk of SGA. 369
Conclusion
370
Weight change during the first weeks of pregnancy seems to impact on fetal growth, 371
independently of later weight changes during pregnancy. Weight change in early pregnancy 372
and placental growth appeared as two related indicators of adequate adaptation to 373
pregnancy to support fetal growth. Weight change in early pregnancy may participate in 374
fetal growth and placental function. 375
References
Abrams, B, Carmichael S., Selvin S. (1995) Factors associated with the pattern of Maternal Weight gain during Pregnancy Obstetrics & Gynecology, 170-176.
Abrams, B & Selvin, S (1995) Maternal weight gain pattern and birth weight. Obstet Gynecol 86, 163-169.
Belkacemi, L, Nelson, DM, Desai, M & Ross, MG (2010) Maternal undernutrition influences placental-fetal development. Biology of Reproduction 83, 325-331.
Bernstein, IM, Ziegler, W & Badger, GJ (2001) Plasma volume expansion in early pregnancy.
Obstet Gynecol 97, 669-672.
Burton, GJ, Jauniaux, E & Charnock-Jones, DS (2007) Human early placental development: potential roles of the endometrial glands. Placenta 28 Suppl A, S64-69.
Carmichael, S, Abrams, B & Selvin, S (1997) The pattern of maternal weight gain in women with good pregnancy outcomes. Am J Public Health 87, 1984-1988.
Crane JM, White J, Murphy P, Burrage L, Hutchens D (2009) The effect of gestational weight gain by body mass index on maternal and neonatal outcomes. J Obstet Gynaecol Can 31, 28-35.
Diouf, I, Charles, MA, Blondel, B, Heude, B & Kaminski, M (2011) Discordant time trends in maternal body size and offspring birthweight of term deliveries in France between 1972 and 2003: data from the French National Perinatal Surveys. Paediatr Perinat
Epidemiol 25, 210-217.
Drouillet, P, Forhan, A, De Lauzon-Guillain, B, Thiebaugeorges, O, Goua, V, Magnin, G, et al. (2008) Maternal fatty acid intake and fetal growth: evidence for an association in overweight women. The 'EDEN mother-child' cohort (study of pre- and early postnatal determinants of the child's development and health). Br J Nutr, 1-9.
Hadlock, FP, Harrist, RB, Sharman, RS, Deter, RL & Park, SK (1985) Estimation of fetal weight with the use of head, body, and femur measurements--a prospective study. Am J
Obstet Gynecol 151, 333-337.
Hamilton, WJ & Boyd, JD (1960) Development of the human placenta in the first three months of gestation. Journal of Anatomy 94, 297-328.
Hempstock, J, Cindrova-Davies, T, Jauniaux, E & Burton, GJ (2004) Endometrial glands as a source of nutrients, growth factors and cytokines during the first trimester of human pregnancy: a morphological and immunohistochemical study. Reprod Biol Endocrinol 2, 58.
Heude, B, Thiebaugeorges, O, Goua, V, Forhan, A, Kaminski, M, Foliguet, B, et al. Pre-Pregnancy Body Mass Index and Weight Gain During Pre-Pregnancy: Relations with Gestational Diabetes and Hypertension, and Birth Outcomes. Matern Child Health J. Kari, YL, Stephan Rössner, Martin Neovius (2007) Maternal predictors of birthweight : the
importance of weight gain during pregnancy. Obesity Research & Clinical Practice 1, 243-252.
Kinnunen, TI, Luoto, R, Gissler, M & Hemminki, E (2003) Pregnancy weight gain from 1960s to 2000 in Finland. Int J Obes Relat Metab Disord 27, 1572-1577.
Kramer, MS, Morin, I, Yang, H, Platt, RW, Usher, R, McNamara, H, et al. (2002) Why are babies getting bigger? Temporal trends in fetal growth and its determinants. J Pediatr 141, 538-542.
Langford A, Joshu C, Chang JJ, Myles T, Leet T (2011) Does gestational weight gain affect the risk of adverse maternal and infant outcomes in overweight women? Matern Child
Loehlin, JC (2004) Latent variable models: An introduction to factor, path, and structural
equation analysis. Laurence Erlbaum Associates, Inc., Mahwah, New Jersey.
Mamelle, N, Munoz, F & Grandjean, H (1996) [Fetal growth from the AUDIPOG study. I. Establishment of reference curves]. J Gynecol Obstet Biol Reprod (Paris) 25, 61-70. Naeye, RL & Tafari, N (1985) Biologic bases for international fetal growth curves. Acta
Paediatrica Scandinavica. Supplement 319, 164-169.
Neufeld, LM, Haas, JD, Grajeda, R & Martorell, R (2004) Changes in maternal weight from the first to second trimester of pregnancy are associated with fetal growth and infant length at birth. Am J Clin Nutr 79, 646-652.
Niebyl, JR (2010) Clinical practice. Nausea and vomiting in pregnancy. N Engl J Med 363, 1544-1550.
Regnault, N, Botton, J, Heude, B, Forhan, A, Hankard, R, Foliguet, B, et al. (2011) Higher Cord C-Peptide Concentrations Are Associated With Slower Growth Rate in the 1st Year of Life in Girls but Not in Boys. Diabetes 60, 2152-2159.
Rosso, P (1980) Placental growth, development, and function in relation to maternal nutrition. Federation Proceedings 39, 250-254.
Taggart, NR, Holliday, RM, Billewicz, WZ, Hytten, FE & Thomson, AM (1967) Changes in skinfolds during pregnancy. Br J Nutr 21, 439-451.
Thame, M, Osmond, C, Bennett, F, Wilks, R & Forrester, T (2004) Fetal growth is directly related to maternal anthropometry and placental volume. Eur J Clin Nutr 58, 894-900.
Source of Funding
The EDEN Study is funded by grants from the Foundation for Medical Research, the French Ministry of Research: the Institut Fédératif de Recherche program, the Institut National de la Santé et de la Recherche Médicale Human Nutrition National Research Program, and the Diabetes National Research Program (via a collaboration with the French Association for Diabetes Research), the French Ministry of Health Perinatality Program, the French Agency for Environment Security, the French National Institute for Population Health Surveillance, the Paris–Sud University, the French National Institute for Health Education, Nestlé, the National Education Health Insurance (MGEN), the French Speaking Association for the Study of Diabetes and Metabolism, the National Agency for Research (nonthematic program), and the National Institute for Research in Public Health (TGIR health cohort 2008 program).
Conflict of interest
Figure legends
Figure 1: Path diagram depicting the relations between prepregnancy body mass index, weight changes in pregnancy, placental weight and birthweight.
P value codes: *** <0.0001, ** 0.0001-0.001, * 0.001-0.05
BMI= body mass index; WCT1, WCT2 and WCT3= weight changes in the first, the second and the third trimesters.
Variables in the model were pre-adjusted for characteristics which remained significantly associated with them when included in multivariate linear model among: recruitment centre, maternal age, education, maternal height, gestational age, cigarette smoking, parity, newborn gender.
Table 1: Characteristics, mean ± Standard deviation or % (frequency); of mothers and newborn. n Mean ± SD* Age (years) 1744 29.0 ± 4.9 Height (cm) 1726 163.5 ± 6.1 Prepregnancy weight (kg) 1744 62.2 ± 12.8 Body mass index (kg/m2) 1726 23.2 ± 4.6 Pregnancy weight gain (kg) 1717 13.6 ± 4.7 Weight gain in the first trimester (kg) 1744 3.30 ±2.48 Weight gain in the second trimester (kg) 1744 6.8 ± 2.1 Weight gain in the third trimester (kg) 1744 4.5 ± 2.3 Frequent vomiting in early pregnancy (% (n)) 1724 23.6 (406) Educational level (% (n)) 1720
1 (Before admission at university) 28.2 (485) 2 (Admission at university) 17.9 (308) 3 (≥2 years after admission at university) 53.9 (927) Cigarette smoking (% (n)) 1725
Never 62.8 (1084)
Before pregnancy only 20.8 (358) During pregnancy 16.4 (283) Recruitment centre (%(n)) 1744 Poitiers 48.5 (846) Nancy 51.5 (898) Parity (%(n)) 1744 0 32.2 (562) 1 33.8 (590) ≥2 33.9 (592)
Gestational age (weeks) 1744 39.5 ± 1.2 Birthweight (g) 1740 3340 ± 438 Birth length (cm) 1715 49.8 ± 2.1 Small for gestational age (%(n)) 1740 7.9 (139) Large for gestational age (%(n)) 1740 8.6 (149) *standard deviation
Table 2: Mothers weight gain (kg) during the first trimester of pregnancy according to her characteristics, estimated by linear regression models.
Parameter Beta±SE* P value
Age (years) 0.04 ± 0.01 0.005
Body mass index (kg/m2) -0.16 ± 0.01 <.0001
Cigarette smoking <0.0001
Never -0.76 ± 0.16
Before pregnancy only 0.12 ± 0.19 During pregnancy reference
Parity 0.34
0 -0.13 ± 0.16
1 -0.21 ± 0.14
≥2 (reference) reference
Educational level <.0001
1 (Before admission at university) 0.72 ± 0.14 2 (Admission at university) 0.30 ± 0.16 reference
Vomiting in early pregnancy 0.0008 Not frequent 0.45 ± 0.13 Frequent reference Recruitement centre 0.002 Poitiers 0.36 ± 0.11 Nancy reference *standard error
Table 3: Newborn characteristics for a one kg change in weight during the first trimester of pregnancy (WCT1), before and after adjustment for weight change in the second and third trimesters of pregnancy (WCT2 and WCT3). Results are from separate linear and logistic models.
Before adjustment
for WCT2 and WCT3 Further adjustment for WCT2 and WCT3
Beta ± se* P value Beta ± se P value Estimated fetal weight at 20-24 weeks (g) 1.26 ± 0.64 0.05 1.47 ± 0.65 0.02 Change in estimated fetal weight from 20-24 to 30-34 (g) 9.53 ± 2.66 0.0003 7.86 ± 2.72 0.004 Estimated fetal weight at 30-34 weeks (g) 12.78 ± 2.57 <0.0001 11.24 ± 2.63 <0.0001 Change in Estimated fetal weight from 30-34 weeks to birth (g) 11.17 ± 4.10 0.006 6.07 ± 4.16 0.14 Birthweight (g) 24.19 ± 3.98 <0.0001 17.74 ± 4.02 <0.0001 Birth length (cm) 0.09 ± 0.02 <0.0001 0.07 ± 0.02 0.0001 Ponderal index † (kg/m3) 0.05 ± 0.028 0.07 0.03 ± 0.03 0.31
Placental weight (g) 5.30 ± 1.40 0.0001 4.76 ± 1.45 0.001
Odds ratio (95% CI) P value Odds ratio (95% CI) P value
Small for gestational age 0.86 (0.79-0.94) 0.0004 0.90 (0.82-0.97) 0.005 Large for gestational age 1.13 (1.06 -1.21) 0.0005 1.10 (1.03 -1.19) 0.008
Adjustment for recruitment centre, maternal age, education, prepregnancy body mass index, maternal height, gestational age, cigarette smoking, parity, newborn gender *se= standard error
Table 4: Total, direct and indirect associations of maternal anthropometry and placental weight on birthweight.
Total Direct Indirect
Prepregnancy Body mass index
Standardized beta 0.14 0.11 0.03 Standard Error 0.03 0.02 0.02
P-value <0.0001 <0.0001 0.11 Weight change in the first trimester
Standardized beta 0.10
0
0.10 Standard Error 0.02 0.02
P-value <0.0001 <0.0001 Weight change in the second trimester Standardized beta 0.20 Standard Error 0.03 0.13 0.03 0.08 0.02
P-value <0.0001 0 0.002 Weight change in the third trimester
Standardized beta 0.06 0.06 0 Standard Error 0.03 0.03 P-value 0.03 0.03 Placental weight Standardized beta 0.52 0.52 0 Standard Error 0.02 0.02 P-value <0.0001 <0.0001 *Standardized betas are interpretable as correlation coefficients