HAL Id: hal-03140082
https://hal-amu.archives-ouvertes.fr/hal-03140082
Submitted on 12 Feb 2021
HAL is a multi-disciplinary open access
archive for the deposit and dissemination of
sci-entific research documents, whether they are
pub-lished or not. The documents may come from
teaching and research institutions in France or
abroad, or from public or private research centers.
L’archive ouverte pluridisciplinaire HAL, est
destinée au dépôt et à la diffusion de documents
scientifiques de niveau recherche, publiés ou non,
émanant des établissements d’enseignement et de
recherche français ou étrangers, des laboratoires
publics ou privés.
Nicolas Berman, Mathieu Couttenier, Nathalie Monnet, Rohit Ticku
To cite this version:
Nicolas Berman, Mathieu Couttenier, Nathalie Monnet, Rohit Ticku. Shutdown policies and
world-wide conflict. Covid Economics, Centre for Economic Policy Research CEPR, 2020, 16, pp.61-75.
�hal-03140082�
Copyright: Nicolas Berman, Mathieu Couttenier,
Nathalie Monnet and Rohit Ticku
Shutdown policies and worldwide
conflict
1
Nicolas Berman,
2Mathieu Couttenier,
3Nathalie Monnet
4and Rohit Ticku
5Date submitted: 3 May 2020; Date accepted: 5 May 2020
We provide real-time evidence on the impact of Covid-19 restrictions
policies on conflicts globally. We combine daily information on
conflict events and government policy responses to limit the spread
of coronavirus to study how conflict levels vary following shutdown
and lockdown policies. We use the staggered implementation of
restriction policies across countries to identify their effect on conflict
incidence and intensity. Our results show that imposing a
nation-wide shutdown reduces the likelihood of daily conflict by around 9
percentage points. The reduction is driven by a drop in the incidence
of battles, protests and violence against civilians. Across actors
the decline is significant for conflicts involving political militias,
protesters and civilians. We also observe a significant cross-country
heterogeneity in the effect of restriction policies on conflict: no conflict
reduction is observed in low income countries and in societies more
fractionalized along ethnic or religious lines. We discuss the potential
channels that can explain this heterogeneity.
1 This work was supported by French National Research Agency Grants ANR-17-EURE-0020. Mathieu Couttenier acknowledges financial support from the IDEXLYON, University of Lyon (French National Research Agency, “Programme Investissements d’Avenir” ANR-16-IDEX-0005). Nathalie Monnet acknowledge financial support from the Swiss National Research Foundation (grant Economics of Conflict and Violence P0GEP1-175125). Rohit Ticku acknowledges financial support from the Institute for the Study of Religion, Economics and Society, Chapman University. An Online Appendix to this paper is available here: Online Appendix.
2 CNRS Researcher, Aix-Marseille School of Economics, and CEPR. 3 IDEX Research Chair, GATE, ENS Lyon, and CEPR.
4 PhD candidate, Graduate Institute of International and Development Studies, Geneva.
5 Postdoctoral fellow, Institute for the Study of Religion, Economics and Society, Chapman University.
Covid Economics
1
Introduction
On March 31st, 2020 the U.N. Secretary General, Antonio Guterres, cautioned that the coronavirus epidemic could lead to “enhanced instability, enhanced unrest, and enhanced conflict”. The ongoing epidemic can exacerbate conflict by upending social and political protections. The effect could be severe for the vulnerable populations: those caught up in war and persecution, or those living in densely populated areas with dismal state capacity.1 Critically, countries have responded with varying degree of restrictions to limit the spread of coronavirus. The policy response to Covid-19 can itself have a bearing on conflict situations.
Anecdotal evidence suggests that restrictions on mobility to flatten the epidemic curve, that raise the cost of mobilization, have a direct and negative effect on conflict. For example, violent crime across major cities in the United States has fallen sharply following the lockdown2and India’s lockdown has terminated nationwide
protests against the mistreatment of Muslims.3 The flipside is rising scapegoating of minorities or vulnerable
groups, especially when state resources are diverted to combat the pandemic.4 Moreover, the authoritarian
regimes may also use the global preoccupation with coronavirus as an opportunity to crush opposition. For example, the Myanmar military has stepped up its offensive against ethnic armed rebel groups in Rakhine, Chin, Karen and northern Shan state5, while the United Nations appeal for a global ceasefire to countervail
the escalation in violence.6 Some regimes have also used the global epidemic as an opportunity to stifle
democratic opposition. In Azerbaijan, members of the opposition have been locked up for allegedly violating a lockdown.7
The Covid-19 pandemic and the restriction policies have also negatively affected economic activity. For example, the contraction of China’s economy has been estimated to be 6.8% in the first quarter of 2020.8
In United States, a staggering 22 million people were rendered unemployed in a month since coronavirus was declared a national emergency.9 The effect of restrictions through the income mechanism is a priori
ambiguous. On the one hand, the current economic downturn may lead to more conflict, by reducing the individual opportunity cost of violence, protests and rebellions (Becker,1968;Grossman,1991;Dal Bó and Dal Bó,2011), and by hampering the capacity of the state to fight opponents or buy off opposition (Berman et al.,2011, Fearon and Laitin,2003a). On the other hand, states with more limited resources are less attractive “prizes” to be seized, which may lead to a decrease in conflict intensity (Bates et al.,2002;Besley and Persson,2010).10
In this paper, we provide real-time evidence on how enforcing restrictions to limit the spread of coronavirus
1
Shared responsibility, global solidarity: Responding to the socio-economic impacts of Covid-19 (UNSDG, March 2020, url).
2
Domestic violence has increased during coronavirus lockdowns (The Economist, April 22th, 2020, url).
3
Would-be autocrats are using Covid-19 as an excuse to grab more power (The Economist, April 23th, 2020, url).
4
For example, there have been a few incidents of physical violence against Muslims, in addition to hateful messages on social media, since it was discovered that a Muslim religious gathering was the source of many coronavirus cases (The Economist, April 23th, 2020, url). Among Rohingya refugee camps in Bangladesh coronavirus is being attributed as divine punishment for women’s “dishonorable acts" and not observing Purdah (veiling) (International Organization of Migration, April 19th, 2020, url).
5
Myanmar military steps up attacks as coronavirus spreads (AlJazeera, April 16th, 2020, url).
6
While some warring groups have responded to a call for ceasefire, in many of the most fragile situations there has not been any let up in fighting, and in some cases the fighting has intensified (UN.org, April 3rd, 2020), url).
7
Would-be autocrats are using Covid-19 as an excuse to grab more power (The Economist, April 23th, 2020, url).
8
CRU: China’s First Ever Negative Quarterly GDP Growth, Yahoo Finance (April 21th, 2020, url).
9
U.S. now has 22 million unemployed, wiping out a decade of job gains, Washington Post (April 16th, 2020, url).
10
One of the consequences of the current slowdown in economic activity is a collapse of the market for commodities, from agricultural to oil and mineral prices. Such drop of commodity prices may have multiple effects on conflict. Studying such effects is beyond the scope of this paper, in which we focus on the specific impact of Covid-19 related shutdown and lockdown policies.
Covid Economics
affects conflicts globally and how conflict dynamics may vary across types of events, actors and may also crucially depend on socio-economic context. We take advantage of the joint release of daily information on conflict events by the Armed Conflict Location and Event dataset, on the one hand, and on government policy responses by the Oxford Covid-19 Government Response Tracker, on the other hand, to estimate how conflict levels vary following shut- and lockdown policies. In our baseline estimations, we focus on policies imposing the closing of workplaces and schools, and restricting internal movements. We also consider in our robustness exercises “stay-at-home” policies specifically. Our results show that imposing a nation-wide restriction on mobility reduces the likelihood of daily conflict by 9 percentage points. We further explore the dynamics of conflict in response to a restriction and find that the reduction in likelihood is progressive, and stronger three to four weeks after the policy is implemented. We exploit additional information in our dataset to assess whether restrictions affect conflict events differently, based on their nature and on the type of actors involved. We find that such policies negatively affect battles, protests and violence against civilians. The negative effect is most conspicuous for protests. Across actors, the decline is significant for events that involve political militias, protesters or civilians. On the other hand, conflict involving state forces, rebel groups or identity militias do not show any significant decline. These results are robust across various measures of mobility restrictions policies, and hold when considering either conflict incidence or intensity (number of reported events).
We finally investigate whether country level characteristics mediate the effectiveness of restriction policies. We consider different characteristics that are identified in the literature as important features explaining conflict: ethnic and religious fractionalization, institutions (democracy, rule of law) and income (GDP per capita). Two main results emerge. First, conflict does not appear to significantly decrease post-restriction in countries with low GDP per capita, while it does in countries with relatively high income per capita. This difference appears to be mostly driven by a stronger drop in protests in the latter case. Second, and consistent with the scapegoating narrative mentioned above, we find that conflict does not decrease in countries with high religious fractionalization. This effect is mostly driven by events involving civilians, political militias and state forces. These results suggest that the negative effect of mobility restriction on conflict could be tempered by a rise in violence against the religious minorities.
We believe that our estimates of the extent of conflict reduction following shutdown policies are likely to be an upper bound. Collecting and reporting data on conflict events might become more difficult during shutdown periods, especially if states use these contexts to further repress the media. We would in this case overestimate the reduction in violence in repressive states. We consider this possibility explicitly by testing how the effect of shutdown policies varies with press and media freedom indices. We find no heterogeneous effect in that dimension; in addition, controlling for media freedom leaves unchanged our results on country characteristics. Hence, though the overall conflict reduction might be overestimated, such bias does not appear to be driving the cross-country heterogeneity we uncover.
Our paper contributes to the literature in several ways. We contribute to research on the consequences of Covid-19. Ongoing research has assessed the macroeconomic implications of Covid-19 (Atkeson,2020;
McKibbin and Fernando, 2020;Guerrieri et al.,2020), the role of climate, or mass media in spreading Covid-19 (Carleton and Meng,2020;Bursztyn et al.,2020). Notably, Chinazzi et al.(2020) study the effect of travel restrictions on the spread of Covid-19. In contrast, we provide first evidence for the effect of Covid-19 related mobility restrictions on global conflicts’ level. Next we contribute to the literature on infectious diseases and civil conflicts, which shows that health shocks due to infectious diseases can
Covid Economics
potentially cause civil conflicts (Cervellati et al.,2017). We instead highlight that policy response to an epidemic can have an unintended consequence for civil conflicts. We also contribute to the literature on the opportunity cost of organized political activity. These papers find that bad weather hampers political demonstrations by increasing the cost of individual participation (Madestam et al.,2013;Kurrild-Klitgaard,
2013). In a similar vein, we find that restriction policies have a particularly significant effect on reducing protests. Finally, our work relates to the literature on scapegoating of minorities during epidemics. Jedwab et al.(2019) find that Black Death mortality increased Jewish persecution, whileVoigtländer and Voth
(2012) show that Black Death pogroms created anti-Jewish sentiment that persisted over centuries. We provide suggestive evidence that the reduction in violence against civilians due to mobility restrictions may have been countervailed by a rise in violence against religious minorities in some countries.
The next section presents the data and our baseline research design. Section3discusses the results and their robustness, and section4concludes.
2
Data and empirical strategy
2.1 Data and stylized facts
Conflict. We use conflict event data from the Armed Conflict Location and Event dataset (Raleigh et al.,
2010, acled), as available on the acled webpage on April 28th, 2020. The data contain daily information on conflict events with specific details on the nature and the actors on both sides of the conflicts. Events are compiled from various sources, including press accounts from regional and local news, humanitarian agencies, and research publications.11 For the purpose of our analysis, we end up with 105 countries (see Online
Appendix TableA1.1for a full list of countries) from January 1st, 2016 to April 18th, 2020. We do not consider the last week of data (April 19-25, 2020), as it is likely that reporting of events for that week is still incomplete at the time we retrieved the data.12 We consider all types of conflict events in our estimations, regardless of whether they are described or not by acled as being directly related to the Covid-19.13 In our baseline estimates, we consider the daily incidence of any violent event, as well as the total number of violent events observed in each country. We also make use of two crucial features of the acled dataset. First, the data informs us on the nature of violence, i.e. whether the event is related to battles, remote violence, protests, riots, strategic development, and violence against civilians. Second, information are released on the different actors that are involved, such as state forces, rebel groups, political militias, identity militias, rioters, protesters, and civilians. Note that the acled data do not include information on who initiated the attack.
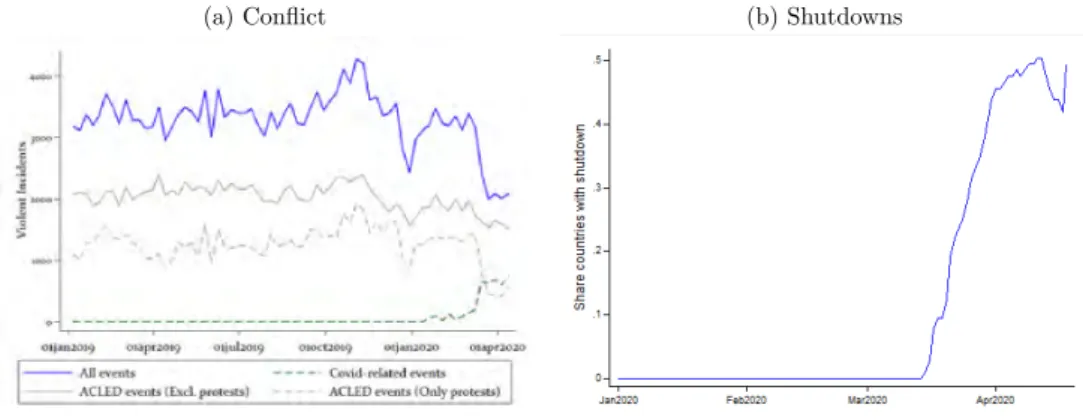
Figure1(a) displays the weekly number of events since January 1st, 2019. The total number of events
11
These data have been widely used in recent conflict literature, see for instanceBesley and Reynal-Querol(2014),Michalopoulos and Papaioannou(2016), andBerman et al.(2017).
12
acled is updated on a daily basis, but events are added retrospectively if they did not yet appear in the various sources immediately after they occur.
13
Though they account for a very small share of the observations, acled also reports information on ceasefire and peace agreement (acled sub-category “agreements” in the category “Strategic developments”) and other events which are not conflictual (acled sub-category “other" in the category “Strategic developments”; the example provided by acled for this type of event is the following: “President of Russia Vladimir Putin inaugurates the newly constructed bridge that connects Russia with the Kerch City of Crimea, four years after the annexation of Crimea”). We drop these events from the data before computing our conflict measures. In our period of study, they represent only 0.66% of the total number of events.
Covid Economics
dramatically declines from March 2020 onward. Mid-March 2020, it is 25% lower than the number of events at the same period of the previous year; in the first half of April 2020, it is 30 to 35% lower than in the first half of April 2019. The drop appears to be partly driven by protests, though even after excluding protests the conflict events fall by almost 25% in March-April 2020 compared to the previous year. Figure1(a) also plots the number of events that acled identifies as being related to Covid-19: those for which the words “Covid” or “Coronavirus” appears in the acled event description. At the end of our sample period, such
events represent more than a third of the total number of observed events.
Figure 1: Evolution of conflict events and shutdown policies
(a) Conflict (b) Shutdowns
Source: Authors’ computation from ACLED and OxGRT data.
19-related Policies. Information on the various governmental policies as a response to the Covid-19 outbreak are collected from the Oxford Covid-Covid-19 Government Response Tracker (OxCGRT) (Hale et al.,2020).14 OxCGRT systematically assembles information on several policy responses governments have implemented, using public sources such as official government press releases and newspaper articles. Data include information on eight measures of public policy responses: the closings of school, workplaces and public transport, travel restrictions (internal and international), limitations of public gatherings, and stay-at-home requirements. Note that latter two categories have been added on April 28th, 2020 and are still incomplete at the time this paper is written. Measures are ranked on a scale ranging from 0 (no measure) to 2, 3 or 4: 0 means no measure in place, 1 means that the measure is a recommendation, and 2 to 4 denote required measure of different scale.15 The OxCGRT data also contain information on whether the measure
is a national or a regional one.16
In this paper, we focus on all Covid-19 related policy responses, with an emphasis on measures that restrict mobility. Our estimations are based on three measures. First, we construct a binary restriction measure, which switches to 1 when governments have implemented national school and workplace closings as well as
14
Data were downloaded on April 29th, 2020.
15
For instance, in the case of schools, a value of 2 implies a required measure to close some part of the schooling system (only high schools, or only public schools), while a value of 3 implies a complete shutdown of the schools.
16
OxCGRT also provides a composite measure of the 7 indicators, the “stringency index”, including the seven government responses and their geographical coverage. The stringency index is built as the average measure of the eight policies, taking into account whether the policy is local or national, and rescaled between 0 and 100. We do not use this measure because some of the sub-categories are redundant for our research design. Finally, OxCGRT also includes some information about fiscal and monetary measures, and two Covid-19 related health policies (testing and contact tracing).
Covid Economics
restrictions on internal movements. We label this measure Shutdown. Our sample includes 62 countries with the enforcement of restriction measures between March 15th and April 18th (see Online Appendix Table
A1.2for the list of implementation dates by countries). On the other hand, 43 countries do not impose such measures (or only impose a part of these).
Second, we compute an index measure, hereafter labeled Narrow Index, which uses the same policy categories but takes into account the degree of requirement (no measure, recommended or required) as well as the geographical scope of the measure (local vs. national). We proceed in two steps. First, we recode each of the measure in the following order: i) recommendations, whether national or local, are coded as 1; ii) local requirements, are coded as 2; and iii) national requirements are coded as 3.17 Our index is then computed as
the sum of the three policy measures – closings of school, closing of workplaces and restrictions on internal movements – normalized on a scale between 0 and 1.
These two measures omit several categories available in the OxCGRT data: closing of public transport, restrictions to international travel, limitations of public gatherings and stay-at-home requirements. The closing of public transport is a redundant measure: when schools and workplaces are closed, and when there are restrictions on internal movements, public transport is already shut down. We also abstract from limitations on international travels as this measure entails some discrepancies. The last two measures – public gatherings and stay-at-home – are omitted from our baseline because they appear to be incomplete at the time of our data download (approximately 60% of the observations are missing). As a robustness, we therefore compute a more general index, labeled Broad Index, which takes into account all categories, with the exception of limitations on public gathering and stay-at-home measures. Also, we have recoded the stay-at-home measure to fill-in most of the missing observations18 and we consider the effect of this measure separately in our sensitivity exercises. Figure1(b) depicts the global move toward shutdown policies across the world in response of the Covid-19 crisis. Until mid-March, none of the countries in our sample have imposed a shutdown, based on our definition. Within a month since then, shutdown policies have affected about half of our sample of countries. FiguresA1.1in the Online Appendix show the evolution of our two indexes.
Country characteristics. In Section3, we study how country characteristics may explain heterogeneous effect of restriction policies across countries. We mainly focus on five country characteristics from the Quality of Government dataset, which compiles several country indicators from various publicly available sources (Teorell et al.,2020). First, we use two indicators of fractionalization that reflect the probability that two randomly selected individuals from a given country will not share a certain characteristic. The fractionalization variables can capture the relationship between ethnic cleavages and political instability or conflict that could exist across countries (Esteban and Ray,1994,1999;Montalvo and Reynal-Querol,
2005). Based on the year 2000, we are specifically interested at ethnic and religious fractionalization (Alesina et al.,2003). Second, we use two scores on the quality of institutions, namely the rule of law and the level of democracy. The latter is approximated using a combined imputed Polity-Freedom House index which ranges from 0 (least democratic) to 10 (most democratic). Rule of law measures the confidence in the rules
17
We do not consider the distinction between the different scales of requirements, i.e. values 2 and 4 of the policy measures, but assign a value of 2 to the all required measures at the local level and a value 3 for the national level.
18
More than 20% of the countries in OxCGRT contained a coded stay-at-home measure starting on April 18th, 2020 with missing observations beforehand. Sources provided by OxCGRT and online searches (newspaper articles and official sources retained) were used to assess the exact date of implementation of stay-at-home policies, without making changes to the OxCGRT coding.
Covid Economics
of society by including perceptions on crime, the judiciary system and enforceability (Worldwide Governance Indicators,World Bank Group et al.(2010)). These variables capture any difference in conflict levels across countries that could be due to the underlying institutions (Fearon and Laitin,2003b;Collier and Rohner,
2008). Last, we use GDP per capita as a measure of economic development (World Bank Group et al.,2010). All measures except the fractionalization ones are averaged between 2016 and 2019.
Descriptive statistics. TableA1.3in the Online Appendix provides summary statistics for all variables used in the paper. Over the four conflict events that are reported daily in our sample period, protests are the most common form, followed by battles. This pattern is also reflected in the actor types: conflict events that involve state forces, protesters or rebel groups are most preponderant. Given that acled primarily focuses on developing countries, unsurprisingly, the countries included in our sample exhibit lower GDP per capita (about 6,800 current USD, compared to a world average of 14,000 over the period), democracy scores (4.9, as compared with a cross-country average of 6.4 at the world level), rule of law indexes (-0.46, -0.1 at the world level) than the world average; on the other hand, the levels of ethnic and religious fractionalization are more comparable to the world average (0.53 and 0.43 in our sample versus 0.44 and 0.44 at the world level).
2.2 Empirical strategy
Baseline equation. Our aim is to estimate how restriction policies in country i at day t contemporaneously affect conflict. We estimate the following baseline specification:
Conflictit= βRestrictionsit+ ηc+ µym+ εit, (1)
where Conflictitis our conflict variable at the country-day level, being measured in terms of incidence (i.e. a
binary variable coding for non-zero events) in our baseline estimates. We also report results using conflict intensity, defined as the total number of violent events in a day. Restrictionsit is our measure of restrictions
at country-level - the binary Shutdown measure is used as baseline, and we systematically check the results using the Narrow Index and Broad Index measures. Finally, ηcand µymare country and year-month fixed
effects, respectively. ηcaccounts for any time-invariant or slow-moving country characteristics, such as
political system, institutions, or culture, that may affect conflict; µymcaptures common year-month shocks,
in particular the global spread of Covid-19 that correlates with lockdown policies, and worldwide seasonality in conflict incidence. In our baseline estimates we use a linear probability model, with standard errors clustered at the country level. When using the number of conflict events as a dependent variable, we use a Poisson pseudo maximum likelihood estimator.
Additional exercises and robustness. We perform several additional exercises. First, we evaluate the post-shutdown dynamics of violence by including weekly leads and lags of our binary Restrictionsit. Second,
we consider separately each of the acled category of events and actors (see Online Appendix TableA1.3
for a list of types of events and actors). Finally, we test whether our estimates of β vary across countries with different characteristics, by interacting our measure of Covid-19-related policies with binary indicators denoting that the country-specific indicator falls below or above the sample median.
Covid Economics
3
Results
Baseline estimates. Table1displays the main estimates. Our binary measure of restrictions is negatively correlated to the incidence of conflict. The point estimate suggests that shutdowns are associated with a 9 percentage point drop in conflict incidence (column 1), and with 0.27 fewer events, e.g. a 6.5% drop in the total daily number of conflict events (column 2). Results are similar to the use of our alternative policy measures, Narrow index and Broad index (columns 3 and 4, respectively). Quantitatively, a one standard deviation increase in the indexes (-0.136 and -0.135, respectively) is associated with a decrease in conflict incidence range from 5.1 percentage points (column 3) to 5.5 percentage points (column 4). Overall, the results in Table1confirm the descriptive pattern shown in Figure1: shutdown policies are associated with a lower incidence and intensity of conflict.
We perform two robustness exercises on these aggregate results. First, we control for linear country specific time trends to allow for unobserved country-specific conflict propensities to trend linearly over time. Despite our short-time period, this demanding specification leaves our results broadly unchanged (Table A2.4). Second, we perform a placebo analysis, by randomly permuting the dates of implementation of our restriction measure Shutdown (binary) for each country in the sample. We estimate equation (1) with our permuted restriction. FigureA2.2plots the sampling distribution of our coefficient of interest, for which we repeat the estimation 1,000 times. Most of the estimates with permuted dates are not significant and far from our main estimate.
Table 1: Baseline Results
(1) (2) (3) (4) (5)
Dep. var. (conflict) Incidence Intensity ——— Incidence ——— Policy restrictions measure Shutdown (binary) Narrow index Broad index Shutdown
Policy restriction -0.093*** -0.273* -0.185*** -0.201*** -0.149** (0.030) (0.165) (0.034) (0.036) (0.074)
× Press Freedom Index -0.001
(0.002)
Observations 122,099 122,099 122,099 122,099 117,794
R-squared 0.482 0.482 0.482 0.478
Model OLS PPML OLS OLS OLS
Country FE ——— Yes ———
Month-year FE ——— Yes ———
Note: ∗significant at 10%;∗∗at 5%;∗∗∗at 1%. Standard errors are clustered at the country level. Conflict incidence is a variable that takes the value 1 if at least one conflict event is recorded in the country a given day. Conflict intensity is the number of events observed in the country a given day. See main text for the definition of the various restriction measures. Table
A1.3in the online appendix contains descriptive statistics about each variable used in the estimation. Press Freedom Index is the average of the press freedom index from Reporters Without Borders over the 2016-2019 period, as provided in the Quality of Government dataset.
Freedom of press and reporting bias. Since the beginning of Covid-19 pandemic, Reporters Without Borders (RSF) have been monitoring the impact on journalism. Through anecdotal evidence, they document
Covid Economics
state censorship, disinformation, and negative consequences on the right to reliable news.19 These effects are
argued to be more prominent in countries where media independence and pluralism or respect for freedom of press was rather low before the pandemic.20 Transposed to our research question, this might imply that
countries with a low level of press freedom exhibit bias in the reporting, which would imply a downward bias in our estimates of the effect of restrictions policies: with fewer events reported, we would overestimate the conflict-reducing impact of shutdown policies. In column (5) of Table1, we indirectly test for the existence of such reporting bias by interacting our baseline policy variable with a pre-shutdown measure of press freedom: the average of the press freedom index from Reporters Without Borders over the 2016-2019 period, as provided in the Quality of Government database.21 The coefficient is negative – the opposite sign as
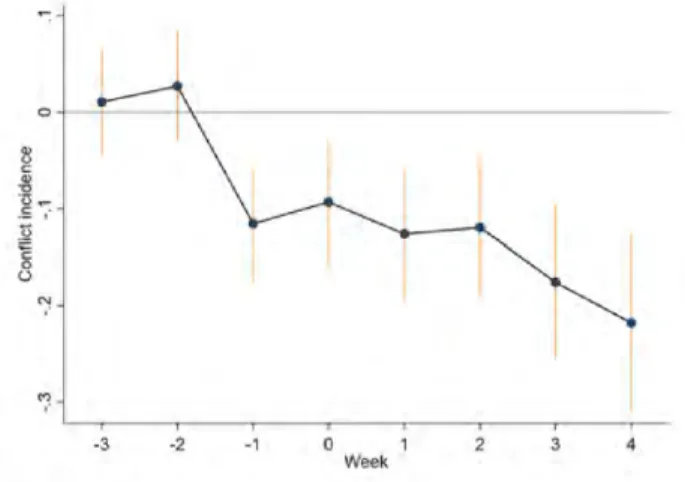
the one we would expect according to the narrative above – and far from statistical significance (p-value of 0.44). Hence, the effect of shutdown policies on the quality of reporting does not appear to vary significantly across countries with different degrees of press freedom. Reporting bias may however still be an issue in our context, even if it is distributed homogeneously across countries. For this reason, our estimates are likely to be an upper bound of the conflict-reducing effect of shutdown policies, and should be considered as such. Post-shutdown dynamics of violence. Our results of Table 1 are silent on the dynamic and the persistence of violence during the weeks following the implementation of the restrictions. We slightly modify equation1by allowing the effect of restrictions to vary across time, around the implementation date. Figure
2displays the estimates. The specification is demanding because of the short period under consideration following the restrictions, still, a pattern emerges. There is a noticeable decline in violence a week before the restriction is imposed. This indicates that actors involved in violence were already adjusting their behavior due to the spread of Covid-19 (or in anticipation of the policy change). Following the restriction, the reduction in conflict incidence is gradual, and stronger three to four weeks after the policy is implemented.
Figure 2: Timing of Shutdown and Conflict Incidence
Note: This figure plots the coefficients of TableA2.5in appendix, together with 90% confidence intervals.
19
A real time update of Covid-19 related violations are compiledhere.
20
Reporters Without Borders use anecdotal evidence in the 2020 World Press Freedom Index to highlight a correlation between press freedom violations related to the coronavirus epidemic and the ranking in the Index. url.
21
The press freedom index measures countries on a scale of 0-100, with 100 representing countries with the least press freedom. We inverse the measure, a higher score indicating greater press freedom, to ease interpretation.
Covid Economics
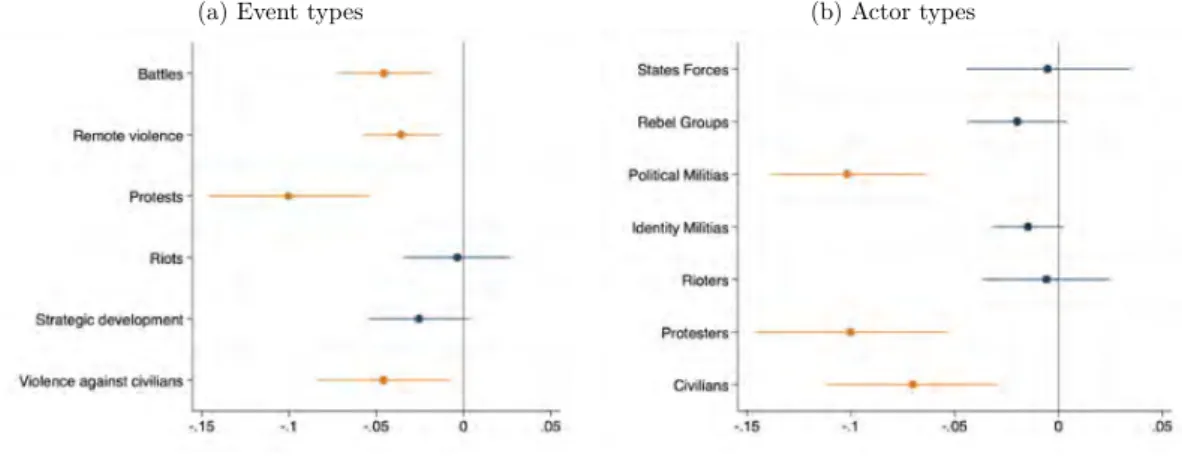
Types of events. A crucial feature of the acled data is to inform us on the nature of violent events. We replicate column (1) of Table1for every single type of events: battles, remote violence, protests, riots, strategic development, and violence against civilians. Figure 3(a) displays the point estimate for each category. Shutdown policies are negatively correlated to battles, remote violence, protests and violence against civilians. The effect is most significant for protests which decline by over 10 percentage points. The significant decline in protests is plausibly due to shutdown measures increasing the cost of individual participation in an activity where the benefit is shared by all sympathizers, irrespective of their participation (Kurrild-Klitgaard,2013). Using of a PPML estimator and of our two alternative indexes of restrictions delivers similar results (Online Appendix SectionA3).
Figure 3: Estimates across types of events and actors
(a) Event types (b) Actor types
Note: These figures estimate the effect of our baseline measure of restriction policy (Shutdown) on different types of conflict events and on conflicts involving different types of actors. The OLS coefficients and standard errors appear in TablesA3.6and
A4.10in the online appendix. The dependent variable is conflict incidence.
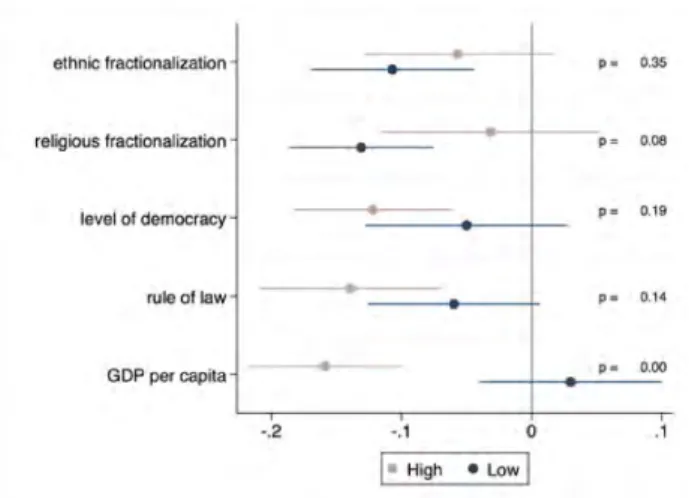
Type of Actors. acled data also records information on the types of actors that are involved in each of the violent event. We use this information to estimate equation1, assessing the daily level of violence by actors. Strikingly, political militias, protesters and civilians are the actors for which there is a decrease of violence. For the other categories of actors – state forces, rebel groups, identity militias and rioters –, restrictions have a negative but statistically insignificant effect on the level of conflict. In the Online Appendix SectionA4, we estimate whether these results are robust to using conflict intensity and our alternative policy indexes. Country characteristics. We finally explore whether countries are heterogeneous in the way they react to the implementation of restriction policies. We define a binary variable equal to 1 when a country’s pre-sample (2016-2019) characteristic is above the sample median. We estimate equation1allowing the effect of shutdowns to be heterogeneous for the two groups of countries, namely those above and below the sample median. Figure4plots the estimates and the p-value of the difference between the two.
First, countries with a higher level of ethnic fractionalization do not seem to behave significantly differently to those with lower level of fractionalization (though they do in a number of our robustness exercises, see below). However, countries with high level of religious fractionalization do not exhibit a reduction in the level of violence, but do for countries with a low level (the difference between the two is different from 0).
Covid Economics
Figure 4: Country characteristics
Note: These figures estimate the effect of our baseline measure of restriction policy (Shutdown) on different overall daily conflict incidence, as a function of country characteristics. Lines represent 90% confidence bands. The Shutdown variable is interacted with a dummy which takes the value 1 if the country characteristic is above the sample median. The p-values of the difference in the coefficient between the high and low groups appear next to the coefficients. TableA5.14in the online appendix provides the full estimates.
Second, the level of violence in countries below the median level of democracy score is not decreasing while it is in countries above the median (the difference between the two is different from 0). Third, we evaluate whether countries may react differently along a measure of rule of law. We fail to detect any significant differences between the two groups of countries. Last, we find that countries above the GDP per capita median are those for which the decrease of violence is the highest but positive and significant for those below. Overall, countries with a higher level of religious fractionalization, lower level of democracy and higher poverty are those for which the restriction policies either do not reduce or in some cases even increase violence. These results are confirmed when using conflict intensity instead of incidence as a dependent variable, and the non-binary policies indexes, though in some cases, the effect of ethnic, rather than religious, fractionalization appears more significant.22
Next, we assess if restriction policies have a heterogeneous effect across countries depending on the nature of event or of the actors involved (Tables are displayed in Online Appendix SectionA5.3). We find that countries with high level of religious fractionalization do not experience a reduction in violence against civilians, whereas countries with low levels of religious fractionalization experience a significant decline in such type of violence (FigureA5.19). This effect is mostly driven by events involving civilians, political militias and state forces. Further, the heterogeneity of conflict responses with respect to income (GDP per capita) is mostly driven by the dynamics of protests (FigureA5.22).
The impact of stay-at-home policies. We consider the specific effect of the stay-at-home policies on conflict. We construct a binary restriction measure, which switches to 1 when governments have implemented
22
We did not find evidence of cross-country heterogeneity in reporting bias using a press freedom index in Table1, column (5), which suggest that these cross-country results are unlikely to be driven by differences in reporting. Still, we further show in the Online AppendixA5that controlling for an interaction term between the shutdown measure and (demeaned) press freedom to account leaves the results of Figure4unchanged (FigureA5.10).
Covid Economics
a nationwide stay-at-home policy. Further we adjust our Broad index variable to include that policy, taking into account, in the same way as for the other component, the severity of the home stay policy, based on the degree of requirement (no measure, recommended or required) and its geographical scope (local vs. national). The results are presented in TableA6.18in the Online Appendix. The results broadly confirm that stay-at-home policies reduce violence, though the decline is smaller both in size and in statistical significance than in our baseline estimations. Consistent with our previous findings however, we find that protests decline significantly in response to stay-at-home restrictions (Figures A6.23and TablesA6.19). Interestingly, cross-country differences appear more significant in this case: in countries with above median levels of religious fractionalization and in countries with low income per capita, we find that conflict levels actually increase significantly following such lockdown policies. This important cross-country heterogeneity explains the weaker average results found when averaging the effect across countries.
Discussion. Overall, our results can be summarized as follows. First, most of the conflict reduction following shutdown policies is observed for protests, though some significant effect is also found for violence against civilians and battles. Second, conflicts that are found to decline involve political militias, protesters and civilians, but we do not find any significant reductions in events involving state forces, rebel groups and identity militias. Third, the cross-country analysis reveals that differences in levels of fractionalization – mostly religious – and GDP per capita create different responses of conflict to restriction policies (and, to a lesser extent, rule of law): conflict declines more in countries with above median GDP per capita, and below median fractionalization measures. The underlying types of conflict are however quite different in each case: while GDP per capita appears to play a role mostly through protests events, fractionalization affect events involving state forces and civilians.
Overall these results points to several potential mechanisms through which Covid-19 related restrictions might be impacting conflict. First, by reducing mobility, such restrictions impact individual mobilization capacity, which explains the decline in the protests worldwide. However, this reduction in the number of protests is not observed in countries with very low income, which suggests that the economic effect of shut-and lockdown policies might trigger additional (mostly peaceful) conflict. This effect might also relate to the fact that shutdown policies limit the capacity of low-income states to fight against the opposition (Berman et al.,2011). Second, we find consistent evidence that shutdown policies have an ambiguous effect on violence against civilians in more fractionalized countries. This indicates that the negative effect of mobility restriction on violence could be tempered by a rise in inter-religious and inter-ethnic violence. This result is in line with the literature which suggests that epidemics can intensify underlying ethnic or religious tensions and lead to scapegoating of minorities (Jedwab et al.,2019;Voigtländer and Voth,2012).
4
Conclusion
In this paper, we provide real-time evidence of how enforcing restrictions to limit the spread of coronavirus affects conflicts globally. Our results show that imposing nation-wide shutdown of economic activities and mobility restriction reduces the likelihood of daily conflict by 9 percentage points. The conflict reduction is particularly strong for protest, though other types of events – battles or violence against civilians – also decline to some extent. Interestingly, our results show that conflict has not reduced in every country, and that socio-economic characteristics play an important role in driving the conflict response to Covid-19
Covid Economics
restrictions policies. In the most fractionalized countries, in particular, restriction policies have an ambiguous effect, and violence against civilians, involving political militias and state forces, show no decline.
Our work is only a first step to try to understand how Covid-related policies might impact conflict. Given the preliminary nature of the data, and the short time span currently available, more work is surely needed. Many important dimensions of the conflict-covid nexus are not considered in our analysis. For instance, future research could try to further explore cross-country heterogeneity in conflict responses, and consider within-country characteristics, such as urbanization and local income levels. Given the current collapse in many commodity markets, how natural resources rich regions react to the spread of the virus is surely an important question to study as well.
Covid Economics
References
Alesina, A., A. Devleeschauwer, W. Easterly, S. Kurlat, and R. Wacziarg (2003). Fractionalization. Journal
of Economic growth 8 (2), 155–194.
Atkeson, A. (2020). What will be the economic impact of covid-19 in the us? rough estimates of disease scenarios. Technical report, National Bureau of Economic Research.
Bates, R., A. Greif, and S. Singh (2002). Organizing violence. Journal of Conflict Resolution 46 (5), 599–628. Becker, G. S. (1968). Crime and punishment: An economic approach. In The economic dimensions of crime,
pp. 13–68. Palgrave Macmillan, London.
Berman, E., J. N. Shapiro, and J. H. Felter (2011). Can hearts and minds be bought? the economics of counterinsurgency in iraq. Journal of Political Economy 119 (4), 766–819.
Berman, N., M. Couttenier, D. Rohner, and M. Thoenig (2017). This mine is mine! how minerals fuel conflicts in africa. American Economic Review Volume 107.
Besley, T. and T. Persson (2010). State capacity, conflict, and development. Econometrica 78 (1), 1–34. Besley, T. and M. Reynal-Querol (2014). The legacy of historical conflicts: Evidence from africa. American
Political Science Review 108 (2), 319–336.
Bursztyn, L., A. Rao, C. Roth, and D. Yanagizawa-Drott (2020). Misinformation during a pandemic.
University of Chicago, Becker Friedman Institute for Economics Working Paper (2020-44).
Carleton, T. and K. C. Meng (2020). Causal empirical estimates suggest covid-19 transmission rates are highly seasonal. medRxiv.
Cervellati, M., U. Sunde, and S. Valmori (2017). Pathogens, weather shocks and civil conflicts. The Economic
Journal 127 (607), 2581–2616.
Chinazzi, M., J. T. Davis, M. Ajelli, C. Gioannini, M. Litvinova, S. Merler, A. P. y Piontti, K. Mu, L. Rossi, K. Sun, et al. (2020). The effect of travel restrictions on the spread of the 2019 novel coronavirus (covid-19) outbreak. Science 368 (6489), 395–400.
Collier, P. and D. Rohner (2008). Democracy, development, and conflict. Journal of the European Economic
Association 6 (2-3), 531–540.
Dal Bó, E. and P. Dal Bó (2011). Workers, warriors, and criminals: social conflict in general equilibrium.
Journal of the European Economic Association 9 (4), 646–677.
Esteban, J. and D. Ray (1999). Conflict and distribution. Journal of Economic Theory 87 (2), 379–415. Esteban, J.-M. and D. Ray (1994). On the measurement of polarization. Econometrica: Journal of the
Econometric Society, 819–851.
Fearon, J. and D. Laitin (2003a). Ethnicity, insurgency and civil war. American Policial Science Review 97 (1), 75–90.
Covid Economics
Fearon, J. D. and D. D. Laitin (2003b). Ethnicity, insurgency, and civil war. American political science
review 97 (1), 75–90.
Grossman, H. I. (1991). A General Equilibrium Model of Insurrections. The American Economic Review 81 (4), 912–921.
Guerrieri, V., G. Lorenzoni, L. Straub, and I. Werning (2020). Macroeconomic implications of covid-19: Can negative supply shocks cause demand shortages? Technical report, National Bureau of Economic Research.
Hale, T., A. Petherick, T. Phillips, and S. Webster (2020). Variation in government responses to covid-19 version 4.0. blavatnik school of government working paper. april 7, 2020.
Jedwab, R., N. D. Johnson, and M. Koyama (2019). Negative shocks and mass persecutions: evidence from the black death. Journal of Economic Growth 24 (4), 345–395.
Kurrild-Klitgaard, P. (2013). It’s the weather, stupid! individual participation in collective may day demonstrations. Public Choice 155 (3-4), 251–271.
Madestam, A., D. Shoag, S. Veuger, and D. Yanagizawa-Drott (2013). Do political protests matter? evidence from the tea party movement. The Quarterly Journal of Economics 128 (4), 1633–1685.
McKibbin, W. J. and R. Fernando (2020). The global macroeconomic impacts of covid-19: Seven scenarios.
Covid Economics 10.
Michalopoulos, S. and E. Papaioannou (2016). The Long-Run Effects of the Scramble for Africa. American
Economic Review 106 (7), 1802–1848.
Montalvo, J. G. and M. Reynal-Querol (2005). Ethnic polarization, potential conflict, and civil wars.
American economic review 95 (3), 796–816.
Raleigh, C., A. Linke, H. Hegre, and J. Karlsen (2010). Introducing ACLED: an armed conflict location and event dataset: special data feature. Journal of peace research 47 (5), 651–660.
Teorell, J., S. Dahlberg, S. Holmberg, B. Rothstein, P. Alvarado, and S. Alelsson (2020). The Quality of Government Standard Dataset. The Quality of Government Institute University of Göteborg. Göteborg. Voigtländer, N. and H.-J. Voth (2012). Persecution perpetuated: the medieval origins of anti-semitic violence
in nazi germany. The Quarterly Journal of Economics 127 (3), 1339–1392.
World Bank Group, D. Kaufmann, A. Kraay, and M. Mastruzzi (2010). Worldwide governance indicators. World Bank Group.