HAL Id: hal-02561770
https://hal.archives-ouvertes.fr/hal-02561770
Submitted on 25 Jun 2020
HAL is a multi-disciplinary open access
archive for the deposit and dissemination of
sci-entific research documents, whether they are
pub-lished or not. The documents may come from
teaching and research institutions in France or
abroad, or from public or private research centers.
L’archive ouverte pluridisciplinaire HAL, est
destinée au dépôt et à la diffusion de documents
scientifiques de niveau recherche, publiés ou non,
émanant des établissements d’enseignement et de
recherche français ou étrangers, des laboratoires
publics ou privés.
Hyaluronic acid presentation at the surface of
self-assembled nanoparticles transforms a hyaluronidase
HYAL1 substrate into an efficient and selective inhibitor
Haohao Duan, Mark Donovan, Franck Hernandez, Carmelo Di Primo,
Elisabeth Garanger, Xavier Schultze, Sébastien Lecommandoux
To cite this version:
Haohao Duan, Mark Donovan, Franck Hernandez, Carmelo Di Primo, Elisabeth Garanger, et al..
Hyaluronic acid presentation at the surface of self-assembled nanoparticles transforms a hyaluronidase
HYAL1 substrate into an efficient and selective inhibitor. Angewandte Chemie International Edition,
Wiley-VCH Verlag, 2020, 59 (32), pp.13591-13596. �10.1002/anie.202005212�. �hal-02561770�
COMMUNICATION
author manuscript of article in Angew. Chem.-Int. Ed. 2020
DOI 10.1002/anie.202005212
Hyaluronic acid presentation at the surface of self-assembled
nanoparticles transforms a hyaluronidase HYAL1 substrate into
an efficient and selective inhibitor
Haohao Duan,
[a,b]Mark Donovan,
[b]Franck Hernandez,
[b]Carmelo Di Primo,
[c]Elisabeth Garanger,
[a]Xavier Schultze*
[b]and Sébastien Lecommandoux*
[a]Abstract: In this study, an original method of macromolecular design was used to develop a hyaluronidase-1 (HYAL1) inhibitor from its principal substrate, hyaluronic acid (HA). HA-based nanoparticles (HA-NP) were obtained by copolymer self-assembly and their effects on HYAL1 activity were investigated by combining different analytical tools. Compared to HA, HA-NP exhibited an enhanced stability against HYAL1 degradation while maintaining its interaction with HA receptors CD44 and aggrecan. HA-NP displayed a strong and selective inhibition of HYAL1 activity and retarded the hydrolysis of higher molar mass HA in solution. A co-nanoprecipitation process was used to formulate a range of hybrid nanoparticle samples, which demonstrated the specificity and efficiency of HA-NP in HYAL1 inhibition.
Hyaluronic acid (HA) is one of the main components of extracellular matrix (ECM) and is also abundant in tissues such as skin and synovial fluid[1]. HA is widely used as a building
block to form hydrogels for tissue engineering and plastic surgery[2]. The hydrophilicity and polyelectrolyte nature of HA (i.e.
the osmotic pressure of counterions) in water is well known to provide efficient volume expansion to dermis and fascia. As a key component of ECM, HA, when injected, has a good intrinsic biocompatibility which is very convenient to avoid secondary effects such as sensitizing or inflammation[3]. HA also has
important roles in cell processes by interacting with proteins like
CD44, aggrecan, stabilin-2 and LYVE-1[4]. Among the HA
receptors, CD44 attracts intensive attention of researchers because of its overexpression in cancer cells and tumors[5]. As
the principal ligand of CD44, HA is widely used for nanomaterial design and drug delivery to target cancer cells[6]. The native
ECM in tissues is highly dynamic with constant matrix turnover. As one of the main components of ECM, endogenous HA is continuously synthesized by hyaluronic acid synthases and enzymatically degraded by hyaluronidases to maintain a stable HA level in tissues[7]. Hyaluronidase is expressed in a range of
cancer cells and is involved in different steps of tumor
metastasis[8].
In healthy human skin the half-life of HA in the dermis is less than one day[9], and about 2-3 hours in the epidermis[10].
Exogenous HA delivered by fillers or nanomaterials is assimilated overtime during tissue renewal. However, one of the main drawbacks of HA-based fillers is their limited longevity[11].
The hydrolysis of HA in delivery systems directly contributes to their assimilation and the release kinetics of encapsulated payloads[12]. Various types of hyaluronidases exist in nature,
HYAL1 being the predominant one in ECM, expressed in keratinocytes and fibroblasts of human skin[13]. HYAL1 is
involved in the biological processes such as angiogenesis[14] and
skin photo-ageing[15]. We have previously designed HA-based
micelles and vesicles, resulting from the controlled self-assembly of amphiphilic copolymers [16]. HA-based nanoparticles
(HA-NP) demonstrated a strong interaction with CD44, targeting and delivering the encapsulated drug payload to CD44 expressing cancer cells. Using surface plasmon resonance experiments, we have also recently demonstrated that HA-NP can selectively and efficiently target CD44 due to a multivalent presentation of HA at the surface of particles, significantly enhancing its intrinsic activity[17].
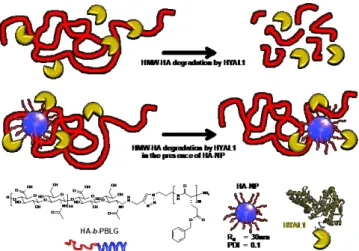
Figure 1. Schematic representation of the effect of degradation of high molar
mass HA (HMW_HA) by HYAL1 with or without HA-NP. In the presence of HA-NP, inhibition of HYAL1 protects high molar mass HA from enzymatic degradation.
Considering the use of such HA-NP in a biologically relevant context, it is critical to elucidate its interaction with hyaluronidases, especially HYAL1 (Figure 1). We demonstrated that the activity of HYAL1 could be significantly inhibited by the presence of HA-NP using a combination of different methods, correlating molecular and biological effects. These unexpected
[a] Dr. Haohao Duan, Dr. Elisabeth Garanger, Prof. Dr. Sébastien Lecommandoux
Univ. Bordeaux, CNRS, Bordeaux INP, LCPO, UMR 5629, F-33600, Pessac, France
E-mail: Lecommandoux@enscbp.fr
[b] Dr. Mark Donovan, Mr. Franck Hernandez, Dr. Xavier Schultze L’Oréal recherche avancée,
1 avenue Eugène Schueller, 93600, Aulnay-sous-Bois, France [c] Dr. Carmelo Di Primo
Univ. Bordeaux, ARNA Laboratory, INSERM U1212 - CNRS UMR 5320, IECB, 2 rue Robert Escarpit, F-33600 Pessac, France Supporting information for this article is given via a link at the end of the document.
COMMUNICATION
author manuscript of article in Angew. Chem.-Int. Ed. 2020
DOI 10.1002/anie.202005212
and original observations clearly evidenced that the presentationof HA at the surface of nanoparticles could transform a substrate into an efficient inhibitor that even out-performed state-of-the-art hyaluronidases’ inhibitors in our assays.
HA-NP with a hydrodynamic radius of 30 nm and low dispersity (PDI 0.1) were obtained from the self-assembly of HA-b-poly(γ-benzyl L-glutamate) HA-b-PBLG amphiphilic block copolymers. In these copolymers, we used HA-5kDa (Lifecore Biomedical research grade) with a molar mass MW = 5600 g/mol (Đ = 1.4) corresponding to a repetition of about 14 disaccharide units. HYAL1 activity was then measured as a function of the enzymatic degradation of high molar mass HA (HA-1000kDa corresponding to a molar mass of 1000kDa). Four analytical methods were used to distinguish HA of different molar mass (MW): (1) surface plasmon resonance (SPR) to study the
interaction between HA and CD44[18]; (2) enzyme-linked
immunosorbent assay (ELISA) to measure the interaction between HA and aggrecan; (3) size exclusion chromatography-multi-angle laser light scattering (SEC-MALLS) to identify HA MW distribution in a sample by size exclusion and (4) viscosimetry to follow the decrease in viscosity during degradation of HA. The sensitivity of each technique to detect HA degradation depends on the range of HA MW (Figure S-2). HA MW can be reduced from over 1000kDa to less than 5kDa during degradation by HYAL1. Consequently, only the combination of the four techniques gives a global observation on the hydrolysis process. An experimental protocol to follow the enzymatic degradation of HA by HYAL1 and other hyaluronidases used in this study, called the standard degradation condition, was established (corresponding to a mass ratio between HA MW and HYAL1 of 200/1; details in
Supp. Info.). The degradation of high molar mass HA by a
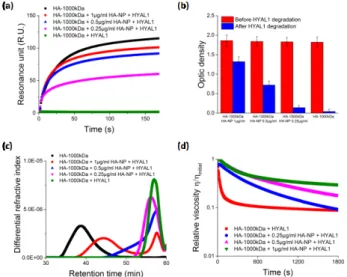
human recombinant HYAL1 in this condition can be observed by a complete loss of binding of HA-1000kDa to CD44 (Figure 2-a) and aggrecan (Figure 2-b) as measured by SPR and ELISA respectively and a sharp decrease of HA solution viscosity (Figure 2-d) during hydrolysis. SEC-MALLS analyses confirmed that the MW of HA decreased from 1000kDa to 1.6kDa after hydrolysis by HYAL1 during 20 minutes (Figure 2-c).
Figure 2. HA-1000kDa (red coil) hydrolysis in presence of HYAL1 (pac-man)
observed with (a) SPR, (b) ELISA, (c) SEC and (d) viscosimetry. Note that the timescale in (a) refers to the SPR analysis time and in (d) to the in situ monitoring of the HA degradation by HYAL1 over time as followed by viscosimetry.
The effect of HA-NP degradation, presenting low MW HA-5kDa at its surface, by HYAL1 was analyzed in the same conditions (HA on the NP/HYAL1=200/1 in weight). After incubation with HYAL1 (figure 3-a and figure 3-b), the ability of HA-NP to bind CD44 and aggrecan respectively measured by SPR and ELISA is significantly preserved. Even in the presence of higher levels of HYAL1 (2X and 4X), HA-NP are still able to efficiently bind CD44 and aggrecan. This suggests that HA-NP resisted HYAL1 degradation and partially maintained its interaction with CD44 and aggrecan. The HA-NP were characterized by dynamic light scattering (DLS) and transmission electron microscopy (TEM) before and after incubation with HYAL1. No significant change was observed as shown in figure 3-c and figure 3-d. It is hence clear that the HA-NP displayed a good stability against HYAL1 degradation in contrast to linear high molar mass HA. The stability of HA-based nanomaterials in the presence of hyaluronidases is then probably dependent on their chemical composition and morphology. Other nanostructures based on
HA-b-poly(lactic acid) (HA-b-PLA)[12b] and
HA-b-polycaprolactone (HA-b-PCL)[12a] did not seem however to
display significant resistance against hyaluronidase, as they lost their initial morphology and payload release was triggered during enzymatic degradation.
Figure 3. Stability of HA-NP against HYAL1 degradation observed by (a) SPR,
(b) ELISA, (c) TEM and (d) DLS
The enzymatic degradation of HA-1000kDa by HYAL1 in the presence of HA-NP was then studied. Small amounts of HA-NP (0.25, 0.5, 1 µg/mL) were added into the HA-1000kDa solution (50 µg/mL). In the absence of HYAL1 all the samples containing HA-1000kDa and HA-NP exhibited similar profiles in SPR (Supp. Info) and ELISA (Figure 4-b) assays. This implies that the HA-NP concentrations used in the assay had negligible contribution to the SPR and ELISA signals that were dominated by HA-1000kDa. While HA-1000KDa is fully degraded by HYAL1 as evidenced by the disappearance of SPR and ELISA signals, the binding with CD44 and aggrecan is maintained in the presence of HA-NP (Figure 4-a and 4-b). The analyses demonstrated that HA-NP inhibited HYAL1 in a dose-dependent manner. This dose effect was further confirmed by SEC-MALLS and viscosimetry. HA-1000kDa in the absence of HA-NP was fully hydrolyzed to small MW 1.6kDa fragments (Figure 4-c,
COMMUNICATION
author manuscript of article in Angew. Chem.-Int. Ed. 2020
DOI 10.1002/anie.202005212
green curve). With 0.25 µg/mL (pink curve) and 0.5 µg/mL (bluecurve) of HA-NP, large molar masses distributions were observed at high retention times corresponding to low amount of small MW fragments. When 1 µg/mL of HA-NP was used, a significant fraction of HA over 100kDa was even conserved along with small HA fragments, thus giving a bimodal curve (red curve). Interestingly, the effect of HA-NP on HYAL1 activity could be followed in real-time by viscosimetry. As illustrated in Figure 4-d, increasing amounts of HA-NP in the solution significantly reduced the loss of HA viscosity resulting from enzymatic degradation.
Figure 4. Dose effect of HYAL1 inhibition by HA-NP observed by (a) SPR, (b)
ELISA, (c) SEC-MALLS, (d) viscosimetry and (e) HYAL1 capture and inhibition by HA-NP. HA-1000kDa (50 µg/mL), HYAL1 (0.25 µg/mL).
Taken together the results from the four techniques, unambiguously confirmed the inhibitory effect of HA-NP on HYAL1. The macromolecular design by self-assembly surprisingly “transformed” HA, the principal substrate of HYAL1, into an efficient inhibitor of the enzyme. The position of HA on the nanoparticle surface is likely to implicate HA as the key actor in the inhibition process. Since the local concentration of HA on the nanoparticle surface was approximately 100-fold higher compared to the HA-1000kDa (Supp. Info.), one can hypothesize that HYAL1 preferentially associates with HA-NP by interacting with HA moieties on their surface. In this way, HA-NP captured HYAL1 and retarded the enzymatic degradation of HA-1000kDa.
To confirm this hypothesis, we first evaluated the interaction of HA-NP with HYAL1 by SPR. HYAL1 was immobilized on the sensor chip surface and HA-NP was injected at increasing concentrations (3,6, and 12µg/mL, Figure 5). The green sensorgram unambiguously demonstrates the interaction of HA-NP with HYAL-1. Furthermore, this interaction was so strong that dissociation of the Hyal1/HA NP complex proved incomplete even by using strong regenerant (SDS, NaOH/NaCl, Figure S-5). As a comparison, PEG-NPs obtained by the nanoprecipitation of PEG-b-PBLG (Supp. Info.), did not interact with HYAL1 as evidenced by the red curve in Figure 5. The PEG-NP sensorgram below the base line was due to some non-specific binding (NSB) contributing to a SPR signal that is higher on the reference cell (Supp. Info.). These sensorgrams could not be
fitted with a 1:1 Langmuir model of interaction suggesting, as it could be expected, that the interaction was more complex.
Figure 5. Analysis by SPR of the interaction between NPs and Hyal1.
PEG-NP (red) and HA-PEG-NP (green) prepared in PBS buffer were injected at increasing concentrations, 3, 6 and 12 µg/mL, over the Hyal1 functionalized surface. One binding cycle was performed with buffer only (blue).
To go a bit further, a range of hybrid nanoparticle samples was synthesized by a co-nanoprecipitation method as previously developed[17]. PEG-b-PBLG was thus co-nanoprecipitated with
HA-b-PBLG at different weight ratios. The resulting hybrid nanoparticles were composed of both HA-5kDa and PEG-12kDa on their surfaces (Figure 6-a), with a ratio controlled by the copolymer concentrations in the nanoprecipitation process (Supp. Info.).[17]
Three monodisperse hybrid nanoparticle samples with different HA/PEG ratios (7/3, 5/5 and 3/7) were obtained in the same size range, in addition to a fully covered PEG nanoparticle (PEG-NP).
HYAL1 activities and the apparent IC50 values of the
nanoparticle samples were determined based on ELISA assay in the standard degradation condition. Since the molar masses of individual nanoparticles were different and difficult to determine, all the dose-response analysis and performance comparison were performed with the inhibitor weight concentration (µg/mL). As clearly shown in figure 6-b, the inhibition of HYAL1 was gradually reduced when HA segments were replaced by PEG moieties. The PEG-NP nanoparticle did not exhibit any effect on HYAL1, as expected. This study clearly confirmed that the inhibition mechanism was based on a specific interaction between HA and HYAL1, and not on a simple, non-specific adsorption of HYAL1 at the surface of nanoparticles.
Figure 6. (a) HA/PEG hybrid nanoparticle formation by co-nanoprecipitation,
(b) HA/PG hybrid nanoparticle inhibitory effect on HYAL1: dose effect and apparent IC50 determination by ELISA
COMMUNICATION
author manuscript of article in Angew. Chem.-Int. Ed. 2020
DOI 10.1002/anie.202005212
We finally evaluated the selectivity of our HA-NP ashyaluronidase inhibitor as compared to other know inhibitors. Indeed, a large variety of hyaluronidases can be found in nature with the ability to degrade hyaluronic acid[19]. The most used and
studied one is probably the Bovine testis hyaluronidase (BTH), in which the active protein part is named SPAM-1. Ascorbyl palmitate (Vcpal) is referred to as one of the benchmarks for BTH inhibition[20]. Thus, HA-NP was tested in comparison with
Vcpal for their inhibitory effect of both SPAM-1 and HYAL1 (Figure 7-a). Vcpal significantly inhibited SPAM-1, but had no effect on HYAL1. Interestingly, HA-NP efficiently inhibited HYAL1, but had no effect on SPAM-1. It is important to highlight that only a few HYAL1 inhibitors are reported in the literature and most hyaluronidase inhibitor studies are actually based on BTH, even if this is not the most pertinent hyaluronidase for human studies. Polystyrene sulfonate (PSS) and Neomycin sulphate are the inhibitors of reference for HYAL1 found in literature[21]. As shown in figure 7-b, HA-NP exhibited a stronger
inhibition of HYAL1 with an IC50 value as low as 0.156 µg/mL ±
0.007 µg/mL, compared to PSS and Neomycin sulphate, which only displayed a partial inhibition (< 50%) at the two highest doses in our assay (1 µg/mL and 10 µg/mL).
In summary, we have investigated the effect of HA-NP on a relevant human hyaluronidase HYAL1. Its resistance to HYAL1 degradation was significantly improved compared to linear HA. Furthermore, HA-NP displayed a strong and selective inhibition on HYAL1 activity and as a result, protected high molar mass linear HA from enzymatic degradation. This phenomenon could be attributed to a strong interaction between HA-NP and HYAL1 as demonstrated by SPR. Thus, when captured by HA-NP, HYAL1 loses its ability to degrade hyaluronic acid. HA-NP inhibition has been demonstrated to be much more efficient than standard inhibitors (Polystyrene sulfonate, Neomycin sulfate and Ascorbyl palmitate) by at least 3 orders of magnitude. In addition, by a concomitant self-assembly approach, the ratio of HA at the surface of nanoparticles has been controlled to modulate its resulting inhibitory effect on HYAL1.
Figure 7. (a) Test of inhibition of HYAL1 (black) and SPAM-1 (blue) by HA-NP
(squares) and Vcpal (spheres) (b) Determination of the inhibition activity of HA-NP (black squares) towards HYAL1 activity, as compared to PSS (red squares) and Neomycin sulfate (blue squares).
Altogether, and considering that hyaluronic acid is a fully natural and nontoxic polysaccharide, one can anticipate the potential of such HA-NP inhibitors that outperform current state-of-the-art inhibitors, not only in the field of cosmetics, but also in biomedical applications. Indeed, effects of HA on cancer cell activities is highly dependent on their molar mass, which is modulated by hyaluronidase expression[22]. An enhanced HA
degradation generating HA oligomers can be observed in cancer metastasis[23]. Overexpression of HYAL1 increases cell mobility
in ECM[24] and promotes tumor progression[25]. A very recent
study clearly demonstrated that the HA/cancer cell interaction
via CD44 decreased with the size of HA[26]. It has also been
evidenced that some HYAL1 inhibiting compounds could induce significant anti-tumor activity[27]. Similarly, we previously
demonstrated that hyaluronan-based “polymersomes” can efficiently deliver hydrophobic drugs to cancer cells by an enhanced interaction with CD44[17, 28]. This study suggests that
such nanocapsules can potentially be an original therapeutic tool in cancer research, combining intrinsic surface activity and inhibition together with interesting loading and release capability.
Acknowledgements
SL would like to thank the CNRS, Université de Bordeaux and Bordeaux-INP for funding. This work has also benefited from the facilities of the Biophysical and Structural Chemistry plateform (BPCS) at the European Institute of Chemistry and Biology (IECB), CNRS UMS3033, Inserm US001, Univ. Bordeaux (http://www.iecb.ubordeaux.fr/index.php/fr/plateformestechnologi ques), in particular a Biacore T200 instrument acquired with the support of the Conseil Régional d’Aquitaine, the GIS-IBiSA, and the Cellule Hôtels à Projets of the CNRS. The authors thank Lætitia Minder, assistant engineer at the IECB, for a technical assistance.
Keywords: block copolymer • self-assembly • targeting • inhibition • hyaluronan
[1] T. C. Laurent, J. R. Fraser, The FASEB Journal 1992, 6, 2397-2404.
[2] J. L. Cohen, S. H. Dayan, F. S. Brandt, D. B. Nelson, R. A. Axford-Gatley, M. J. Theisen, R. S. Narins, Dermatologic
Surgery 2013, 39, 205-231.
[3] A. C. Petrey, C. A. de la Motte, Frontiers in Immunology 2014, 5, 101.
[4] D. Jiang, J. Liang, P. W. Noble, Physiol Rev 2011, 91, 221-264.
[5] D. Naor, S. B. Wallach-Dayan, M. A. Zahalka, R. V. Sionov,
Seminars in Cancer Biology 2008, 18, 260-267.
[6] F. Dosio, S. Arpicco, B. Stella, E. Fattal, Advanced Drug
Delivery Reviews 2016, 97, 204-236.
[7] J. R. E. Fraser, T. C. Laurent, U. B. G. Laurent, Journal of
Internal Medicine 1997, 242, 27-33.
[8] (a) C. O. McAtee, J. J. Barycki, M. A. Simpson, Advances
in cancer research 2014, 123, 1-34; (b) V. B. Lokeshwar, W. H. Cerwinka, T. Isoyama, B. L. Lokeshwar, Cancer
Research 2005, 65, 7782-7789.
[9] M. M. Smith, P. Ghosh, Rheumatology International 1987,
7, 113-122.
[10] J.-P. Pienimäki, K. Rilla, C. Fülöp, R. K. Sironen, S. Karvinen, S. Pasonen, M. J. Lammi, R. Tammi, V. C. Hascall, M. I. Tammi, Journal of Biological Chemistry 2001,
276, 20428-20435.
[11] O. Artzi, C. Loizides, I. Verner, M. Landau, Dermatologic
COMMUNICATION
author manuscript of article in Angew. Chem.-Int. Ed. 2020
DOI 10.1002/anie.202005212
[12] (a) S. Haas, N. Hain, M. Raoufi, S. Handschuh-Wang, T.Wang, X. Jiang, H. Schönherr, Biomacromolecules 2015,
16, 832-841; (b) K.-S. Tücking, V. Grützner, R. E. Unger, H.
Schönherr, Macromolecular Rapid Communications 2015,
36, 1248-1254.
[13] S. Stair-Nawy, A. B. Csóka, R. Stern, Biochemical and
Biophysical Research Communications 1999, 266, 268-273; bJ. Malaisse, C. Evrard, D. Feret, V. Colombaro, S. Dogné, M. Haftek, C. L. de Rouvroit, B. Flamion, Y. Poumay, Journal of Investigative Dermatology 2015, 135, 3189-3192.
[14] K. L. Chao, L. Muthukumar, O. Herzberg, Biochemistry 2007, 46, 6911-6920.
[15] S. Kurdykowski, S. Mine, V. Bardey, L. Danoux, C. Jeanmaire, G. Pauly, E. Brabencova, Y. Wegrowski, F. X. Maquart, Photochemistry and Photobiology 2011, 87, 1105-1112.
[16] (a) K. K. Upadhyay, A. N. Bhatt, E. Castro, A. K. Mishra, K. Chuttani, B. S. Dwarakanath, C. Schatz, J.-F. Le Meins, A. Misra, S. Lecommandoux, Macromolecular Bioscience 2010, 10, 503-512; (b) K. K. Upadhyay, J. F. L. Meins, A. Misra, P. Voisin, V. Bouchaud, E. Ibarboure, C. Schatz, S.
Lecommandoux, Biomacromolecules 2009, 10,
2802-2808; (c) K. K. Upadhyay, A. K. Mishra, K. Chuttani, A. Kaul, C. Schatz, J.-F. Le Meins, A. Misra, S. Lecommandoux, Nanomedicine: Nanotechnology, Biology
and Medicine 2012, 8, 71-80.
[17] H. Duan, M. Donovan, A. Foucher, X. Schultze, S. Lecommandoux, Scientific Reports 2018, 8, 14730.
[18] S. Mizrahy, S. R. Raz, M. Hasgaard, H. Liu, N. Soffer-Tsur, K. Cohen, R. Dvash, D. Landsman-Milo, M. G. E. G. Bremer, S. M. Moghimi, D. Peer, Journal of Controlled
Release 2011, 156, 231-238.
[19] R. Stern, M. J. Jedrzejas, Chemical Reviews 2006, 106, 818-839.
[20] A. Botzki, D. J. Rigden, S. Braun, M. Nukui, S. Salmen, J. Hoechstetter, G. Bernhardt, S. Dove, M. J. Jedrzejas, A. Buschauer, Journal of Biological Chemistry 2004, 279, 45990-45997.
[21] (a) D. Raghavan, D. T. Simionescu, N. R. Vyavahare,
Biomaterials 2007, 28, 2861-2868; (b) T. Isoyama, D. Thwaites, M. G. Selzer, R. I. Carey, R. Barbucci, V. B. Lokeshwar, Glycobiology 2006, 16, 11-21.
[22] A. Schmaus, J. Bauer, J. P. Sleeman, Cancer metastasis
reviews 2014, 33, 1059-1079.
[23] (a) A. Schmaus, S. Klusmeier, M. Rothley, A. DimmLer, B. Sipos, G. Faller, W. Thiele, H. Allgayer, P. Hohenberger, S. Post, J. P. Sleeman, British Journal Of Cancer 2014, 111, 559; (b) M. Wu, M. Cao, Y. He, Y. Liu, C. Yang, Y. Du, W. Wang, F. Gao, Faseb j 2015, 29, 1290-1298.
[24] C. O. McAtee, A. R. Berkebile, C. G. Elowsky, T. Fangman, J. J. Barycki, J. K. Wahl, 3rd, O. Khalimonchuk, N. Naslavsky, S. Caplan, M. A. Simpson, The Journal of
biological chemistry 2015, 290, 13144-13156.
[25] A. Schmaus, J. P. Sleeman, Glycobiology 2015, 25, 258-268.
[26] S. Amorim, D. S. da Costa, D. Freitas, C. A. Reis, R. L. Reis, I. Pashkuleva, R. A. Pires, Scientific Reports 2018, 8, 16058.
[27] (a) A. Benitez, T. J. Yates, L. E. Lopez, W. H. Cerwinka, A.
Bakkar, V. B. Lokeshwar, Cancer research 2011, 71,
4085-4095; (b) S. Kohi, N. Sato, A. Koga, K. Hirata, E. Harunari, Y. Igarashi, Journal of Oncology 2016, 2016, 6. [28] V. Jeannot, C. Gauche, S. Mazzaferro, M. Couvet, L.
Vanwonterghem, M. Henry, C. Didier, J. Vollaire, V. Josserand, J.-L. Coll, C. Schatz, S. Lecommandoux, A. Hurbin, Journal of Controlled Release 2018, 275, 117-128.
COMMUNICATION
author manuscript of article in Angew. Chem.-Int. Ed. 2020
DOI 10.1002/anie.202005212
COMMUNICATION
Specifically designed hybrid nanoparticles resulting from the self-assembly of HA-b-PBLG copolymers demonstrate highly efficient and specific hyaluronidase inhibition, overpassing the state-of-the-art standards.
Haohao Duan,Mark Donovan, Franck Hernandez, Carmelo Di Primo, Elisabeth Garanger, Xavier Schultze* and Sébastien Lecommandoux* DOI: 10.1002/anie.202005212
Hyaluronic acid presentation at the surface of self-assembled
nanoparticles transforms a
hyaluronidase HYAL1 substrate into an efficient and selective inhibitor
Author Contributions
S.L. Conceptualization: Lead; Funding acquisition: Equal; Project administration: Equal; Supervision: Lead; Writ-ing—Original Draft: Lead; Writing—Review & Editing: Lead.
1
Materials:
Hyaluronic acid (HA) sodium salt of different molar masses (research grade, 5kDa, 20kDa,
HA-100kDa, HA-1000kDa) was purchased from LifeCore Biomedical (Cheska, MN, USA). All the chemicals
used in the copolymers synthesis, neomycin sulfate, Poly(4-styrenesulfonic acid) and SPAM-1 were
purchased from Sigma Aldrich (St. Louis, MO, USA). Recombinant human CD44, HYAL1, SP and
Hyaluronan Duoset kit for ELISA were purchased from R&D systems (Minneapolis, MN, USA). CM5
chips and all the solvents and reagents for SPR analysis including the HBS-EP+ buffer,
N-hydroxysuccinimide (NHS), ethyl-3(3-dimethylamino)propylcarbodiimide (EDC), 1 M ethanolamine
solution pH 8.5, the regeneration solution and the acetate buffer(10 mMol, pH=4) were purchased
from GE Healthcare (Uppsala, Sweden) and used as in manufacturer’s instructions. Filtration discs
were purchased from EMD Millipore (Billerica, MA, USA).
Methods:
1
H-NMR spectra were obtained with a Bruker Avance 400 MHz spectrometer (Rheinstetten,
Germany). Dynamic light scattering (DLS) was measured with a Malvern Zetasizer NANO ZS
(Worcestershire, UK). Surface plasmon resonance analysis was performed with a Biacore T200
(Uppsala, Sweden). The preparation of CD44-coated surfaces for SPR analysis was done as described
previously
[1]. The solution injection in SPR was performed at 30µL/min during 180 seconds. ELISA
tests were performed with Hyaluronan Duoset kits with the recommended reagents and the
standard protocol provided by R&D systems (Minneapolis, MN, USA). SEC analysis in water was
carried out using an Alliance 2695 pump (1 mL/min) and a WATERS 2414 with a differential refractive
2
index detector (at 45°C). The rheological analysis was performed with an Antor Paar modular
compact rheometer MCR302 with a cone-plate geometry. A constant shear rate of 90s
-1was applied
during 30min at 25°C to measure the evolution of apparent viscosity in real-time. Transmission
electron microscopy (TEM) was performed with a Hitachi HT7700 microscope using a 100kV
acceleration voltage. Samples were prepared on carbon-Formvar grids. Negative staining was
performed with a 2wt% uranyl acetate solution in water for 30 seconds.
Copolymer synthesis:
Synthesis of HA-b-PBLG copolymer.
The strategy used was based on the coupling reaction between poly(γ-benzyl-L-glutamate) (PBLG)
and hyaluronan (Lifecore Biomedical
research grade HA-5kDa with a molar mass MW = 5600 g/mol,
Dispersity = 1.4, corresponding to a repetition of about 14 disaccharide units) using a Huisgen
1,3-dipolar cycloaddition click chemistry reaction, as previously described.
[2]The reaction medium was
dialyzed for 4-5 days against MilliQ water (Spectra/Por®6 MWCO 50 kDa membrane), containing
EDTA for the first 2 days, and then lyophilized. Next, the reaction mixture was purified by
ultrafiltration to remove all of the unreacted hyaluronan (yield = 60%). The resulted copolymer was
analyzed by H1NMR, FTIR and SEC in DMSO to verify the coupling conversion. In these particles
Hyaluronic acid represents 43wt% of the total weight of the nanoparticles.
Synthesis of PEG-b-PBLG copolymer.
PEG-NH
2(3g, 0.25 mM) was dissolved in 10mL dioxane, freeze-dried and dissolved in dry
DMF (0.1 g/mL). g-benzyl-L-glutamate N-carboxyanhydride (2.63 g, 10 mM) was introduced into a
flame-dried Schlenk flask and dissolved in anhydrous DMF (0.1 g/mL). Then this solution was added
to the first flask under vacuum. The mixture was stirred for 48 hours at 40°C in an oil bath. The
polymerization medium was concentrated by cryodistillation and the copolymer was recovered by
precipitation into cold diethyl ether. The white powdery solid was then washed three times with
diethyl ether and finally dried under dynamic vacuum for 24 hours to obtain the expected product
(with a yield of 3.8g, and 87% purity). The average polymerization degree of the PBLG block is 58 ,
determined by
1H NMR in deuterated DMF by the integration ratio of the PBLG main chain signal
(CH
2Ph, 2mH at δ = 5 ppm) relative to the PEG ((CH
3O), 3H) at δ = 3.3 ppm) main chain signal. The
polydispersity was 1.21, as assessed by SEC in DMF (1g/L LiBr, 60°C).
Nanostructure sample preparation:
All the nanostructures samples were prepared by the following protocol using different copolymer
solutions:
9 mL PBS buffer (10 mM, pH=7.4, 154 mM ionic strength) was heated to 50°C and stirred at 500 rpm
by a magnetic rotor. 1mL copolymer solution in DMSO (1wt%), was heated to 50°C, before adding
dropwise to the PBS buffer. The resulting solution was stirred further at 50°C for 30min before being
cooled down to room temperature. DMSO was removed by ultrafiltration using PBS buffer with a
MWCO = 100 kDa filter
.
HA-NP was prepared by using a copolymer solution containing 1wt% HA-b-PBLG copolymer.
PEG-NP was prepared by using a copolymer solution containing 1wt% PEG-b-PBLG copolymer.
HA/PEG 7/3 was prepared by using a copolymer solution containing 0.7 wt% HA-b-PBLG copolymer
and 0.3wt% PEG-b-PBLG copolymer.
3
HA/PEG 5/5 was prepared by using a copolymer solution containing 0.5 wt% HA-b-PBLG copolymer
and 0.5wt% PEG-b-PBLG copolymer.
HA/PEG 3/7 was prepared by using a copolymer solution containing 0.3 wt% HA-b-PBLG copolymer
and 0.7wt% PEG-b-PBLG copolymer.
The nanostructure size was measured by DLS with a scattering angle at 173° as shown in Fig S-1.
(a)
(b)
(c)
(d)
(e)
Fig S-1 Evaluation of nanostructure size distribution (average diameter and polydispersity) by DLS (a) HA-NP d=33.6nm PDI=0.156 (b) HA/PEG 7/3 d=38.2nm PDI=0.09 (c) HA/PEG 5/5 d=48.6nm PDI=0.2 (d) HA/PEG 3/7 d=48.5nm PDI=0.12 (e)
PEG-NP d=81.6nm PDI=0.13
Preparation of SPR chips
The SPR chips preparation and the CD44 immobilization protocol was performed according to a
previously reported method.
[1]Around 4000 RU CD44 was immobilized by amine coupling. One RU in
SPR analysis with Biacore instruments and a CM5 chip corresponds to a density variation of 1
pg/mm
2in a 100 nm-layer close to the SPR surface. An immobilization level of 4000 RU corresponds
to a fixation of 4 10
-9g mm
-2of CD44 on the SPR surface. The molar mass of CD44 is 48.6 kDa, the
surface density of CD44 is about 5x10
10unit/mm
2. The activity of immobilized CD44 was checked
during the experiments by using a standard HA-1000 kDa solution at 20 µg/mL. No signal decrease
was observed with this sample, confirming that the activity of immobilized CD44 was maintained.
4
Standard degradation condition of HA-1000kDa/HA-NP for SPR/ELISA/SEC/viscosimetry analyses:
For SPR analysis: To a solution of HA-1000kDa or HA-NP (25µL, 1g/L) in PBS was added the
enzyme solution (5µg/mL) and the inhibitor solution (10µg/mL) in acetate buffer (10 mM, pH 7.4).
The volume was then completed to 500 µL with the acetate buffer. The solution was stirred at 300
rpm and at 37°C during 30 minutes. 50 µL of the resulting solution was diluted with 450 µL HBS-EP+
buffer for injection in SPR analysis.
For ELISA analysis: To a solution of HA-1000kDa or HA-NP (25µL, 0.1wt%) in PBS was added
the enzyme solution (5µg/mL) and the inhibitor solution (10µg/mL) in acetate buffer (10 mM, pH 7.4).
The volume was then completed to 500µL with the same acetate buffer. The solution was stirred at
300rpm at 37°C during 30 minutes. 5µL of the resulting solution was diluted with 495µL reagent
diluent for ELISA tests.
For SEC analysis: To a solution of HA-1000kDa (0.1mL, 0.3wt%) with HA-NP in acetate buffer
(10 mM, pH 7.4) was added the enzyme solution (15µg/mL). The solution was stirred at 37°C 300rpm
during 30 minutes. The resulting solution was diluted with 400µL water. The samples were filtered
through a 0.45µm Millex filter.
For viscosimetry analysis: A solution of HA-1000kDa (0.2mL, 1wt%) in acetate buffer (10 mM,
pH 7.4) was placed on the rheometer plate at 25°C. A drop of enzyme solution, containing 20µg
HYAL1 as provided by R&D systems, was added on the plate into the HA-1000kDa solution. The
analysis was immediately started in order to register the apparent viscosity evolution during 30min.
5
Sensitivity comparison of SPR/ELISA/SEC/Rheology on the evolution of HA MW:
To investigate the performance of each technology on the different MW ranges of HA, standard
samples of HA-5kDa, HA-20kDa, HA-100kDa, and HA-1000kDa were prepared by the protocol in the
standard degradation condition without enzyme addition and evaluated as shown in Figure S-2
(c)
Fig S-2. Evaluation of hyaluronic acid at different molar masses by (a) SPR (b) ELISA (c) SEC (d) rheology
The data in Fig S-2 shows changing HA MW from 1000 kDa to 100 kDa does not result in a major
change in the SPR signal contrary to what is observed when HA 20 and HA 5 kDa are injected. ELISA
proved to be a sensitive technique to follow the evolution of HA MW between 20kDa and 1000kDa
but could not detect the HA-5kDa form (Fig S-2b). SEC allowed for good sensitive detection over the
global range of HA MW from 5kDa to 1000kDa (Fig S-2c) and provided the size distribution of HA in
the sample. The high sensitivity of the viscosimetry analysis could determine the evolution of HA MW
between 20kDa and 1000kDa showing a significant difference in viscosity between these two forms
of HA, however the resolution of lower MW HA solutions remains poor (Fig S-2d). Rheological
analysis can track both the evolution of viscosity and thus the degradation of HA in real-time. On the
other hand, SEC and rheological analyses are much more sample and time-consuming compared to
SPR and ELISA analyses.
Taking into account all these factors, SPR combined with ELISA can give a satisfactory sensitive
approach to observe HA MW evolution over a global range and thus they were used together as
screening tests in our study. SEC and viscosimetry were used for detailed analysis of some of the key
results in the study.
10-4 10-3 10-2 10-1 100 0 300 600 900 1200 1500 1800 Sheet1 HA-1000kDa HA-100kDa HA-20kDa HA-5kDa Solvent (buffer) A pp a re nt v is c o sit y (Pa S -1) Time (s) 0 10 20 30 40 50 60 70 80 0 50 100 150 200 250 300 Sheet1 HA-1000kDa HA-100kDa HA-20kDa HA-5kDa R e s on an ce unity ( R.U ) Time (s) -0.5 0 0.5 1 1.5 2
HA-5kDa HA-20kDa HA-100kDa HA-1000kDa
O p ti c de n si ty ( O .D .) 0 1 10-6 2 10-6 3 10-6 4 10-6 30 35 40 45 50 55 60 Graph1 HA-1000kDa HA-100kDa HA-5kDa Di ffe rent ia l re fra ct iv e i nde x Time (s)
a)
b)
c)
d)
6
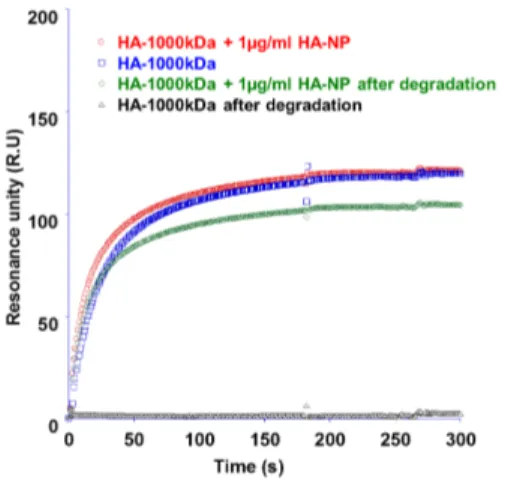
Inhibition of HYAL1 by HA-NP observed by SPR:
Fig S-3. SPR signal of HA-1000kDa solution with and without HA-NP addition, before and after the enzymatic degradation
The solution of HA-1000kDa (50µg/mL) and the same solution with 1µg/mL of HA-NP have the same
SPR profile (red and blue sensorgrams) before the enzymatic degradation by HYAL1 (green and black
sensorgrams).
Evaluation of HA/CD44 interaction by SPR after incubation with HYAL1:
Fig S-4. SPR signal of HA-1000kDa solution with and without HYAL1 addition. The samples were injected between 0 and 180s. The buffer rinsing phase started just after the end of the association phase, at 180 s. The small irregularity at 270 s
corresponds to the end of the dissociation phase as programmed in the binding cycle method.
The degradation of a HA-1000kDa in solution was performed at 37°C during 20 minutes in pH 4
acetate buffer with 0.1wt%, 0.2wt% and 0.5wt% HYAL1. The weight percentage (wt%) means the
weight ratio of the enzyme compared to the HA quantity in the solution. For example, a solution
containing 50µg/mL HA degraded by 0.5 µg/mL HYAL1 will be called as “a solution of HA degraded by
1 wt% HYAL1”. We can notice that the binding level with CD44 was reduced when partially degraded.
However, their interaction with CD44 remained stable in the buffer rinsing phase, which started at
270s.
0 50 100 150 200 0 50 100 150 200 250 300 Sheet1 HA-1000kDa HA-1000kDa+ 0.1wt% HYAL1 HA-1000kDa+ 0.2wt% HYAL1 HA-1000kDa+ 0.5wt% HYAL1 Re s o n an c e u n it y ( R. U) Time (s)7
Immobilization of HYAL1 for SPR HYAL-1 / HA-NP interaction studies:
HYAL1 was immobilized by amine coupling using NHS/EDC. Two density levels were used to ensure
that the results were consistent. A 5-min injection of NHS/EDC to activate the surface was followed
by a 5-min injection of Hyal1 prepared at 10.8µg/mL or 2.2 µg/mL
(Fig. S-5) in 10 mM sodium acetate,
pH 6.3, for flow cells 4 and 2, respectively. After deactivation of the surface with ethanolamine and
washing with a mixture of NaOH/NaCl (see Fig. S-5), 2636 and 722 resonance units (RU) of Hyal1
were immobilized on flow cells 4 and 2, respectively. NPs, dialyzed against the running buffer, were
injected over the Hyal1 functionalized surfaces, at increasing concentrations, 3, 6 and 12 µg/mL,
using the single cycle kinetics method
[3,4], at a flow rate of 25 µL/min. A 1-min pulse of a mixture of
50 mM NaOH and 1 M NaCl was used to regenerate the surface after each binding cycle.
Figure S-5. Immobilization of Hyal1 by injection at 10.8µg/mL (A) and 2.2µg/mL (B) and surface deactivation and washing steps (C).
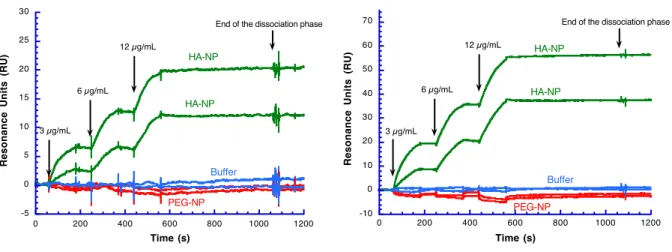
Analysis of the interaction by injecting PEG-NP or HA-NP over Hyal1 immobilized on a CM5 sensor
chip
Figure S-6. Analysis of the interaction between NPs injected and Hyal1 immobilized.
The NPs, dialyzed against and prepared in PBS buffer (running buffer, without Tween), were injected
in duplicate over flow cell 2 (A) and 4 (B) corresponding to low and high density levels of immobilized
3.6 104 3.8 104 4 104 4.2 104 4.4 104 0 200 400 600 800 1000 A) Immobilzation of Hyal1 at 10.8 µg/mL Resonance Units (RU) Time (s) Hyal1 NHS/EDC Running buffer Flowcell 4 3.4 104 3.6 104 3.8 104 4 104 4.2 104 4.4 104 0 200 400 600 800 1000 B) Immobilzation of Hyal1 at 2.2 µg/mL Resonance Units (RU) Time (s) Hyal1 NHS/EDC Running buffer Flowcell 2 3.5 104 4 104 4.5 104 5 104 5.5 104 6 104 0 100 200 300 400 500 600 700 800 C) Deactivation with ethanolamine and washing
Resonance Units (RU) Time (s) Ethanolamine NaOH/NaCl Flowcell 4 Flowcell 2 -5 0 5 10 15 20 25 30 0 200 400 600 800 1000 1200
A) injection of PEG- or HA-NP on Hyal1 immobilized at low density
Resonance Units (RU) Time (s) 3 µg/mL 6 µg/mL 12 µg/mL HA-NP HA-NP PEG-NP Buffer
End of the dissociation phase
-10 0 10 20 30 40 50 60 70 0 200 400 600 800 1000 1200
B) injection of PEG- or HA-NP on Hyal1 immobilized at high density
Resonance Units (RU) Time (s) 3 µg/mL 6 µg/mL 12 µg/mL HA-NP HA-NP PEG-NP Buffer
8
protein, respectively. After several trials even with SDS, we could not find good conditions to
regenerate the HA-NP/protein complexes once formed. We decided to use a mixture of 50 mM
NaOH/1 M NaCl that is recommended by Biacore to wash the surface when a protein has been
immobilized by amine coupling. Even with this solution duplicate sensorgrams were not
superimposed. When this happens and the SPR signal decreases the question always arises whether
this is due to removal of the immobilized target from the surface or to an incomplete dissociation of
the complex because it is too stable and the regeneration is not efficient enough. After three
injections of a mixture of 50 mM NaOH/ 1 M to wash the surface the SPR signal was stable (see
Figure S-5C). Further injections of this mixture had no major effect on the signal level meaning that
the loss of protein was very low. Therefore, the decrease in signal from one cycle to the next when
HA-NPs were injected can reasonably be attributed to incomplete regeneration. The sensorgrams
obtained when PEG-NP were injected were below the baseline (injection of buffer) because of
non-specific binding (NSB) with the dextran surface of the CM5 sensor chip. Since PEG-NPs did not
binding to HYAL1 and the surface of flow cells 2 (A) and 4 (B) was occupied by the protein, NSB was
higher for the blank channels, 1 and 3, than for those functionalized with HYAL1, 2 and 4. Therefore
the signals were negative. This was not observed with HA-NPs, because even if these NPs also
displayed NSB (see next figure, S-7) its contribution to the SPR signal was much lower than that
resulting from the specific interaction between Hyal1 and HA-NPs. NSB contribution to the SPR signal
has been extensively investigated in a previous study (Visentin et al., Biosensors and Bioelectronics
117 (2018) 191–200).
Analysis of the interaction by injecting Hyal1 over PEG- or HA-NP adsorbed on a CM5 sensor chip
Figure S-7. Analysis of the interaction between NPs adsorbed onto the chip surface and HYAL1 injected.
In these experiments we took advantage of the non-specific binding (NSB) displayed by both NPs, as
evidenced by signals that did not return to the baseline when the injections of NPs were stopped, to
adsorb them onto the surface and to inject HYAL1. Regeneration after each binding cycle was
performed with a 1-min pulse of 50 mM NaOH and was efficient, the NPs being simply washed from
the surface. We observed that adsorption of the NPs from the same solution at 12 µg/mL for PEG-NP
(A) and HA-NP (B) was not reproducible without being able to find other explanations that the
solution evolved over time. Consequently, the signals obtained by injecting Hyal1 at 15 (green) and
30 nM on NPs were expected not to be similar between replicates. Despite this the results confirmed
-20 0 20 40 60 80 100 0 200 400 600 800 1000 1200
A) Hyal1 injected over PEG-NP adsorbed on a CM5 sensor chip
Resonance Units (RU) Time (s) Baseline PEG-NP Hyal1 -20 0 20 40 60 80 100 0 200 400 600 800 1000 1200
B) Hyal1 injected over HA-NP adsorbed on a CM5 sensor chip
Resonance Units (RU) Time (s) Baseline Hyal1 HA-NP