HAL Id: hal-00762884
https://hal.archives-ouvertes.fr/hal-00762884v2
Submitted on 20 Jan 2013
HAL is a multi-disciplinary open access
archive for the deposit and dissemination of
sci-entific research documents, whether they are
pub-lished or not. The documents may come from
teaching and research institutions in France or
abroad, or from public or private research centers.
L’archive ouverte pluridisciplinaire HAL, est
destinée au dépôt et à la diffusion de documents
scientifiques de niveau recherche, publiés ou non,
émanant des établissements d’enseignement et de
recherche français ou étrangers, des laboratoires
publics ou privés.
hyperpolarized noble gas solutions
Steven Morgan, Emmanuel Baudin, Gaspard Huber, Patrick Berthault,
Geneviève Tastevin, Maurice Goldman, Pierre-Jean Nacher, Hervé Desvaux
To cite this version:
Steven Morgan, Emmanuel Baudin, Gaspard Huber, Patrick Berthault, Geneviève Tastevin, et al..
Multiple echoes due to distant dipolar fields in NMR of hyperpolarized noble gas solutions. The
European Physical Journal D : Atomic, molecular, optical and plasma physics, EDP Sciences, 2013,
pp.67:29. �10.1140/epjd/e2012-30470-0�. �hal-00762884v2�
Preprint (January 20, 2013), to be published in the Eur. Phys. J. D.
Multiple echoes due to distant dipolar fields in NMR of hyperpolarized
noble gas solutions
Steven W. Morgan
1, Emmanuel Baudin
2, Gaspard Huber
1, Patrick Berthault
1, Genevi`
eve
Tastevin
2, Maurice Goldman
3, Pierre-Jean Nacher
2, and Herv´
e Desvaux
∗11
Laboratoire Structure et Dynamique par R´esonance Magn´etique, IRAMIS, CEA, CNRS, UMR 3299 SIS2M, CEA/Saclay, 91191 Gif-sur-Yvette, France
2
Laboratoire Kastler Brossel, ENS; CNRS; UPMC; 24 Rue Lhomond, F75005 Paris, France
3
6 R´esidence de Villebon, 91140 Villebon sur Yvette, France
Abstract We report on multiple echo measurements in hyperpolarized liquids using optically pumped spin-1/2
noble gas atoms: either129
Xe dissolved in cyclohexane or3
He dissolved in superfluid4
He. An NMR pulse sequence 90◦
− τ − 90◦ (with slice-selective flipping pulses for
129
Xe experiments) was used and long echo trains have been observed in the presence of applied gradients due to average dipolar fields typically one order of magnitude larger than those of bulk water in high magnetic fields. We show that a mean field description is valid for explaining the
multiple echoes observed in these liquids, even for spin temperatures as low as 10 mK for129
Xe or 10 µK for3
He, and the echoes originate from the distant dipolar fields within the samples. Numerical lattice simulations have been used to assess the effects of slice selection and of finite sample size in addition to those of atomic diffusion. They account for the observed echo widths and amplitudes much better than previously published models which disregard finite size effects that appear to be of key importance. This opens the way to using multiple echoes resulting from distant dipolar fields for the determination of the absolute magnetization in hyperpolarized liquids without signal calibration.
1
Introduction
Since the observation by Deville et al. [1] of multiple echoes in solid3He, numerous experiments exploring the
effects of distant dipolar fields in liquids have been re-ported, in particular using thermally polarized water or liquid 3He in high magnetic fields [2–5]. There are two
ways to describe the observed phenomena that have been shown to be equivalent [6]. On one hand, a mean field theory has been used [1, 7–10]: the strong magnetization of the sample induces a dipolar field that is experienced by the magnetic moments. This leads to non-linear terms in the Bloch equations describing the time evolution of the magnetization and explains the observation of multi-ple echoes. The mean-field approach is particularly use-ful for performing numerical simulations [9, 11]. On the other hand, following the observation of “unexpected” echoes in the Correlated 2D spectroscopy Revamped by Asymmetric Z-gradient Echo Detection (CRAZED) ex-periments [12], a density matrix-based approach was pro-posed [13], relying on a claimed breakdown of the high temperature approximation [12, 13], with the introduc-tion of intermolecular Multiple-Quantum Coherences (i-MQC) [14]. The main advantage of this framework resides in its ability to more easily make analytical predictions. In particular, it has allowed the derivation of pulse sequences designed for real applications, for instance for performing
∗herve.desvaux@cea.fr, corresponding author.
NMR or MRI in inhomogeneous magnetic fields [15–17] or media [18–22].
Beyond the usual range of average dipolar fields pro-duced by bulk water, the domain of large dipolar fields in solutions has also been investigated using numerical simu-lations [23,24] and highly polarized3He and129Xe [25–28].
The larger range of accessible densities and nuclear po-larizations using these hyperpolarized nuclei has revealed the potential existence of collective behaviors observed as spectral clustering [29], chaotic time evolution leading to a rapid crunch of the magnetization [23, 30–33] which can nevertheless be delayed by repeated magic sandwich se-quences [34], and the observation of multiple maser emis-sions [35, 36]. More recently two groups [37, 38] have re-ported the use of the generic CRAZED approach for ob-serving i-MQC [12, 39] in 13C or 1H samples whose
mag-netization was previously enhanced by Dynamic Nuclear Polarization (DNP). We chose to perform multiple echo experiments in laser-polarized3He and129Xe samples for
several reasons:
- higher polarizations (>30%) than that obtained by brute force or by ex situ DNP can routinely be pro-duced. This allows the exploration of very low spin temperatures and also large average dipolar fields when compared to that produced by bulk water in high magnetic field;
trans-verse relaxation times (minutes). This permits sev-eral experiments with one polarization batch as well as more in-depth studies;
- the absence of scalar couplings allows direct com-parisons between the experimental and numerical re-sults.
In the present paper, we show that even with a high tran-sient polarization, i.e. a low spin temperature (down to 10 mK for129Xe at 11.7 T or 10 µK for3He at 2.3 mT), the
descriptions of the spin dynamics in terms of the density matrix or average dipolar field are equivalent. This proves that unexpected effects such as the predicted increased spectral interferences in highly polarized liquids [40] or the observed spectral narrowing in solids [41] are still neg-ligible in the range of polarization we used. To investigate this regime in liquid systems with low transient spin tem-peratures, we have chosen to use a pulse sequence com-posed of two slice-selective 90◦
pulses with a pulsed en-coding gradient applied between them and an acquisition in the presence of a continuous gradient to observe many echoes (see Fig. 1). We used slice selection primarily to allow multiple experiments with each sample. The detec-tion of several echoes allows us to compare experimental measurements to analytical and numerical predictions in a self-consistent way. The final aim of this work is to establish a method for absolute magnetization determi-nation without resorting to external references, the lat-ter being always loosely defined for transiently polarized spin systems. Several steps forward are reported in the present paper and in particular we demonstrate that finite size effects, which have been fully disregarded for several decades until very recently [42], appear of key importance. Finally the large range of dipolar fields accessible with our experiments has allowed us to observe strong distortions of the echoes for large dipolar fields (significant relative to the applied gradients).
2
Theory
2.1
Spin temperature for an ex situ
hy-perpolarized species
A widespread approach for describing the observation of multiple dipolar echoes in liquids due to distant dipolar fields is to consider a spin system composed of all spins of the sample and the full Hamiltonian (including Zeeman terms and intermolecular dipolar interactions). Then it is usually argued that “there is a breakdown of the high-temperature approximation” [12, 13], so that the full ex-pansion of the density matrix has to be considered: σ = 1+α(1)X n In z+α (2)X n<m In zIzm+α (3)X n<m<l In zIzmIzl+· · · (1) where at thermal equilibrium the different coefficients α(k)
are:
α(k)= 2ktanhk(β
LγB0/2), (2)
with βL the inverse spin temperature of the lattice, γ the
gyromagnetic ratio, and B0the static magnetic field. The
usual high temperature approximation consists in restrict-ing the development of Eq. 1 to the first two terms and to linearize α(1)≃β
LγB0. Using the whole development
of the density matrix (Eq. 1), one can predict the obser-vation of multiple echoes following a 90◦
−τ − 90◦
exci-tation [12]. Essentially the nth echo results from the
in-termolecular n spin-order coherences excited by the first 90◦
hard pulse and that precess during τ as n quantum coherences. This justifies the term i-MQC. The ampli-tude of this echo is directly related to the density matrix expansion (Eq. 1) and thus to the coefficient α(n).
If we consider now an ex situ hyperpolarized spin sys-tem, before any rf pulse the density matrix can still be written as a series expansion of In
zIzmIzl. . . , that is,
ac-cording to Eq. 1. Treating the problem in this usual way immediately raises intriguing questions: What are the values of coefficients α(k) in Eq. 1? Can they still be computed through Eq. 2 after the replacement of βL by
the inverse spin temperature? Or in other words is the spin temperature still a well-defined quantity?
For any ex situ hyperpolarization mechanism, at the in-stant corresponding to the end of the polarization step the populations of the different states of the whole system are distributed according to a single spin temperature. After that moment, the system is out-of-equilibrium and is go-ing to evolve towards thermal equilibrium. No mechanism in liquids can warrant the persistence of a spin temper-ature during this period since the intermolecular dipolar interactions are too weak to ensure efficient energy ex-change. However, longitudinal relaxation is going to alter the distribution of spin-state populations since the relax-ation rate of the single-spin order is different from the relaxation rates of intra- and inter-molecular multi-spin coherences. Thus addressed in such a way, the natural response corresponds to at least a large doubt on the ex-istence of a spin temperature for an ex situ hyperpolarized spin system.
This difficulty is illustrative of the misleading message associated with a claim of “the breakdown of the high-temperature approximation.” The main feature of a liquid is the absence of long distance correlations.1 Thus the
density matrix of the whole spin system can always be written as a product of single molecule density matrices σm:
σ =Y
m
σm. (3)
The restriction to single spin 1/2 (I) atoms or molecules (such as129Xe or3He) allows one to express the diagonal
part of any individual (2 × 2) density matrix σm as a
function of the initial polarization P0= − tanh(βIγB0/2)
with βI the inverse nuclear spin temperature:
σm= 1 + 2P0Izm. (4)
1
Local correlations exist in a liquid but Brownian motion rapidly averages out short-range intermolecular dipolar interactions and they can consequently be disregarded.
Preprint (January 20, 2013) Morgan et al, Multiple echoes due to DDF... 3
Longitudinal relaxation is going to alter the polarization: P (t) = P0exp(−t/T1) (5)
where T1is the longitudinal self-relaxation time of the spin
species I and where we have neglected the thermal equi-librium polarization relative to the transient value. The whole density matrix σ at arbitrary time is given by Eq. 3 and the coefficients α(k) are obtained by power
expan-sion. With the key assumptions of a unique spin species
and homogeneous evolution (single T1 for all spins of the sample), the coefficients α(k)are distributed according to
a single-spin temperature.
The assumption of homogeneous evolution is intrinsi-cally correlated to the transport properties of the studied system, since diffusion and convection will always tend to erease inhomogeneities at least at small enough scales. If non-uniform conditions remain over large distances, it remains possible to define position-dependent spin tem-peratures. The assumption of a unique spin species is more delicate. In fact, the existence of a spin temperature is not valid for transiently polarized multi-spin molecules such as those obtained by DNP [37, 38, 43, 44]. Indeed, correlations between spins within the same molecule are preserved and the different intra-molecular spin-order co-herences have different relaxation rates; for instance, due to the mutual dipolar interaction, the longitudinal relax-ation rate of a two-spin order 2Ik
zIzl is never equal to the
sum of the one-spin relaxation rate of each spin (see for in-stance Ref. [45] for rate expressions). Thus effects due to distant dipolar fields and local scalar couplings are going to superimpose leading to multiplet intensities and split-tings of coupled spins whose values differ from the dilute and thermal equilibrium ones [46].
This discussion illustrates that in the density matrix ap-proach the key element for explaining experiments dealing with distant dipolar fields actually resides in the break-down of the average molecule approximation. Indeed the usual procedure for solution-state NMR resides in con-sidering for the Hamiltonian and the density matrix a spin system restricted to that of one single average solute molecule. Now when distant dipolar fields are studied, i.e. intermolecular interactions are considered, the description should be based on the tensor products of all individual density matrices (Eq. 3). Each one can be in the low spin temperature limit (for hyperpolarized spin systems) or in the high spin temperature approximation (βLγB0 ≪ 1,
for thermally polarized samples).
2.2
Multiple echoes due to distant
dipo-lar fields
The restriction to a single-spin molecule without correla-tions between molecules has as a consequence the equiv-alence between a one-spin density matrix description and a classical local magnetization description. Considering a thermally polarized single spin system, Jeener has shown the equivalence between the density matrix description
and the mean field approach for experiments dealing with distant dipolar fields [6]. Obviously since we have shown that a spin temperature can be rigorously defined for a transiently polarized single spin system and since in our considered spin system the longitudinal self-relaxation times (several minutes) are much longer than the pulse se-quence duration, the demonstration of equivalence done by Jeener can straightforwardly be extended to this case by introducing the transient spin temperature in place of the thermal equilibrium value. Within this framework, one can consequently use either the density matrix ap-proach or the mean field apap-proach.
In the rest of the present paper, we follow the initial de-scription by Deville et al. [1] based on the classical mean field approach. In their experiments, multiple echoes were observed after two hard 90◦
pulses separated by a delay τ in the presence of a continuous gradient of amplitude G such that Gl (where l is the relevant length of the sam-ple) significantly exceeds the dipolar field associated with the magnetization (Sec. 4.3 discusses results obtained at higher magnetizations). When one disregards effects of diffusion and relaxation and in the absence of rf irradia-tion, the equation of time evolution of the local magneti-zation M is:
∂
∂tM= γM × [(B0+ Gz)ˆz+ Bdip(r, t)] (6) where the first term corresponds to the Zeeman contribu-tions due to the collinear static magnetic field and gradi-ent (aligned with the sample axis direction ˆz), and the second to the time- and space-dependent dipolar field Bdip(r, t) produced by the magnetization. During the
ac-quisition, the transverse magnetization expressed in the rotating frame can usually be approximated for well-resolved echoes (with duration much shorter than the inter-echo time τ ) by [9]: M+(t2) = −M0 Z V dz ∞ X n=−∞ ı−n e−ıγz(Gt2−nGτ)nJn(ωdipt2) ωdip t2 (7) where the integral is performed on the sample volume V , Jn is the nth Bessel function of the first kind, and
ωdip = 2πfdip = µ0γM0 is the dipolar angular frequency
associated with the uniform initial magnetization M0. In
this formulation, there is no specific condition on the po-larization of the nuclear spins. The analytical solution (Eq. 7) has been established for homogeneous systems in which relaxation, diffusion, and edge effects can be ne-glected [1, 9].
In our experiments on polarized 129Xe, we have used a pulse sequence (Fig. 1) that differs from that of Dev-ille et al. [1] in two respects. Slice-selective rf pulses have been used so as to excite only a small fraction of the sam-ple and a pulsed encoding gradient of amplitude Ge and
duration τe, applied just before the second rf pulse,
re-placed the constant encoding gradient so as to reduce the initial diffusion-induced signal attenuation. Since the
am-plitudes of the gradients satisfy Gτ = Geτe, a series of
echoes at times t2= nτ is also expected.
Gs Gs Ge G τ 1 2 3 4 90° 90° t2 τe
Figure 1: Pulse sequence used to investigate multiple echoes with polarized 129Xe. In the first (1) and third
(3) periods the magnetization is slice selectively excited by 90◦
Gaussian pulses combined with gradient GS. It
evolves during the delay τ and the transverse component is encoded by the gradient Ge with a duration τe that
satisfies Geτe = Gτ . Echoes are detected during the
ac-quisition period (4), during which a constant gradient G is applied leading to the appearance of echoes separated by the delay τ . For the3He experiments a constant gradient G is applied throughout the experiment and no slice selec-tion is applied for excitaselec-tion which only consists of square rf pulses. All gradients are applied along the longitudinal axis of the sample (ˆzgradient).
In our experiments, as well as in previous studies of mul-tiple echoes due to distant dipolar fields [1–5], the two rf pulses have the same phase. However, the encoding gradi-ent applied between the rf pulses locally shifts the phase of the precessing magnetization and the relative phase of the rf pulses plays no role for γGeτe≫1. This contrasts with
solid-state NMR experiments performed without applied gradients for which the relative phase of the rf pulses is important, with for instance a solid-echo following a 90◦ x−90 ◦ y but not a 90 ◦ x−90 ◦ xpulse pair [47].
3
Experimental methods
3.1
NMR experiments
Most experiments have been performed with hyperpolar-ized 129Xe produced by spin-exchange optical pumping
of rubidium using an experimental apparatus that works in batch mode [48, 49]. Up to four batches of 86% en-riched 129Xe, were accumulated before transferring by
cryo-condensation into a previously degassed NMR tube. The tube, of 3 mm outer diameter and 1.6 mm inner di-ameter, contained 100 µL of deuterated cyclohexane. The diffusion coefficient of xenon under these conditions is 2.1 · 10−9
m2/s. The initial polarization of the dissolved
xenon was up to 30%. Polarization measurements were made by comparing the hyperpolarized xenon NMR sig-nal after a small excitation pulse to the overnight average thermal equilibrium signal obtained after the same exci-tation pulse. The xenon concentration was determined af-ter the experiment by weighing the NMR tube before and
after degassing the xenon and using the reported xenon solubility in cyclohexane [50]. The values of the extracted dipolar frequencies fdipwere checked to be consistent with
those directly determined from1H frequency shifts
mea-sured in interleaved experiments [51]. fdip values ranged
up to 9 Hz, which corresponded to dipolar fields (760 nT) more than 15 times that of thermally polarized bulk water at room temperature and 11.7 T (48 nT).
All xenon experiments were run on a Bruker Avance II 500 MHz spectrometer. A 5-mm inverse triple resonance probe head was used, where the broadband channel used for xenon excitation and detection corresponded to the outer coil. This choice reduced contributions due to ra-diation damping, which were already limited by the low gyromagnetic ratio of129Xe, since radiation damping rate
scales as γ3 at thermal polarization. The maximum
radiation damping contribution for such an experimen-tal configuration was estimated from previous measure-ments [36], to be smaller than 1 s−1
. The circuit for the xenon channel was tuned for optimal reception (perfect agreement between the resonance frequency of the elec-tronic reception circuit and the Larmor frequency) [52]. The magnetic field was locked to the2H signal of the
sol-vent.
We used the pulse sequence of Fig. 1 to probe multi-ple echoes due to distant dipolar fields. The selected slice thickness determined by the gradient strength GSand the
duration of the soft Gaussian pulse (196 µs FWHM, 500 µs full duration) was typically 1.8 mm FWHM for a gradient GS= 200 mT/m. A typical run of experiments consisted
of dissolving the polarized xenon and performing a series of signal acquisitions. Xenon polarization was refreshed between each measurement using the reservoir of gaseous xenon by vigorously shaking the NMR tube, ensuring ho-mogeneous magnetization. Each measurement in the se-ries was usually made by acquiring multiple echoes from three well-separated slices in a 40 mm long sample. The inter-echo time τ was varied between 45 and 120 ms and the gradient G was typically 4 mT/m.
We performed similar NMR experiments using liq-uid 3He-4He mixtures. 3He gas was polarized using
metastability-exchange optical pumping and subsequently dissolved in liquid4He at T =1.3 K, with initial
polariza-tion of up to 30% and concentrapolariza-tions such that fdipranged
up to 11 Hz [28, 34]. The diffusion coefficient of 3He in
these conditions was on the order of 10−7
m2/s. No slice
selection was used and a constant gradient of 1.3 mT/m was applied (eddy currents prevented fast gradient switch-ing in these low temperature experiments). NMR was performed at 74 kHz (2.3 mT), active feedback was used to reduce the effects of radiation damping [53], and the inter-echo times were less than 50 ms.
Finally, the consistency of the experimental results was checked using bulk water at 11.7 T, the same pulse se-quence as for hyperpolarized xenon, and gradient values scaled down by the ratio γXe/γH.
Preprint (January 20, 2013) Morgan et al, Multiple echoes due to DDF... 5
3.2
Numerical simulations
Numerical simulations were based on an exact calculation of the time evolution of coupled magnetic moments on a cubic lattice. The simulations included the effects of diffu-sion, magnetic field gradients, dipolar interactions, and rf field including radiation damping. The software was ini-tially developed by Jeener [23], using methods that were also used by other groups [54,55]. Computations were per-formed in the rf rotating frame using a standard secular approximation. The magnetic field induced at each site by the remainder of the sample was efficiently computed by toggling between real space and Fourier space using peri-odic boundary conditions [1,9,54]. The time evolution was computed by integrating the non-linear Bloch equations using a standard Runge-Kutta technique. Two kinds of simulations were performed: the case where edge effects were neglected was studied using a 1D unit cell to describe an infinite system with perfect translational invariance in the transverse directions (ˆx, ˆy). The case where finite size effects were taken into account was modeled using a 3D unit cell of 158 × 158 × 600 sites typically includ-ing 68 × 68 × 240 magnetic moments. This corresponded to the aspect ratio of the xenon samples (although not to their cylindrical shape) but the computational load of such realistic simulations was quite heavy, of order a few days per second of physical time on a desktop computer.
4
Results and discussion
4.1
Experimental observation of multiple
echoes
Figure 2 shows typical time domain signal amplitudes ob-tained using the pulse sequence of Fig. 1 and dissolved laser-polarized 129Xe. As predicted by Eq. 7, echoes
ap-pear at t2= nτ where n is an integer. For typical
experi-mental conditions, well-resolved echoes are obtained (Fig. 2a). For a large magnetization and a short echo time, up to 14 echoes have been observed (Fig. 2b).
Except for the highest magnetizations, the echoes can be accurately fitted by Gaussian functions. This fitting procedure allows a measurement of the echo widths and a precise determination of the echo amplitudes. The echo widths are observed to increase with echo number (insets in Fig. 2). This increase is due to the use of a slice selection gradient and a soft pulse. It is also obtained in numerical lattice simulations when a slice is selected by a Gaussian pulse, whereas constant echo widths are obtained when magnetization is uniformly tipped with 90◦
hard pulses.
A constant echo width is indeed observed in Fig. 3 where a series of echoes are detected on a mixture of
3He-4He after two non-selective 90◦
hard pulses. For this near-hemispheric sample shape [34], a sinc-like echo shape is expected, with side lobes contributing to the observed broad baseline in the signal.
0.0 0.2 0.4 0.0 0.5 1.0 0.0 0.2 0.4 0.6 0.8 0.0 0.5 1.0 0 2 4 6 8 10 0 10 20 30
6
5
4
3
2
1
b
S
ig
n
a
l
a
m
p
lit
u
d
e
a
1
1112
10
9
8
7
6
5
4
3
2
time (s)
S
ig
n
a
l
a
m
p
lit
u
d
e
...
0 1 2 3 4 5 0 10 20 30Echo number
Echo width (ms)
Echo width (ms)
Echo number
Figure 2: Time-domain variations of signal amplitudes obtained with the pulse sequence of Fig. 1 and dissolved laser-polarized xenon. a: For an inter-echo time τ = 70 ms and fdip = 3.1 Hz, a series of Gaussian-shaped echoes is
observed. b: A larger number of echoes is obtained with τ = 45 ms and fdip= 9 Hz. The insets display the
corre-sponding echo widths (FWHM).
One common feature of the 3He and 129Xe signals is
the significant width of the echoes. For a constant read gradient G value, the thinner is the slice selection, the broader is the echo width. This width results from the combined use of slice selection (for Xe samples) and de-tection gradients of moderate amplitudes. However, this choice of gradients also limits signal losses resulting from diffusion. Even though the widths of these echoes are smaller than those obtained by the multi-CRAZED ap-proach where the magnetization is precessing in the ab-sence of gradients [12, 39], their finite values prevent the use of very short inter-echo times τ unless either a larger sample slice thickness is selected or a stronger gradient G is used.
4.2
Comparison of analytical, numerical,
and experimental echo amplitudes
In the ideal situation considered for the derivation of Eq. 7 (infinite medium, no diffusion, no relaxation, uniform 90◦
0 50 100 150 0.0 0.5 1.0 0 1 2 3 4 5 0 5 10
Echo width (ms)
5
4
3
2
1
S
ig
n
a
l
a
m
p
lit
u
d
e
time (ms)
Echo Number
Figure 3: Time-domain variation of signal amplitude ob-tained with hyperpolarized 3He and a constant gradient
for τ = 24.6 ms and fdip = 5.5 Hz. The diffusion
co-efficient of 3He was 50 times larger than that of 129Xe,
which impeded the observation of more numerous echoes. The inset displays the echo widths (FWHM) of the first echoes; they do not increase with echo number, in contrast to those of Fig. 2.
excitation pulse), the amplitude Sid.(n) of the signal de-tected for the nth echo is:
Sid.(n)= KM0V
2nJn(nωdipτ )
2nωdipτ
(8) where M0 is the magnetization at the time of the
experi-ment and K is the instruexperi-mental response factor. To avoid the dependence on uncertain parameters such as the thick-ness of the selected slice (affecting V ) or the exact polar-ization at any particular time (affecting M0) we resort to
the reduced amplitudes A(n)id., normalized to the amplitude
of the first echo:
A(n)id.(ωdipτ ) =
S(n)id. Sid.(1)
=Jn(nωdipτ )
J1(ωdipτ ) . (9)
A(n)id. only depends on the dimensionless quantity ωdipτ
where ωdip scales with M0. The reduced amplitude A(n)id.
monotonically increases with ωdipτ (hence can be used
to uniquely determine ωdipτ ) for values of this
parame-ter up to 1.5. For larger values, the oscillatory nature of the Bessel functions may yield irregular echo patterns [9]. For the same reason of avoiding uncertain parameters, we also consider the reduced amplitudes A(n)=S(n)/S(1) for
the echo amplitudes for the analytical, experimental, and numerical cases.2
Selected results of numerical lattice simulations are used to illustrate the effect of physical processes that are not considered in the simple description presented so far (Eqs. 6 and 7). Figures 4a and 4b display examples of echo
2
Bowtell et al. [3] also used this ratio for monitoring the effects of diffusion. 0.0 0.2 0.4 0.6 0.01 0.1 1 1 2 3 4 5 6 1D model: D=0, GS=0 D=0, GS D=DXe, GS=0 D=DXe, GS A (n ) 3D model: D=DXe, GS τ =122 ms ωdipτ =1.5 time (s)
b
n: 0.0 0.2 0.4 0.6 0.01 0.1 1 1 2 3 4 5 6 7 8 9 10 A (n ) τ =72 ms ωdipτ =0.9a
n: 0.4 0.5 0.6 0.7 0.8 0.1 1 A (4 )f
1 1.5 A(2) 0.5 0.4 0.5 0.6 0.7 0.8 0.1 1 1.5 τ =122 ms, ωdipτ =1.5 A (3 )e
2 1 A(2) 0.5 0.4 0.5 0.6 0.7 0.8 0.1 1 A (4 )d
1.5 1 0.5 0.4 0.5 0.6 0.7 0.8 0.1 1 A (3 ) τ =72 ms, ωdipτ =0.9c
1.5 2 1 0.5Figure 4: Results of lattice simulations with a 1D model (solid symbols) without or with slice selection GSand
dif-fusion attenuation DXe (see legend in plot b), or a full
3D model with GS and DXe (open triangles). a, b:
Re-duced echo amplitudes for fdip=2Hz and different inter
echo times. The solid and dotted lines interpolate values of Eq. 9 at times nτ for the nominal ωdipτ value and an
ap-propriately smaller ωid.τ value, respectively (see text). c,d
(resp. e,f): Reduced amplitudes of the third and fourth echoes in a (resp. b), plotted as functions of the reduced amplitudes A(2). The solid lines are the ideal case
ampli-tudes of Eq. 9, and the labeled + symbols correspond to the indicated values of ωdipτ .
amplitudes obtained by computer simulations for a sam-ple with infinite transverse size (1D model, solid symbols) and for a finite sample with dimensions corresponding to the xenon experiment (3D model, open triangles). The 1D
Preprint (January 20, 2013) Morgan et al, Multiple echoes due to DDF... 7
simulations in the ideal situation (D = 0, GS = 0, solid
squares in Fig. 4) yield decaying echo amplitudes that are well described by the reduced ratios A(n)id.(ωdipτ ) (Eq. 9,
solid lines). Enhanced echo decays are obtained when slice selection, or diffusion, or both, are included. In con-trast, radiation damping induces a negligible additional attenuation for rates corresponding to our experimental conditions.
The use of a Gaussian selective pulse yields weaker dipo-lar effects and smaller echo amplitudes. This is attributed to the weaker spatial modulation of the longitudinal mag-netization induced at the boundaries of the excited slices. Diffusion-induced attenuation also decreases the ampli-tudes of the echoes and the relative effect of this atten-uation is stronger at longer inter-echo time τ (Fig. 4b). When slice selection and diffusion are both included in the simulations, finite size effects further decrease the am-plitudes of the echoes (full 3D model, open symbols in Fig. 4). The impact of this additional decrease is rather large (especially at short τ , Fig. 4a), given that the sample diameter (1.6 mm, similar to the slice thickness) is larger than the modulation period of the magnetization (0.3 mm for τ =70 ms, 0.18 mm for τ =120 ms). A given echo train usually displays a non-exponential behavior, resembling a stretched exponential for negligible diffusion and ωdipτ <1
(Fig. 4a) or a compressed exponential in opposite condi-tions (Fig. 4b).
For the same numerical results, the reduced amplitudes A(3) and A(4) of the third and fourth echoes are plotted
as a function of A(2) in Figs. 4c to 4f. In this
repre-sentation, the good agreement between simulations and reduced ratios of Bessel functions (Eq. 9, solid lines) that is obtained in the absence of diffusion and of a slice selec-tion gradient is evidenced by the fact that corresponding data points A(n)(solid squares) coincide with A(n)
id. for the
relevant value of ωdipτ . The enhanced decays due to
dif-fusion, slice selection, or edge effects alter the correlation between the successive echo amplitudes in a way that, at fixed ωdip, depends on the inter-echo time τ . At short
echo time (Figs. 4c and 4d), all other simulations yield data points that approximately remain on the lines cor-responding to the analytical solutions but lie at positions associated with smaller values of the parameter ωdipτ . At
long echo time (Figs. 4e and f) the echo amplitudes de-part more and more from the ideal case expectations and the largest discrepancies are obtained for the simulations that include diffusion.
The dotted lines in Figs. 4a and 4b show the envelopes of the multiple echo trains obtained using Eq. 9 with effec-tive values ωid.of the dipolar frequency such that the ideal
model exactly reproduces the results of 3D simulations for A(2):
A(2)id.(ωid.τ ) = A(2)3D(ωdipτ ) (10)
These effective values are significantly smaller than the actual input ones (ωid.τ = 0.54 and 0.61 for ωdipτ = 0.9
and 1.5, respectively), which is due to the enhanced sec-ond echo attenuation induced by the cumulative effects of
slice selection, diffusion, and finite sample size. The ratios between the effective values ωid.and the actual values ωdip
depend on the characteristics of both the physical system and the pulse sequence. Moreover, the amplitudes of the multiple echoes also strongly depend on these operating conditions. Therefore, for a given echo train, the com-parison of amplitudes between the various echoes should provide a sensitive test to evaluate the relevance of theo-retical or numerical models. This is the primary motiva-tion for our experimental procedure, designed to allow the observation of a large number of echoes for various delay times and magnetization values, as well as for the choice of an intermediate echo time (τ = 70 ms) for performing extensive tests on the xenon samples.
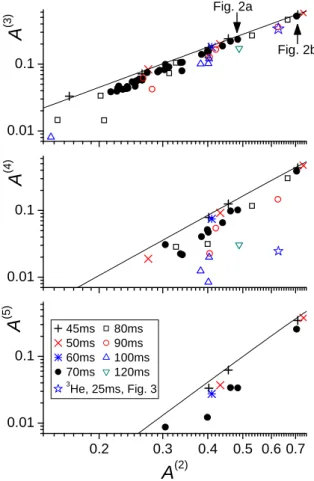
Figure 5 shows a compilation of experimental results obtained with decay times τ ranging from 45 to 120 ms (symbols), for which the reduced echo amplitudes A(3),
A(4), and A(5) plotted as a function of A(2) can be
com-pared to the corresponding analytical solutions (Eq. 9, solid lines). For a wide range of echo attenuations, the data points lie close to the lines, with distances (below the
0.2 0.3 0.4 0.5 0.6 0.7 0.01 0.1
A
(5 )A
(2) 0.01 0.1A
(4 ) 45ms 80ms 50ms 90ms 60ms 100ms 70ms 120ms 3 He, 25ms, Fig. 3 0.01 0.1A
(3 ) Fig. 2a Fig. 2bFigure 5: Experimental reduced echo amplitudes A(3) to
A(5) (top to bottom) are plotted as functions of A(2) for
various τ (symbols, see legend). The lines are the up-per branches (ωdipτ < 1.5) of the corresponding ideal
echo amplitudes A(n)id. (Eq. 9). The data from Fig. 2a (ωdipexpτ = 1.4) and Fig. 2b (ωdipexpτ = 2.5) are indicated by the labelled arrows.
lines) that systematically increase with both τ and n. This is very similar to the results of the simulations (see Figs. 4c-4f). We can thus infer that slice selection, diffusion, and edge effects may all contribute to echo attenuation, with diffusion playing a leading role at long times (large τ and n) in accelerated echo decays. As was done for the comparison of results of 3D simulations to the ideal model (Eq. 10), we consider the effective dipolar frequency ωid.
for which the ideal model (Eq. 9) exactly reproduces the experimental reduced amplitudes A(2). For the recordings
of Figs. 2a and 2b (data marked by arrows in the upper graph in Fig. 5, ωdipτ = 1.4 and 2.5, respectively),
ef-fective values ωid.τ = 0.51 and 0.81 are obtained. These
large ratios between effective and externally determined dipolar frequencies are similar to those observed for 3D simulations, that provide a much better description of the observed attenuations than the ideal model. Indeed, the results displayed in Fig. 4 show that including the effects of diffusion in the model [1,3] corrects for only part of the missing attenuation. Nevertheless, the ratios between the actual and effective dipolar frequency values in the exper-imental cases are still higher than expected from the full 3D lattice simulation (closer to 3 than 2). This quantita-tive difference remains to be clarified. A consequence of the strong reduction of the effective value of the dipolar frequency, is that we could not experimentally achieve ef-fective values of ωid.τ larger than about 1.5, for which the
echo amplitudes are not monotonically decreasing. Sim-ilar behaviors and discrepancies were observed for bulk water data (not shown) and for the helium data. For the latter and for clarity, only the recording displayed in Fig. 3 was used here for comparison to the xenon data, open star in Fig. 5. In this case, diffusion attenuation is sig-nificant at shorter τ and current 3D simulations account fairly well for the measured ratio between the effective and experimental values (ωid.τ = 0.7 and ωdipτ = 0.85,
respectively).
Obtaining a more quantitative model of echo attenua-tions to infer the sample magnetization would fully estab-lish the practical interest of the multiple echo technique. This ability to quantify fdipfor an ex situ transiently
po-larized spin system in a one-scan experiment would rep-resent a good alternative to other methods, such as:
monitoring the dipolar-induced shifts of the reso-nance frequencies [51, 56]; this forbids the lock of the magnet and is consequently sensitive to perturbations (e.g., temperature or magnetic fluctuations). There-fore only a continuous frequency monitoring allows a reliable determination of fdip;
using signal measurements after small excitation pulses, referenced to thermal equilibrium signals and concentration measurements; these two additional measurements are either relatively long if performed on the sample of interest or sensitive to systematic bias if external references are used.
Finally an important additional advantage of the
multiple-echo approach would reside in the use of slice-selection since the determination of fdip would alter only a small
part of the sample magnetization while the rest is pre-served and can be used for other types of experiments.
4.3
Echo distortion and instabilities
Numerical lattice simulations allow the investigation of a range of fdipvalues beyond those where the simple
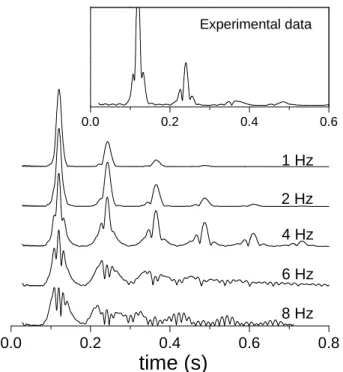
an-alytical model is valid [1, 9]. Figure 6 shows the evolution of computed multiple echoes for increasing dipolar fields, obtained using the 3D model for a finite sample with se-lective excitation and diffusion. The increase of fdipfirst
leads to an increase in the number of echoes, as expected from the analytical solution of the ideal case. When fdip
further increases, the shape of the echoes starts to be dis-torted, and the echoes eventually disappear. Since sig-nificantly larger values of average dipolar fields can be produced by resorting to hyperpolarized species, we ex-perimentally observed signals showing such distortions, with the appearance of small lobes beside the echoes (in-set of Fig. 6 for dissolved laser-polarized 129Xe). As was
noticed in the previous section, there is a fair agreement between numerical simulations and experimental obser-vations, however a ∼50% quantitative difference in the values of fdip still needs to be accounted for. Beside
numerical restraints such as unsufficiently fine graining
0.0 0.2 0.4 0.6 0.8 0.0 0.2 0.4 0.6 8 Hz 6 Hz 4 Hz
time (s)
1 Hz 2 Hz Experimental dataFigure 6: Main plot: numerical 3D lattice simulations of the variation of the echo pattern as a function of fdip
for τ = 120 ms (with slice-selection and taking into ac-count xenon diffusion). Inset: experimental result with a dissolved laser-polarized xenon sample (fdip= 9 Hz). The
vertical scale is chosen so as to better visualize the altered echo shapes.
Preprint (January 20, 2013) Morgan et al, Multiple echoes due to DDF... 9
which prevent carefully considering edge effects, this dis-crepancy may also result from the large sensitivity of the xenon chemical shifts to its surrounding which affects the dipolar flip-flop contributions to the time evolution of the magnetization [10].
The origin of the changes in the shape and number of observed echoes lies in the decreasing efficiency of the applied gradients to refocus the effects of the dipo-lar field [1, 9] since the condition fdip ≪ γGl/2π is no
longer fulfilled (the gradient-induced frequency span in our xenon experiments is approximatively equal to 80 Hz). For numerical simulations with larger gradients the dis-torted echoes indeed appear for larger fdipvalues. In the
original paper on multiple echoes due to distant dipolar fields [1], Deville et al. show situations where the condi-tion of strong enough gradients is not met. In their case, the echo amplitudes increased with time. Here we have used strong enough gradients to prevent the overlap of the echoes. However, the cumulative effect of precession instabilities (similar to those previously described numer-ically and observed experimentally [23, 26, 28, 31]) gave rise to the echo distortions observed in this work and pre-vented the observation of a large number of echoes for large values of fdipand τ .
5
Conclusions
In this article we have explored multiple spin echoes re-sulting from distant dipolar fields in solutions containing laser-polarized xenon-129 or helium-3. The use of these spin systems has allowed the investigation of a large range of conditions in terms of magnetization, spin temperature, diffusion constants, etc ., well beyond what can be ex-plored using thermally polarized spin systems. We have first shown that the usual frameworks (mean field theory or an extended density matrix approach) can be used to describe the dynamics of these hyperpolarized spin sys-tems since they fulfill the two key conditions: (i) pro-tocols are used to ensure an homogeneous evolution of the magnetization described by a single longitudinal self-relaxation time and (ii) the system only consists of single-spin molecules.
The method proposed in the present paper should make it possible to determine the absolute magnetization with-out any separate experiments, just by comparing the ra-tios of echo amplitudes. This would be especially useful since it would allow the determination of the sample mag-netization using only a small slice of the sample while the rest of the sample’s magnetization is preserved. Resort-ing to the processResort-ing method based on ratios of echo amplitudes allows its use for direct and quantitative com-parisons with numerical predictions, and not only qual-itative comparisons of behaviors. Actually, the mean-field computations are in fair agreement with our mea-surements, even for very low spin temperatures. A still unsolved quantitative discrepancy (of about a factor 1.5) is observed between the experimentally measured dipolar
field values fdip(obtained from1H dipolar shift
ments or from polarization and concentration measure-ments) and those used in the numerical simulations for observing the same echo amplitudes. It might result in part from the numerical restraints that currently prevent the simulation of a cylindrical sample with sufficiently fine graining and/or from the large sensitivity of the 129Xe
chemical shift.
From a more general point of view, these systematic numerical studies and their extensive confrontations with experiments for an extended range of parameters reveal that the usual Bessel solutions used to describe the echo modulations can be significantly erroneous due to finite-size and shape effects in the sample, or when non-uniform tipping is used. The importance of these last effects ob-viously questions the usual procedure which consists in resorting to an apparent dipolar field for taking diffu-sion effects into account [57, 58]. This finding may have important consequences on the quantitative exploitation of spectra or images obtained with sequences based on i-MQC in inhomogeneous media or magnetic fields.
Acknowledgements
This research program has been supported by ANR (ANR blanche DIPOL).
References
[1] G. Deville, M. Bernier, J. M. Delrieux, Phys. Rev. B 19(1979) 5666–5688.
[2] D. Einzel, G. Eska, Y. Hirayoshi, T. Kopp, P. Wolfe, Phys. Rev. Lett. 53 (1984) 2312–2315.
[3] R. Bowtell, R. M. Bowley, P. Glover, J. Magn. Reson. 88(1990) 643–651.
[4] H. K¨orber, E. Dormann, G. Eska, J. Magn. Reson. 93(1991) 589–595.
[5] F. M. Alessandri, S. Capuani, B. Maraviglia, J. Magn. Reson. 156 (2002) 72–78.
[6] J. Jeener, J. Chem. Phys. 112 (2000) 5091–5094. [7] A. Abragam, L. Goldman, Nuclear Magnetism:
Or-der and DisorOr-der, (Clarendon Press, Oxford 1982).
[8] J. Jeener, A. Vlassenbroek, P. Broekaert, J. Chem. Phys. 103 (1995) 1309–1332.
[9] J. Jeener, Encyclopedia of NMR, D. M. Grant, R. K. Harris (Eds.), 9, Wiley, 2002, pp. 642–679.
[10] H. Desvaux, Prog. NMR Spectrosc. in press. 10.1016/j.pnmrs.2012.11.001.
[11] W. S. Warren, S. Ahn, M. Mescher, M. Garwood, K. Ugurbil, W. Richter, R. R. Rizi, J. Hopkins, J. S. Leigh, Science 281 (1998) 247–251.
[12] W. S. Warren, W. Richter, A. H. Andreotti, B. T. Farmer, II, Science 262 (1993) 2005–2009.
[13] S. Lee, W. Richter, S. Vathyam, W. S. Warren, J. Chem. Phys. 105 (1996) 874–900.
[14] Q. He, W. Richter, S. Vathyam, W. S. Warren, J. Chem. Phys. 98 (1993) 6779–6800.
[15] W. Richter, S. Lee, W. S. Warren, Q. He, Science 267(1995) 654–657.
[16] S. Vathyam, S. Lee, W. S. Warren, Science 272 (1996) 92–96.
[17] Y. Huang, S. Cai, X. Chen, Z. Chen, J. Magn. Reson. 203(2010) 100–107.
[18] S. Gutteridge, C. Ramanathan, R. Bowtell, Magn. Reson. Med. 47 (2002) 871–879.
[19] S. D. Kennedy, J. H. Zhong, Magn. Reson. Med. 52, (2004) 1–6.
[20] D. Z. Balla, G. Melkus, C. Faber, Magn. Reson. Med. 56(2006) 745–753.
[21] G. Galiana, R. T. Branca, E. R. Jenista, W. S. War-ren, Science 322 (2008) 421–424.
[22] V. Hoerr, A. Purea, C. Faber, Biophys. J. 99 (2010) 2336–2343.
[23] J. Jeener, Phys. Rev. Lett. 82 (1999) 1772–1775. [24] J. Jeener, J. Chem. Phys. 116 (2002) 8439-8446. [25] K. L. Sauer, F. Marion, P. J. Nacher, G. Tastevin,
Phys. Rev. B 63 (2001) 184427.
[26] M. P. Ledbetter, I. M. Savukov, M. V. Romalis, Phys. Rev. Lett. 94 (2005) 060801.
[27] P. P. Z¨anker, J. Schmiedeskamp, H. W. Spiess, R. H. Acosta, Phys. Rev. Lett. 100 (2008) 213001.
[28] E. Baudin, M. E. Hayden, G. Tastevin, P.-J. Nacher, C. R. Chim. 11 (2008) 560–567.
[29] D. Candela, M. E. Hayden, P. J. Nacher, Phys. Rev. Lett. 73 (1994) 2587–2590.
[30] Y. Y. Lin, N. Lisitza, S. D. Ahn, W. S. Warren, Sci-ence 290 (2000) 118–121.
[31] P. J. Nacher, G. Tastevin, B. Villard, N. Piegay, F. Marion, K. L. Sauer, J. Low Temp. Phys. 121 (2000) 743–748.
[32] S. Y. Huang, Y. Y. Lin, N. Lisitza, W. S. Warren, J. Chem. Phys. 116 (2002) 10325–10337.
[33] S. Y. Huang, J. D. Walls, Y. Wang, W. S. Warren, Y. Y. Lin, J. Chem. Phys. 121 (2004) 6105–6109. [34] M. E. Hayden, E. Baudin, G. Tastevin, P. J. Nacher,
Phys. Rev. Lett. 99 (2007) 137602.
[35] D. J. Y. Marion, G. Huber, P. Berthault, H. Desvaux, ChemPhysChem 9 (2008) 1395–1401.
[36] D. J. Y. Marion, P. Berthault, H. Desvaux, Eur. Phys. J. D 51 (2009) 357–367.
[37] E. Jenista, R. Branca, W. Warren, J. Magn. Reson. 196(2009) 74–77.
[38] M. Mishkovsky, U. Eliav, G. Navon, L. Frydman, J. Magn. Reson. 200 (2009) 142–146.
[39] X. Tang, H. Ong, K. Shannon, W. S. Warren, Magn. Reson. Imaging 21 (2003) 1141–1149.
[40] J. D. Walls, F. K. H. Phoa, Y. Y. Lin, Phys. Rev. B 70(2004) 174410.
[41] A. Abragam, M. Chapellier, J. F. Jacquinot, M. Goldman, J. Magn. Reson. 10 (1973) 322–346. [42] Y. M. Chen, R. T. Branca, W. S. Warren, J. Chem .
Phys. 136, (2012) 204509.
[43] J. Ardenkjaer-Larsen, B. Fridlund, A. Gram, G. Hansson, L. Hansson, M. Lerche, R. Servin, M. Thaning, K. Golman, Proc. Natl. Acad. Sci. U.S.A. 100 (2003) 10158–10163.
[44] M.E. Merritt, C. Harrison, W. Mander, C.R. Malloy, A.D. Sherry, J. Magn. Reson. 189 (2007) 280–285. [45] H. Desvaux, P. Berthault, Prog. Nucl. Magn. Reson.
Spectrosc. 35 (1999) 295–340.
[46] M. Goldman, H. Desvaux, Chem. Phys. Lett. 256 (1996) 497–501.
[47] J. G. Powles, P. Mansfield, Phys. Lett. 2 (1962) 58– 59.
[48] H. Desvaux, T. Gautier, G. Le Goff, M. P´etro, P. Berthault, Eur. Phys. J. D 12 (2000) 289–296. [49] P. Berthault, G. Huber, H. Desvaux, Prog. Nucl.
Magn. Reson. Spectrosc. 55 (2009) 35–60.
[50] H. L. Clever, IUPAC Solubility Data Series, (Perga-mon Press, 1979).
[51] D. J. Y. Marion, G. Huber, L. Dubois, P. Berthault, H. Desvaux, J. Magn. Reson. 187 (2007) 78–87. [52] D. J. Y. Marion, H. Desvaux, J. Magn. Reson. 193
(2008) 153–157.
[53] E. Baudin, K. Safiullin, S. W. Morgan, P. J. Nacher, J. Phys.: Conf. Ser. 294 (2011) 012009.
[54] T. Enss, S. Ahn, W. S. Warren, Chem. Phys. Lett. 305(1999) 101–108.
[55] C. B. Cai, Z. Chen, S. H. Cai, J. H. Zhong J. Magn. Reson. 172, (2005) 242–253.
[56] H. T. Edzes, J. Magn. Reson. 86 (1990) 293–303. [57] I. Ardelean, E. Kossel, R. Kimmich, J. Chem. Phys.
114(2001) 8520–8529.
[58] C. Ramanathan, R. Bowtell, J. Chem. Phys. 114 (2001) 10854–10859.