Effects of Statins to Reduce All-Cause Mortality in Heart Failure
Patients: Findings from the EPICAL2 Cohort Study
Muaamar Al-Gobari1,2 · Nelly Agrinier3,5 · Marc Soudant3,5 · Bernard Burnand1 · Nathalie Thilly4,5
Abstract
Introduction The addition of statins to standard care in heart failure (HF) patients remains controversial in clinical practice. Large-scale clinical trials failed to show mortality benefits, but uncertainty persists in real-world settings.
Objective We evaluated whether the prescription of statins at hospital discharge is associated with a reduction in all-cause mortality at up to 1 year of follow-up in HF patients.
Methods We analyzed data from Epidémiologie et Pronostic de l’Insuffisance Cardiaque Aiguë en Lorraine (EPICAL2) cohort study of 2254 hospitalized acute HF patients who were admitted to 21 hospitals located in northeast France for acute HF between October 2011 and October 2012 and who received statins at discharge compared with patients who did not. We used propensity score matching and instrumental variable analyses to estimate the treatment effects of statins, and a multivariable Cox proportional-hazards model to examine survival with statin use, adjusting for patient demographics, HF characteristics, medical history, comorbidities, drug treatment and other known potential confounders. We plotted Kaplan– Meier survivor curves, and used log-rank test to determine the equality of survivor functions.
Results We included 2032 patients in this investigation: 919 (45%) in the statin-treated group and 1113 (55%) in the control group. The estimated average statin-treatment effects for all-cause mortality in HF failed to demonstrate a significant effect on mortality [Z = − 1.73, 95% confidence interval (CI) − 0.11 to 0.007, p value = 0.083, and Z = − 0.95, 95% CI − 1.34 to 0.46, p value = 0.34] for propensity score matching and instrumental variable analyses, respectively. Moreover, the Cox proportional-hazards model showed that statin prescription was not significantly associated with the rate of death (hazard ratio = 0.85, 95% CI 0.66–1.11, p value = 0.26), adjusted for all confounders.
Conclusion In patients with HF (and reduced or preserved ejection fraction), the prescription of statins did not appear to be associated with better survival after 1 year of follow-up in the EPICAL2 cohort. We cannot exclude that a subpopulation of HF patients may have some benefits compared with the whole HF population or that there might be a lack of power to show such effect.
Clinical Trial Registration NCT02880358.
* Muaamar Al-Gobari
1
Center for Primary Care and Public Health (Unisanté) and Cochrane Switzerland, University of Lausanne, Biopôle 2 SV-A, Route de la Corniche 10, 1010 Lausanne, Switzerland
2 Institute of Family Medicine, University of Fribourg,
Fribourg, Switzerland
3 Inserm, CHRU Nancy, Université de Lorraine, CIC-1433,
Epidémiologie Clinique, 54000 Nancy, France
4 CHRU Nancy, Université de Lorraine, Plateforme d’Aide à la
Recherche Clinique, 54000 Nancy, France
5 Université de Lorraine, APEMAC, 54000 Nancy, France
http://doc.rero.ch
Published in "American Journal of Cardiovascular Drugs 19(5): 497–508, 2019"
which should be cited to refer to this work.
Key Points
There is moderate evidence from large-scale clinical tri-als and meta-analyses that statins fail to reduce mortal-ity in heart failure (HF) patients, including ischemic cardiomyopathy.
Scarce real-world data exist in the literature to encourage or discourage the use of statins in clinical practice. Our Epidémiologie et Pronostic de l’Insuffisance Car-diaque Aiguë en Lorraine (EPICAL2) observational cohort study failed to show mortality benefits for statin use post-discharge, in line with large-scale clinical trials, but we do not exclude potential benefits in a specific HF subpopulation.
1 Introduction
Despite progress and current advances in heart failure (HF) therapies, 50% of patients die within 5 years of initial diag-nosis [1]. Therefore, there is a growing need to prevent all-cause mortality and to optimize therapeutic strategies. 3-Hydroxy-3-methylglutaryl coenzyme A (HMG-CoA) reductase inhibitors, or simply “statins,” in addition to drugs recommended in HF [angiotensin-converting enzyme inhibitors (ACE-i), beta-blockers (BBs), and mineralocor-ticoid inhibitors], have been hypothesized to further reduce mortality compared with usual care. However, HF patients were systematically excluded from most clinical trials with statins, leaving us with limited data and moderate evidence [2]. Unlike large-scale clinical trials [3, 4], some observa-tional studies reported that statins were effective in all-cause mortality reduction [5, 6], raising discrepancies and debates. Therefore, it appeared important to find out if a further anal-ysis of a well-conducted observational study could add new evidence to the current literature. In our analysis, we used data from the Epidémiologie et Pronostic de l’Insuffisance Cardiaque Aiguë en Lorraine (EPICAL2) cohort study of 2254 hospitalized acute HF patients, recruited between October 2011 and October 2012 from 21 hospitals located in the Lorraine region of northeast France, to examine if the prescription of statins at hospital discharge for an HF-related hospitalization was associated with better 1-year survival.
2 Methods
2.1 Participants
The methods of recruitment and patient characteristics have been already published elsewhere [7, 8]. In brief, this cohort (EPICAL2, NCT02880358) included 2254 patients who were hospitalized in the Lorraine region of northeast France (2,350,000 inhabitants, according to the 2012 cen-sus) for acute HF between October 2011 and October 2012 and followed for 1 year after hospital discharge. In our present analysis, we selected patients who were exposed to statin treatment after hospital discharge. The type of statin could be any of the following: rosuvastatin, pravastatin, atorvastatin, simvastatin, lovastatin, fluvastatin, cerivasta-tin and pitavastacerivasta-tin. Besides sociodemographic and clini-cal data, treatment data were collected by standardized forms at inclusion, during the index hospitalization and at discharge [7, 8]. The baseline characteristics of included patients are reported in Table 1. In the present analysis, we excluded patients who died before discharge from the index hospitalization, those who had unknown prescription status for statins, and those who were lost to follow-up or had an unknown vital status after 1 year of follow-up from the index hospitalization (Fig. 1). Of note, the EPICAL2 cohort study was conducted according to the principles of the Declaration of Helsinki and approved by national ethics committees (Comité Consultatif sur le Traitement de l’Information en Matière de Recherche, Commission Nationale de l’Informatique et des Libertés). All eligible patients were informed about the study protocol and were free to refuse to be included in the cohort.
2.2 Variables Selection
Independent variables used for the present analysis were those known to influence mortality and those that might be related to initiating or maintaining statin treatment. These variables were age, gender, hypertension, body mass index (BMI), left ventricular ejection fraction (LVEF), New York Heart Association (NYHA) class III or IV, increased brain natriuretic peptide (BNP) or N-terminal prohormone of brain natriuretic peptide (NT-proBNP), hemoglobin level, alcohol abuse, smoking status, previous history of HF, hospital stay duration, angina, history of stroke/transient ischemic attack (TIA), arrhythmias, dys-lipidemia, history of acute coronary syndrome, chronic obstructive pulmonary disease (COPD)/asthma, diabetes, chronic kidney disease, malignant hemopathies or any can-cer, and usual treatment with BBs, ACE-i, and spironol-actone. We included the prescription of BBs, ACE-i, and
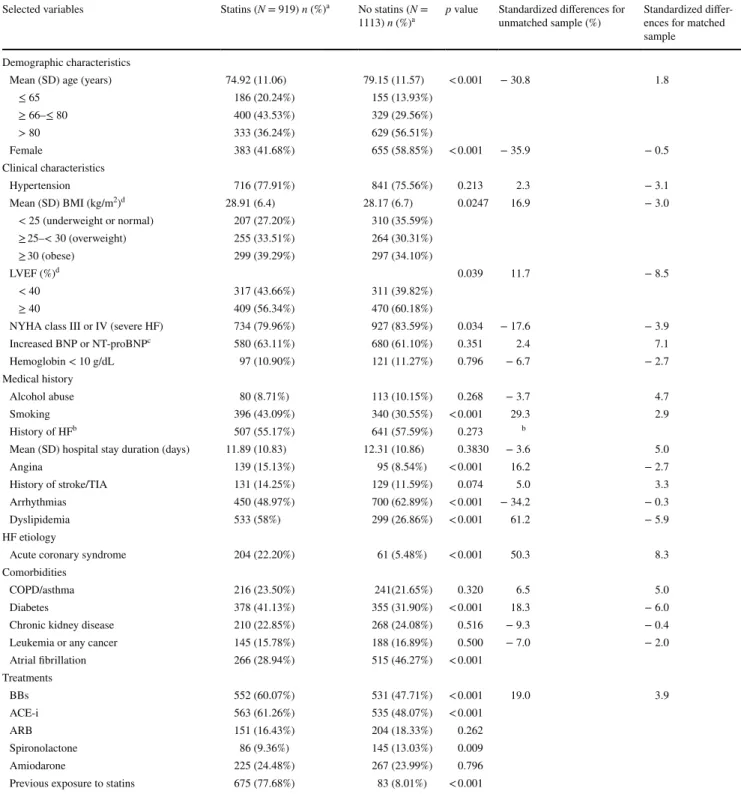
Table 1 Characteristics of included HF patients according to treatment with statins
ACE-i angiotensin-converting-enzyme inhibitor, ARB angiotensin receptor blocker, BBs beta-blockers, BMI body mass index, BNP brain natriu-retic peptide, COPD chronic obstructive pulmonary disease, HF heart failure, LVEF left ventricular ejection fraction, NT-proBNP N-terminal prohormone of brain natriuretic peptide, NYHA New York Heart Association classification, SD standard deviation, TIA transient ischemic attack
a Values are n (%) unless otherwise stated b
Deleted in models for collinearity
c BNP > 400 pg/mL or NT-proBNP > 450 pg/mL in patients < 50 years; NT-proBNP > 900 pg/mL in patients 50–75 years; NT-proBNP >
1800 pg/mL in patients > 75 years [7, 9]
d Variables with missing values (>19%)
Selected variables Statins (N = 919) n (%)a No statins (N =
1113) n (%)a p value Standardized differences for unmatched sample (%) Standardized differ-ences for matched
sample Demographic characteristics
Mean (SD) age (years) 74.92 (11.06) 79.15 (11.57) < 0.001 − 30.8 1.8
≤ 65 186 (20.24%) 155 (13.93%) ≥ 66–≤ 80 400 (43.53%) 329 (29.56%) > 80 333 (36.24%) 629 (56.51%) Female 383 (41.68%) 655 (58.85%) < 0.001 − 35.9 − 0.5 Clinical characteristics Hypertension 716 (77.91%) 841 (75.56%) 0.213 2.3 − 3.1 Mean (SD) BMI (kg/m2)d 28.91 (6.4) 28.17 (6.7) 0.0247 16.9 − 3.0 < 25 (underweight or normal) 207 (27.20%) 310 (35.59%) ≥ 25–< 30 (overweight) 255 (33.51%) 264 (30.31%) ≥ 30 (obese) 299 (39.29%) 297 (34.10%) LVEF (%)d 0.039 11.7 − 8.5 < 40 317 (43.66%) 311 (39.82%) ≥ 40 409 (56.34%) 470 (60.18%)
NYHA class III or IV (severe HF) 734 (79.96%) 927 (83.59%) 0.034 − 17.6 − 3.9
Increased BNP or NT-proBNPc 580 (63.11%) 680 (61.10%) 0.351 2.4 7.1 Hemoglobin < 10 g/dL 97 (10.90%) 121 (11.27%) 0.796 − 6.7 − 2.7 Medical history Alcohol abuse 80 (8.71%) 113 (10.15%) 0.268 − 3.7 4.7 Smoking 396 (43.09%) 340 (30.55%) < 0.001 29.3 2.9 History of HFb 507 (55.17%) 641 (57.59%) 0.273 b
Mean (SD) hospital stay duration (days) 11.89 (10.83) 12.31 (10.86) 0.3830 − 3.6 5.0
Angina 139 (15.13%) 95 (8.54%) < 0.001 16.2 − 2.7
History of stroke/TIA 131 (14.25%) 129 (11.59%) 0.074 5.0 3.3
Arrhythmias 450 (48.97%) 700 (62.89%) < 0.001 − 34.2 − 0.3
Dyslipidemia 533 (58%) 299 (26.86%) < 0.001 61.2 − 5.9
HF etiology
Acute coronary syndrome 204 (22.20%) 61 (5.48%) < 0.001 50.3 8.3
Comorbidities
COPD/asthma 216 (23.50%) 241(21.65%) 0.320 6.5 5.0
Diabetes 378 (41.13%) 355 (31.90%) < 0.001 18.3 − 6.0
Chronic kidney disease 210 (22.85%) 268 (24.08%) 0.516 − 9.3 − 0.4
Leukemia or any cancer 145 (15.78%) 188 (16.89%) 0.500 − 7.0 − 2.0
Atrial fibrillation 266 (28.94%) 515 (46.27%) < 0.001 Treatments BBs 552 (60.07%) 531 (47.71%) < 0.001 19.0 3.9 ACE-i 563 (61.26%) 535 (48.07%) < 0.001 ARB 151 (16.43%) 204 (18.33%) 0.262 Spironolactone 86 (9.36%) 145 (13.03%) 0.009 Amiodarone 225 (24.48%) 267 (23.99%) 0.796
Previous exposure to statins 675 (77.68%) 83 (8.01%) < 0.001
spironolactone among the selected variables because they are known to be associated with a better prognosis [7, 9]. We defined the variable “increased BNP or NT-proBNP (pg/mL)” based on the literature [8, 10] at the time of the EPICAL2 recruitment phase: BNP > 400 pg/mL or proBNP > 450 pg/mL in patients < 50 years, proBNP > 900 pg/mL in patients 50–75 years, and NT-proBNP > 1800 pg/mL in patients > 75 years. For statisti-cal analysis, we dichotomized some variables: hemoglobin level (< 10 g/dL), hospital stay duration (≥ 9 days), and hypertensive cardiomyopathy (yes or no). Variables were prospectively defined in the EPICAL2 study. For example,
comorbidities were determined using International Classi-fication of Diseases 10th Revision (ICD-10) codes in addi-tion to the Charlson Comorbidity Index for data analyses. 2.3 Statistical Analysis
For bivariate analyses, we used Pearson Chi square for dichotomous categorical variables and two-sample unpaired t test for continuous variables. We assumed that the data were normally distributed and used the Shapiro–Wilk and the Shapiro–Francia test statistics to verify normality in addition to plotting histograms. We reported the baseline
Fig. 1 Flow chart for heart
fail-ure patients from Epidémiologie et Pronostic de l’Insuffisance Cardiaque Aiguë en Lor-raine (EPICAL2) to evaluate statin effectiveness on all-cause mortality
characteristics between compared groups. In our study, patients with missing data were deleted from the analyses. We considered a two-sided alpha value of < 5% as statisti-cally significant. We analyzed data with STATA version 14.2 (StataCorp LP, Texas).
2.3.1 Propensity Score Analysis
The propensity score has been defined as the conditional probability of assignment to a particular treatment (here, statins) given a vector of observed covariates [11]. Propen-sity scores allow reducing bias and increasing precision of treatment effects estimation [12, 13]. We calculated the propensity scores (i.e., the probability of being treated with statins) using multivariable logistic regression, without including the outcome (all-cause mortality) and performed balance assessment tests to compare the distribution of covariates between treated and control patients [14]. We used one-to-many matching with replacement as it produced better balance between treated and control groups than one-to-one matching without replacement. Then we estimated treatment effects and their standard errors using propensity score matching methods within a caliper distance of 0.2 [15,
16]. On the propensity score step calculation, we included variables associated with both the outcome and the treatment assignment. The selected independent variables were age, gender, hypertension, BMI, LVEF, NYHA class III or IV, increased BNP or NT-proBNP, hemoglobin level, alcohol abuse, smoking status, hospital stay duration, angina, history of stroke/TIA, arrhythmias, dyslipidemia, history of acute coronary syndrome, COPD/asthma, diabetes, chronic kidney disease, malignant hemopathies or any cancer, atrial fibril-lation, and prescription of beta-blockers, angiotensin-con-verting enzyme inhibitors and spironolactone. We included all aforementioned variables in our models except the variable “history of HF” because of collinearity. We tested beforehand the overlap of the propensity score between the treated and control groups. Thereafter, we checked the bal-ance of the mean of the propensity score throughout the blocks, where eight blocks were created in the propensity scores calculation. We intended to re-specify the selected covariates (by categorizing or dichotomizing, for instance) if imbalance appeared. To avoid imbalance between groups, we deleted the “atrial fibrillation” variable from propensity score calculation as it caused an unsatisfied balance. This is perhaps attributed to the potentially perfect prediction by the variable “arrhythmia”. Nonetheless, we re-entered this variable in the propensity score model in sensitivity analy-ses. For the same reason of achieving balance of covariates, we categorized the variable “age” into three classes (≤ 65, 66–80, and > 80) and dichotomized the variable “hospital stay duration (days)” to < 9 days or ≥ 9 days. Before esti-mating treatment effects, we further assessed the balance
or the distribution of covariates across treated and control groups by measuring the standardized differences between compared groups. We measured the average effect of the treatment on the patients who received the treatment [i.e., the average treatment effects on the treated group (ATT)]. In addition to ATT estimation, we reported the respective standard errors, coefficients, confidence intervals (CIs) and p values.
2.3.2 Instrumental Variable Analysis
Propensity scores balance for measured covariates but not necessarily for unmeasured covariates [16]. Conversely, the instrumental variables approach takes into account unmeas-ured variables that are associated with the treatment but not directly with the outcome. As an instrumental variable, we used the prevalence of statin prescription at discharge in our cohort in participating hospitals, denoted F. The endogenous explanatory variable was the statin treatment, denoted X. The outcome was all-cause mortality, denoted Y. We, there-fore, tested the following hypothesis:
• F is correlated with X, conditional on other covariates. • F has no direct effect on Y, but only via X.
Using a two-stage least squares method, we regressed the instrumental variable, the prevalence of statin treatment in the participating hospitals (dichotomized as above or below the median of 47%), on other covariates previously used for the propensity score analysis. We verified the null hypoth-eses that our instrument is weak and/or that the variables are exogenous (test of endogeneity).
2.3.3 Kaplan–Meier Survival Curves and Cox Proportional-Hazards Model
For survival analyses, we declared our data to be time to event. Our event of interest was all-cause mortality, while the time of follow-up was set up at 1 year and censored after-wards. We plotted Kaplan–Meier survival curves by statin treatment, unadjusted and adjusted, for the same covariates used in the propensity score analysis.
We used a log-rank test to determine the equality of sur-vivor functions, used a stratified log-rank test (on propen-sity scores), and the stratified Wilcoxon (Breslow) test to compare survival curves. To illustrate the increased rate of having an event, we regressed all-cause mortality (the out-come) on independent variables—previously adjusted for in Kaplan–Meier survivor curves—in a multivariable Cox proportional-hazards model with Breslow methods for ties. We verified the proportional-hazards assumption by a global test for all covariates included in the model and based on Schoenfeld residuals for all covariates individually.
2.3.4 Subgroup Analyses
As subgroup analysis was based on the type of HF, we conducted a multiple logistic regression to verify if there were any differences in the effect of statins in such sub-populations. The independent variables were age, gender, hypertension, BMI, NYHA class III or IV, increased BNP or NT-proBNP, hemoglobin level, alcohol abuse, smoking status, hospital stay duration, angina, history of stroke/TIA, arrhythmias, dyslipidemia, history of acute coronary syn-drome, COPD/asthma, diabetes, chronic kidney disease, malignant hemopathies or any cancer, and usual treatment with beta-blockers, angiotensin-converting enzyme inhibi-tors, or spironolactone. As classified in many large-scale ran-domized clinical trials [4, 17], we defined the patients who had an ejection fraction less than 40% as HF with reduced ejection fraction (HFrEF) and those with an ejection frac-tion equal or more than 40% as HF with preserved ejecfrac-tion fraction (HFpEF).
3 Results
3.1 Participants’ Sociodemographic, Medical History, and Clinical Characteristics
As shown in Fig. 1, we analyzed 2032 subjects out of the 2254 included in the cohort. Those treated with statins [treated group (45%)] were compared with those not treated with statins [control group (55%)]. The number of deaths in
our sample was 539; 195 (21%) occurred in the treated group versus 344 (31%) in the control group.
Table 1 shows comparisons of demographic, clinical and therapeutic characteristics between the group treated with statins and the control group. Statin-group patients were younger and more often male and smokers; they had less severe HF, but more often had angina or a history of acute coronary syndrome, dyslipidemia, or diabetes. However, they less often had arrhythmia or atrial fibrillation related events. In addition, statin-group patients were more often treated with BBs and ACE-i, and were more exposed to statins before hospitalization, but were less often treated with spironolactone. The test of normality for the selected variables, including the Shapiro–Wilk and Shapiro–Francia statistics, confirmed our hypothesis of normality assumption. 3.2 Propensity Score Matching
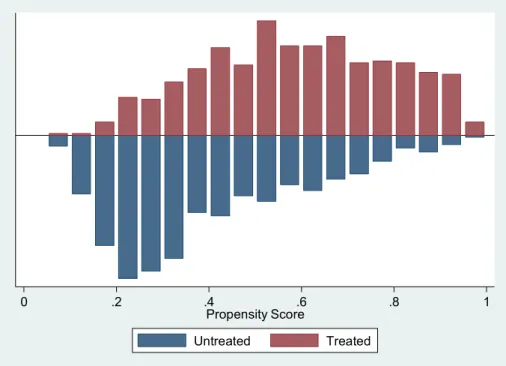
Once the propensity scores were calculated, we assessed the overlap of the propensity scores between the treated and control groups that appeared subjectively satisfying (Fig. 2). After that, we matched the treated group to the control group and estimated the ATT. The matched sample had 1197 patients (60%), excluding 835 observations with missing values in the following covariates: LVEF, BMI, hospital stay duration, and hemoglobin level. We describe the characteristics of unmatched compared with matched patients in Table 2.
After propensity score matching, t tests showed that the distributions of covariates were balanced between treated and control groups, except for the variable hypertension,
Fig. 2 Distribution and degree
of overlap of the propensity score between statin-treated and control groups in the included HF patients. HF heart failure
0 .2 .4 .6 .8 1
Propensity Score
Untreated Treated
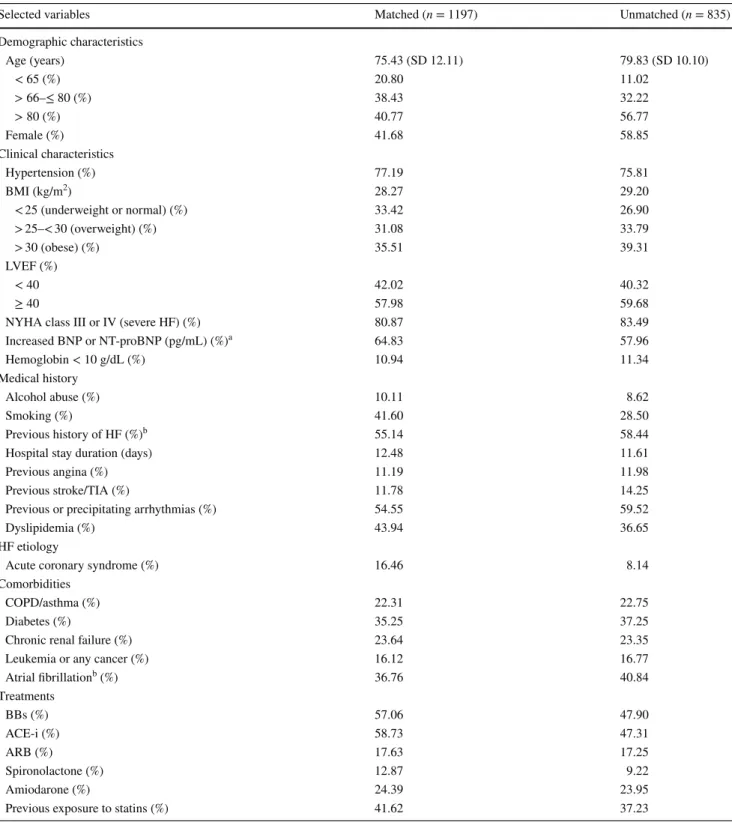
Table 2 Characteristics of matched and unmatched patients according to propensity scores
ACE-i angiotensin-converting-enzyme inhibitor, ARB angiotensin receptor blocker, BBs beta-blockers, BMI body mass index, BNP brain natriu-retic peptide, COPD chronic obstructive pulmonary disease, HF heart failure, LVEF left ventricular ejection fraction, NT-proBNP N-terminal prohormone of brain natriuretic peptide, NYHA New York Heart Association classification, SD standard deviation, TIA transient ischemic attack
a BNP > 400 pg/mL or NT-proBNP > 450 pg/mL in patients < 50 years; NT-proBNP > 900 pg/mL in patients 50–75 years; NT-proBNP
> 1800 pg/mL in patients > 75 years [7, 9]
b
Deleted in models for collinearity
Selected variables Matched (n = 1197) Unmatched (n = 835)
Demographic characteristics Age (years) 75.43 (SD 12.11) 79.83 (SD 10.10) < 65 (%) 20.80 11.02 > 66–≤ 80 (%) 38.43 32.22 > 80 (%) 40.77 56.77 Female (%) 41.68 58.85 Clinical characteristics Hypertension (%) 77.19 75.81 BMI (kg/m2) 28.27 29.20 < 25 (underweight or normal) (%) 33.42 26.90 > 25–< 30 (overweight) (%) 31.08 33.79 > 30 (obese) (%) 35.51 39.31 LVEF (%) < 40 42.02 40.32 ≥ 40 57.98 59.68
NYHA class III or IV (severe HF) (%) 80.87 83.49
Increased BNP or NT-proBNP (pg/mL) (%)a 64.83 57.96 Hemoglobin < 10 g/dL (%) 10.94 11.34 Medical history Alcohol abuse (%) 10.11 8.62 Smoking (%) 41.60 28.50 Previous history of HF (%)b 55.14 58.44
Hospital stay duration (days) 12.48 11.61
Previous angina (%) 11.19 11.98
Previous stroke/TIA (%) 11.78 14.25
Previous or precipitating arrhythmias (%) 54.55 59.52
Dyslipidemia (%) 43.94 36.65
HF etiology
Acute coronary syndrome (%) 16.46 8.14
Comorbidities
COPD/asthma (%) 22.31 22.75
Diabetes (%) 35.25 37.25
Chronic renal failure (%) 23.64 23.35
Leukemia or any cancer (%) 16.12 16.77
Atrial fibrillationb (%) 36.76 40.84 Treatments BBs (%) 57.06 47.90 ACE-i (%) 58.73 47.31 ARB (%) 17.63 17.25 Spironolactone (%) 12.87 9.22 Amiodarone (%) 24.39 23.95
Previous exposure to statins (%) 41.62 37.23
which showed imbalance in one block. In addition, the lack of difference between the statin and control groups was con-firmed by the standardized differences (18.2% for unmatched sample versus 5.3% for matched sample). In the matching step, the number of matches per observation that had the best distribution of covariates among compared groups was three (maximum, four), and the caliper used was 0.2 times the standard deviation of the logit of the propensity scores. As a result, the estimated satin-treatment effects (ATT) for all-cause mortality in HF showed no evidence of significant reduction [coefficient = − 0.055, AI robust standard error = 0.032; Z = − 1.73 (95% CI − 0.11 to 0.007); p value = 0.083]. The re-entry of the variable “atrial fibrillation” into the propensity score model caused unsatisfied balance in one block, but the estimated ATT were still insignificant [coefficient = − 0.056, AI robust standard error = 0.029; Z = − 1.89 (95% CI − 0.11 to 0.002); p value = 0.058]. 3.3 Instrumental Variable Analysis
Our instrumental variable, designated as the prevalence of statin prescription (denoted F) in participating hospitals, was associated with the treatment (denoted X) conditional on other covariates (p value = 0.019). In addition, F showed no direct association with the outcome, all-cause mortality (denoted Y). The test of endogeneity [Durbin (score) and Wu–Hausman] failed to reject our null hypothesis that the variables were exogenous (p value = 0.3). With the two-stage least squares treatment estimation, the instrumental
variable regression did not show a significant decrease in death in the statin group versus the control group [coefficient = − 0.43, standard error = 0.46; Z = − 0.95 (95% CI − 1.34 to 0.46); p value = 0.34].
3.4 Kaplan–Meier Curves and Cox Proportional-Hazards Model
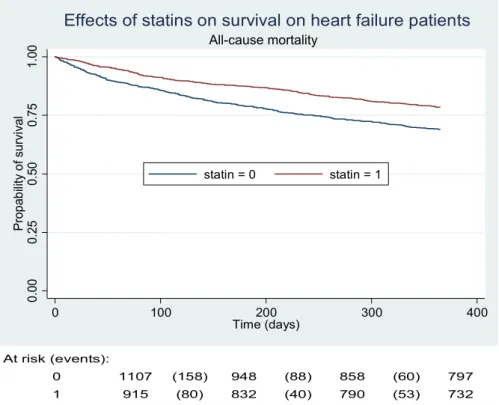
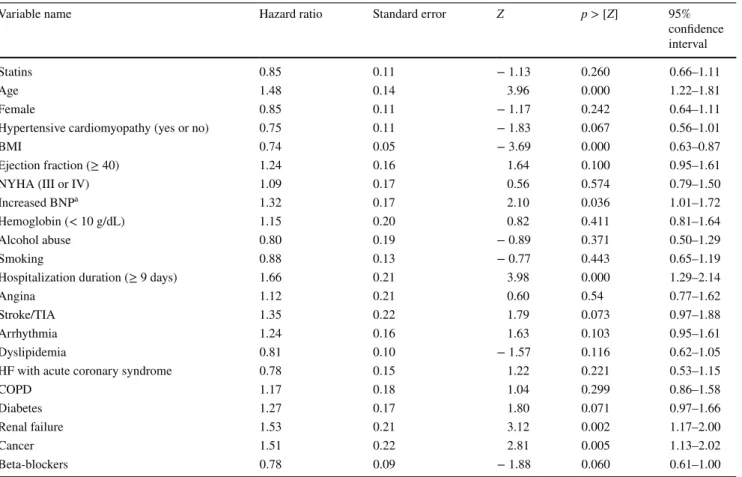
As mentioned before, the number of deaths in our study was 539; 195 (21%) occurred in the treated group versus 344 (31%) in the control group. Unadjusted Kaplan–Meier survivor curves (Fig. 3) and the log-rank test showed sig-nificant results (p value < 0.001). However, the adjusted Kaplan–Meier survivor curves and the stratified log-rank test failed to show a significant difference between the statin and control groups (p value = 0.317) (Fig. 4). We had similar results when we used a stratified log-rank test on propensity scores (p value = 1.00). Moreover, the multivariable Cox proportional-hazards model showed that statin use was not significantly associated with the rate of death [hazard ratio (HR) = 0.85 (95% CI 0.66–1.11), p value = 0.26, and HR = 0.86 (95% CI 0.66–1.13), p value = 0.3] when adjusted for the aforementioned independent variables or the propensity scores, respectively (see Table 3). The test of proportional-hazard assumption was globally satisfied (p value = 0.21), but it appeared that the variable “hospital stay duration” was not, when checked individually. Consequently, we re-ran the Cox model without this variable, but the output stayed almost similar for statin treatment (p value = 0.20) and the
Fig. 3 One-year survival in
statin and control groups (unad-justed Kaplan–Meier survivor curves) 0. 00 0. 25 0. 50 0. 75 1. 00 Pro p ab ili ty o f survi va l 0 100 200 300 400 Time (days) statin = 0 statin = 1 All-cause mortality
Effects of statins on survival on heart failure patients
At risk (events):
0 1107 (158) 948 (88) 858 (60) 797
1 915 (80) 832 (40) 790 (53) 732
Fig. 4 One-year survival in
sta-tin and control groups (adjusted Kaplan–Meier survivor curves)
0. 00 0. 25 0. 50 0. 75 1. 00 Propability of survival 0 100 200 300 400 Time (days) statin = 0 statin = 1 All-cause mortality
Effects of statins on survival on heart failure patients
Table 3 Hazard ratios for the independent variable (statins) and the explanatory variables
BMI body mass index, BNP brain natriuretic peptide, COPD chronic obstructive pulmonary disease, HF heart failure, NT-proBNP N-terminal prohormone of brain natriuretic peptide, NYHA New York Heart Association classification, TIA transient ischemic attack
a BNP > 400 pg/mL or NT-proBNP > 450 pg/mL in patients < 50 years; NT-proBNP > 900 pg/mL in patients 50–75 years; NT-proBNP
> 1800 pg/mL in patients > 75 years [7, 9]
Variable name Hazard ratio Standard error Z p > [Z] 95%
confidence interval
Statins 0.85 0.11 − 1.13 0.260 0.66–1.11
Age 1.48 0.14 3.96 0.000 1.22–1.81
Female 0.85 0.11 − 1.17 0.242 0.64–1.11
Hypertensive cardiomyopathy (yes or no) 0.75 0.11 − 1.83 0.067 0.56–1.01
BMI 0.74 0.05 − 3.69 0.000 0.63–0.87
Ejection fraction (≥ 40) 1.24 0.16 1.64 0.100 0.95–1.61
NYHA (III or IV) 1.09 0.17 0.56 0.574 0.79–1.50
Increased BNPa 1.32 0.17 2.10 0.036 1.01–1.72
Hemoglobin (< 10 g/dL) 1.15 0.20 0.82 0.411 0.81–1.64
Alcohol abuse 0.80 0.19 − 0.89 0.371 0.50–1.29
Smoking 0.88 0.13 − 0.77 0.443 0.65–1.19
Hospitalization duration (≥ 9 days) 1.66 0.21 3.98 0.000 1.29–2.14
Angina 1.12 0.21 0.60 0.54 0.77–1.62
Stroke/TIA 1.35 0.22 1.79 0.073 0.97–1.88
Arrhythmia 1.24 0.16 1.63 0.103 0.95–1.61
Dyslipidemia 0.81 0.10 − 1.57 0.116 0.62–1.05
HF with acute coronary syndrome 0.78 0.15 1.22 0.221 0.53–1.15
COPD 1.17 0.18 1.04 0.299 0.86–1.58 Diabetes 1.27 0.17 1.80 0.071 0.97–1.66 Renal failure 1.53 0.21 3.12 0.002 1.17–2.00 Cancer 1.51 0.22 2.81 0.005 1.13–2.02 Beta-blockers 0.78 0.09 − 1.88 0.060 0.61–1.00
http://doc.rero.ch
global test of proportional-hazard assumption was satisfied again (p value = 0.69).
3.5 Subgroup Analyses
There were no differences in the effects of statins on HFrEF and HFpEF [odds ratio (OR) = 0.66 (95% CI 0.40–1.09), p = 0.10, and OR = 1.08 (95% CI 0.70–1.65), p = 0.71, respectively]. Paradoxically, the effects of statins appeared statistically significant in patients with unknown or missing data on ejection fraction [n = 525 (≈ 26%)], where OR = 0.48 (95% CI 0.25–0.90), p = 0.02.
4 Discussion
Statins are not solely recommended in HF, but are still widely prescribed in current practice [18], and in contrast, observational studies have often reported mortality ben-efits [6, 19]. Our analysis from the EPICAL2 cohort failed to show an impact of statins on all-cause mortality in HF. These results are in accordance with those found in previous clinical trials and a meta-analysis of randomized clinical trials [2–4]. Patients who received statins were younger and more often male, obese, and subject to comorbidities (diabe-tes, kidney disease), but had less severe HF, less often expe-rienced arrhythmia or atrial fibrillation, were more often treated with BBs and ACE-i, and were previously more exposed to statins.
Our study used propensity score matching to estimate treatment effects. This method is believed to reduce inher-ent biases like allocation or selection bias. We verified covariate balance by measuring standardized differences before and after matching. A balance of covariates is sat-isfied if it results in a standardized difference of < 21.2% [20–22]. We estimated the ATT (i.e., an estimation on the average) because it is an interesting summary of individ-ual causal effects [23]. An instrumental variable is often difficult to identify and has to be strongly related to the treatment and indirectly to the outcome. An instrument is potentially bad if it is correlated with omitted variables or the error term [24]. Our instrument “prevalence of statin prescription by participating hospital” appeared poten-tially strong, and we were able to estimate the treatment by statins using a two-stage least square regression. The similar results from the instrumental variable approach and propensity score analyses might be of interest [25]. In subgroup analysis according to the type of HF (HFrEF and HFpEF), the effects of statins on mortality outcome remained statistically insignificant. This result might be in conflict with the study of Nochioka et al. [5] that reported
mortality benefits in HFpEF. Nevertheless, it could be attributed to a smaller sample size and different classifi-cation of patients in our study: patients with an ejection fraction of ≥ 50% were considered HFpEF versus ≥ 40% in our analysis.
We acknowledge several limitations. First, we adjusted for selected variables that we believe were related to both the treatment assignment and the outcome. Even if the assumption of treatment assignment ignorability is satis-fied, because of selection of observable covariates, a selec-tion bias still potentially exists [26]. Second, we ignored the fact that we could have included in our models only those variables with significant p values; doing so might have been a source of bias, as we might have failed to include a relevant variable that might affect the outcome. Third, statin treatment is considered among the choles-terol-lowering drugs, and our analysis did not include any cholesterol level measurement at baseline or follow-up. Fourth, the variables (LVEF, BMI, hospital stay dura-tion, and hemoglobin level) used in the propensity score model had missing values, and the way to deal with this missingness involved other methods [27, 28] to be con-sidered in further research, and this might lead to a lack of power in our results. Fifth, Kaplan–Meier curves did not have censored patients other than those who survived beyond 1 year of follow-up (potential performance bias). Those who left the study before the end or who were lost to up at some time during the study’s 1-year follow-up were deleted at the pre-analysis level (Fig. 1) instead of being censored. This was due to our primary analysis method that involved propensity score analyses. Moreover, only all-cause mortality was recorded, not the more spe-cific HF-related mortality, with only 1-year of follow-up and no other relevant outcomes (e.g., rehospitalization). Sixth, our study did not follow patients’ drug prescrip-tions from a family physician, for instance, after hospital discharge, nor the observance and real intake of statins. Seventh, we were not able to undergo further subgroup analyses [e.g., according to the type of statin (hydrophilic versus lipophilic)]. One potential reason was due to our relatively small population and the presence of missing data. Eighth, our data dated back to 2011/2012, which might be seen as relatively old. However, we noticed that there was little change in clinical practice concerning our studied question. For instance, the recommendations of the European Society of cardiology (ESC) regarding statin use in HF had not changed from the old version (2013) to the more recent one (2016). Thus, this is unlikely to impact our results from EPICAL2 data. Finally, our study provides evidence consistent with large-scale randomized clinical trials and recent systematic reviews and current ESC guidelines [2–4, 29], though it should be interpreted with caution considering the aforementioned limitations.
5 Conclusions
Statins prescription was not associated with a decrease in all-cause mortality in the statin-treated group in HF patients (with reduced or preserved ejection fraction) after 1-year from hospital discharge compared with those not treated with statins. Within its limitations, our study adds evidence to the current literature, as our results are based on real-world data.
Acknowledgements The authors thank all physicians from the 21
par-ticipating centers in the EPICAL2 clinical cohort study (Hôpitaux de Brabois et Hôpital Central, CHU Nancy; CH Luneville; Espace chirur-gical Ambroise Paré Nancy; CH Alpha Santé Mont-Saint-Martin; CH Pont-à-Mousson; CH Saint-Nicolas Verdun; Hôpital Bon-Secours CHR Metz; CH Freyming Merlebach; Hôpital Sainte-Blandine Metz; Hôpital Bel Air CHR Thionville; CH Marie-Madeleine Forbach; Hôpital Alpha Santé Hayange; CH Nicolas Sarrebourg; Hôpital Lemire Saint-Avold; Hôpital des Armées Legouest Metz; Clinique Claude Bernard Metz; CH Saint-Charles Saint-Dié; CH Jean Monnet Epinal; CH Neu-fchateau; CH Vittel). We would also like to thank all participants and patients of EPICAL2. Special thanks are due to Patrick Taffé, statisti-cian, for counseling.
Author contributions Conception and design: MA, BB, and NT.
Writ-ing the initial draft of the manuscript: MA. Contribution to writWrit-ing and editing: MA, NA, BB, and NT. Critical analysis: MA, NA, MS, BB, and NT. Data management: MA and MS. Statistical analyses: MA. Proofread and approved the final version of the manuscript: MA, NA, MS, BB, and NT.
Compliance with Ethical Standards
Funding The EPICAL2 cohort study received a grant from the
National Hospital Program of Clinical Research (PHRC 2009) of the French Ministry of Health. MA, the corresponding author, received a financial Grant (2014.0193) from the Federal Department of Economic Affairs, Education and Research (EAER), Switzerland. All researchers were independent from funders.
Conflict of interest The authors, MA, NA, MS, BB and NT, declare
that they have no potential conflicts of interest that might be relevant to the contents of this manuscript.
References
1. Roger VL, Go AS, Lloyd-Jones DM, Benjamin EJ, Berry JD, Borden WB, et al. Heart disease and stroke statistics—2012 update: a report from the American Heart Association. Circu-lation. 2012;125(1):e2–220. https ://doi.org/10.1161/CIR.0b013 e3182 3ac04 6(Epub 2011/12/20).
2. Al-Gobari M, Le HH, Fall M, Gueyffier F, Burnand B. No ben-efits of statins for sudden cardiac death prevention in patients with heart failure and reduced ejection fraction: a meta-analysis of randomized controlled trials. PLoS One. 2017;12(2):e0171168.
https ://doi.org/10.1371/journ al.pone.01711 68(Epub 2017/02/07).
3. Kjekshus J, Apetrei E, Barrios V, Bohm M, Cleland JG, Cornel JH, et al. Rosuvastatin in older patients with systolic heart failure.
N Engl J Med. 2007;357(22):2248–61. https ://doi.org/10.1056/ NEJMo a0706 201(Epub 2007/11/07).
4. Tavazzi L, Maggioni AP, Marchioli R, Barlera S, Franzosi MG, Latini R, et al. Effect of rosuvastatin in patients with chronic heart failure (the GISSI-HF trial): a randomised, double-blind, placebo-controlled trial. Lancet (London, Eng-land). 2008;372(9645):1231–9. https ://doi.org/10.1016/s0140 -6736(08)61240 -4(Epub 2008/09/02).
5. Nochioka K, Sakata Y, Miyata S, Miura M, Takada T, Tadaki S, et al. Prognostic impact of statin use in patients with heart failure and preserved ejection fraction. Circ J. 2015;79(3):574–82. https ://doi.org/10.1253/circj .CJ-14-0865(Epub 2015/03/10).
6. Alehagen U, Benson L, Edner M, Dahlstrom U, Lund LH. Asso-ciation between use of statins and outcomes in heart failure with reduced ejection fraction: prospective propensity score matched cohort study of 21,864 patients in the Swedish Heart Failure Reg-istry. Circ Heart Fail. 2015;8(2):252–60. https ://doi.org/10.1161/ circh eartf ailur e.114.00173 0(Epub 2015/01/13).
7. Busson A, Thilly N, Laborde-Casterot H, Alla F, Messikh Z, Clerc-Urmes I, et al. Effectiveness of guideline-consistent heart failure drug prescriptions at hospital discharge on 1-year mor-tality: results from the EPICAL2 cohort study. Eur J Internal Med. 2018. https ://doi.org/10.1016/j.ejim.2017.12.005(Epub
2018/01/07).
8. Laborde-Casterot H, Agrinier N, Zannad F, Mebazaa A, Rossignol P, Girerd N, et al. Effectiveness of a multidisciplinary heart fail-ure disease management programme on 1-year mortality: pro-spective cohort study. Medicine. 2016;95(37):e4399. https ://doi. org/10.1097/md.00000 00000 00439 9(Epub 2016/09/16).
9. Bouvy ML, Heerdink ER, Leufkens HG, Hoes AW. Predicting mortality in patients with heart failure: a pragmatic approach. Heart (British Cardiac Society). 2003;89(6):605–9 (Epub
2003/05/16).
10. Maisel A, Mueller C, Adams K Jr, Anker SD, Aspromonte N, Cleland JG, et al. State of the art: using natriuretic peptide levels in clinical practice. Eur J Heart Fail. 2008;10(9):824–39. https :// doi.org/10.1016/j.ejhea rt.2008.07.014(Epub 2008/09/02).
11. Rosenbaum PR, Rubin DB. The central role of the propensity score in observational studies for causal effects. Biometrika. 1983;70(1):41–55.
12. Rubin DB. The design versus the analysis of observational studies for causal effects: parallels with the design of randomized trials. Stat Med. 2007;26(1):20–36. https ://doi.org/10.1002/sim.2739
(Epub 2006/10/31).
13. Austin PC. An introduction to propensity score methods for reduc-ing the effects of confoundreduc-ing in observational studies. Multivar Behav Res. 2011;46(3):399–424. https ://doi.org/10.1080/00273 171.2011.56878 6(Epub 2011/08/06).
14. Becker S, Ichino A. Estimation of average treatment effects based on propensity scores. Stata J. 2002;2(4):358–77.
15. Austin PC. The use of propensity score methods with sur-vival or time-to-event outcomes: reporting measures of effect similar to those used in randomized experiments. Stat Med. 2014;33(7):1242–58. https ://doi.org/10.1002/sim.5984(Epub
2013/10/15).
16. Garrido MM, Kelley AS, Paris J, Roza K, Meier DE, Morri-son RS, et al. Methods for constructing and assessing propen-sity scores. Health Serv Res. 2014;49(5):1701–20. https ://doi. org/10.1111/1475-6773.12182 (Epub 2014/05/02).
17. Al-Gobari M, Al-Aqeel S, Gueyffier F, Burnand B. Effectiveness of drug interventions to prevent sudden cardiac death in patients with heart failure and reduced ejection fraction: an overview of systematic reviews. BMJ Open. 2018;8(7):e021108. https ://doi. org/10.1136/bmjop en-2017-02110 8(Epub 2018/07/30).
18. Hopper I, Samuel R, Hayward C, Tonkin A, Krum H. Can medi-cations be safely withdrawn in patients with stable chronic heart
failure? Systematic review and meta-analysis. J Cardiac Fail. 2014;20(7):522–32. https ://doi.org/10.1016/j.cardf ail.2014.04.013
(Epub 2014/04/22).
19. Fukuta H, Goto T, Wakami K, Ohte N. The effect of statins on mortality in heart failure with preserved ejection fraction: a meta-analysis of propensity score analyses. Int J Cardiol. 2016;214:301–6. https ://doi.org/10.1016/j.ijcar d.2016.03.186
(Epub 2016/04/16).
20. Austin PC. Balance diagnostics for comparing the distribution of baseline covariates between treatment groups in propensity-score matched samples. Stat Med. 2009;28(25):3083–107. https ://doi. org/10.1002/sim.3697(Epub 2009/09/17).
21. Rosenbaum PR, Rubin DB. Constructing a control group using multivariate matched sampling methods that incorporate the propensity score. Am Stat. 1985;39(1):33–8. https ://doi. org/10.1080/00031 305.1985.10479 383.
22. Rubin DB. Using propensity scores to help design observa-tional studies: application to the tobacco litigation. Health Serv Outcomes Res Methodol. 2001;2(3):169–88. https ://doi. org/10.1023/a:10203 63010 465.
23. Arpino B, Cannas M. Propensity score matching with clustered data. An application to the estimation of the impact of caesarean section on the Apgar score. Stat Med. 2016;35(12):2074–91. https ://doi.org/10.1002/sim.6880(Epub 2016/02/03).
24. Angrist JD, Krueger AB. Instrumental variables and the search for identification: from supply and demand to natural experiments.
J Econ Perspect. 2001;15(4):69–85. https ://doi.org/10.1257/ jep.15.4.69.
25. Laborde-Casterot H, Agrinier N, Thilly N. Performing both pro-pensity score and instrumental variable analyses in observational studies often leads to discrepant results: a systematic review. J Clin Epidemiol. 2015;68(10):1232–40. https ://doi.org/10.1016/j. jclin epi.2015.04.003(Epub 2015/06/01).
26. Luo Z, Gardiner JC, Bradley CJ. Applying propensity score meth-ods in medical research: pitfalls and prospects. Med Care Res Rev. 2010;67(5):528–54. https ://doi.org/10.1177/10775 58710 36148 6
(Epub 2010/05/06).
27. van Buuren S, Boshuizen HC, Knook DL. Multiple imputation of missing blood pressure covariates in survival analysis. Stat Med. 1999;18(6):681–94 (Epub 1999/04/16).
28. Mattei A. Estimating and using propensity score in presence of missing background data: an application to assess the impact of childbearing on wellbeing. Stat Methods Appl. 2009;18(2):257– 73. https ://doi.org/10.1007/s1026 0-007-0086-0.
29. Yancy CW, Jessup M, Bozkurt B, Butler J, Casey DE Jr, Drazner MH, et al. 2013 ACCF/AHA guideline for the management of heart failure: a report of the American College of Cardiology Foundation/American Heart Association Task Force on Practice Guidelines. J Am Coll Cardiol. 2013;62(16):e147–239. https :// doi.org/10.1016/j.jacc.2013.05.019(Epub 2013/06/12).