HAL Id: hal-00017445
https://hal.archives-ouvertes.fr/hal-00017445
Submitted on 25 Jan 2006HAL is a multi-disciplinary open access archive for the deposit and dissemination of sci-entific research documents, whether they are pub-lished or not. The documents may come from teaching and research institutions in France or
L’archive ouverte pluridisciplinaire HAL, est destinée au dépôt et à la diffusion de documents scientifiques de niveau recherche, publiés ou non, émanant des établissements d’enseignement et de recherche français ou étrangers, des laboratoires
On the use of GPS tomography to investigate water
vapor variability during a Mistral//sea breeze event in
southeastern France
Sophie Bastin, Cédric Champollion, Olivier Bock, Phillipe Drobinski, Frédéric
Masson
To cite this version:
Sophie Bastin, Cédric Champollion, Olivier Bock, Phillipe Drobinski, Frédéric Masson. On the use of GPS tomography to investigate water vapor variability during a Mistral//sea breeze event in south-eastern France. Geophysical Research Letters, American Geophysical Union, 2005, 32, pp.L05808. �10.1029/2004GL021907�. �hal-00017445�
On the use of GPS tomography to investigate water vapor variability
during a Mistral/sea breeze event in southeastern France
Sophie Bastin*, Cédric Champollion**, Olivier Bock*, Philippe Drobinski* and Frédéric Masson** * IPSL/SA, Université Pierre et Marie Curie, Paris, France
** Laboratoire de Dynamique de la Lithosphère, Université Montpellier II, Montpellier, France
Abstract
Global Positioning System (GPS) tomography analyses of water vapor, complemented by high resolution numerical simulations are used to investigate a Mistral/sea breeze event in the region of Marseille, France, during the ESCOMPTE experiment. This is the first time GPS tomography has been used to validate the three-dimensional water vapor concentration from numerical simulation, and to analyze a small-scale meteorological event. The high spatial and temporal resolution of GPS analyses provides a unique insight into the evolution of the vertical and horizontal distribution of water vapor during the Mistral/sea-breeze transition.
1. Introduction
In Provence, southern France, the sea breeze shares its occurrence with the Mistral. The sea breeze advects moist air onshore and its inland penetration strongly depends on the large scale flow (Arritt, 1993). The Mistral refers to a severe northerly gap flow that develops along the Rhône valley separating the French Alps from the Massif Central. The Mistral brings cold and dry continental air over sea. In general, the Mistral is strong enough to maintain the sea breeze front offshore but during the ESCOMPTE campaign (Cros et al., 2004), between 21 and 23 June 2001, the weak intensity of the Mistral allowed the sea breeze to break through during daytime. The complex interaction between the sea breeze and this weak summer Mistral case, described in detail in Bastin et al. (2004), leads to a rapid transition between the Mistral and the sea breeze along the coastline. This complexity affects significantly the dynamics near the shore and the four-dimensional (4D) water vapor variability in the region.
In the present paper, we use GPS tomography and a high resolution numerical simulation to investigate the 22 June 2001 Mistral/sea breeze event. To our knowledge, this is the first time the technique has been used to validate simulated water vapor field and to understand a small-scale meteorological event. We show that GPS tomography helps to capture the time evolution of the vertical and horizontal distribution of water vapor in the lower troposphere, and permits the accurate location of the transition between the Mistral and the sea breeze in space and time.
2. The instrumental set-up and model
During summer 2001, meteorological measurements were taken in southern France (see Fig. 1) in the framework of the ESCOMPTE experiment. In the present study, we use only measurements from meteorological surface stations and a GPS network (Bock et al., 2004). GPS network consisted of 17 GPS receivers with a mean distance between them of about 5 km (see the box in Fig. 1a). Such GPS networks have already been used to investigate the horizontal and temporal variations in precipitable water as a storm passed over the network (Foster et al., 2003). Here, the network aimed at providing data for the validation of a tomographic analysis model developed at Laboratoire de Dynamique de la Lithosphère. Tropospheric tomography is a practical approach to describe the four-dimensional (4D) structure of water vapour in the atmosphere (Flores et al., 2000). The main advantage of a GPS tomographic network over other water vapor profiling systems is its all weather capability, providing thus a continuous monitoring of the atmosphere. Details about the technique and validation of retrievals from ESCOMPTE can be found in Champollion et al. (2004). For the present study, tomographic fields are retrieved with a 30 min interval, a horizontal grid mesh of 0.05° and a vertical resolution ranging from 500 m near the ground to 1000 m at 10 km altitude.
The numerical simulation is conducted with the non-hydrostatic Méso-NH model (Lafore et al., 1998). Two interactively nested model domains are used, the horizontal mesh size being 9 km and 3 km, respectively. The coarse domain covers an area of about 500 km × 500 km. The fine domain covers the Rhône valley delta (Fig. 1). The vertical grid is made of 50 levels with a mesh stretched between 60 and 600 m. The initial and coupling fields were generated by first interpolating the ECMWF (European Centre for Medium Range Weather Forecast)
analyses available every 6 hours. The initialization date is 21 June 2001 at 06 UTC and the simulation ends on 23 June 2001 at 00 UTC. A complete set of physics parameterization is used. A more detailed description of the simulation can be found in Bastin et al. (2004).
3. The 22 June 2001 sea breeze/Mistral event
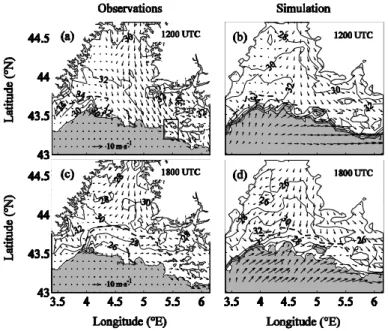
To investigate the evolution of the sea breeze circulation and the Mistral flow on 22 June 2001, the simulated and measured surface temperature and wind fields are displayed in Fig. 1 at 12 and 18 UTC. The surface wind and temperature fields clearly show the sea breeze onset. At 12 UTC, both the data and the simulation show a surface temperature gradient near the coastline on the western side of the Rhône valley (about 4°E). The sea breeze penetrates inland over a small horizontal range and it collides with the Mistral that descends the slope of the Massif Central in its southern part. In the center of the domain, the Mistral is bounded by the western Alps flank to the east and by the Massif Central wake to the west at about 4.5°E. In the region where the Mistral blows, the sea breeze can not penetrate inland. Between 14 and 18 UTC, the sea breeze front (corresponding to a wind convergence) progresses inland in the center of the Rhône valley (about 4.5°E). The front line has "moved" eastwards and at 18 UTC, the sea breeze is no longer visible in the western part of the domain while it has reached Marseille in the east. Here, it takes a westerly direction because of the coastline shape (Bastin and Drobinski, 2004) and the interaction with the Mistral. Figure 1 shows that the surface wind and temperature fields are accurately simulated with Méso-NH.
4. Water vapor variability over Marseille
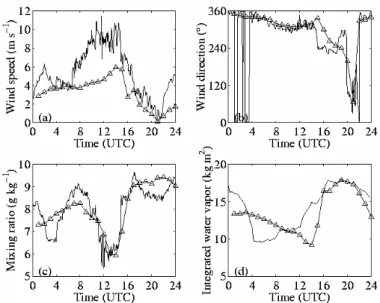
We here focus on the area where GPS data were taken (see the box in Fig. 1a). Figure 2 shows the time series of surface wind speed and direction, mixing ratio and integrated water vapor (IWV) from in-situ and GPS measurements (solid line) and simulation (triangles) at Vallon d'Ol, in the north of Marseille (see Fig. 4). Before 15 UTC, the Mistral blows at about 8 m s-1 (Fig 2a). The mixing ratio decreases from 8 to 6 g kg-1 in the morning (Fig 2c), partly due to the diurnal cycle of the surface energy budget, partly due to the Mistral which advects dry continental air. At 15 UTC, the Mistral/sea breeze transition is associated with a sharp change of wind direction (Fig. 2b) from northwesterly to southwesterly, a decrease of temperature of -6°C (not shown) and an increase of mixing ratio of 3 g kg-1. The cold and
moist maritime air is advected inland by the sea breeze. The wind speed decreases down to a typical value for a sea breeze (5 m s-1). One noticeable point is that the GPS IWV and the surface mixing ratio do not show a similar evolution during the day, evidence of the different nature of the near surface and upper level dynamics. Méso-NH reproduces accurately the time evolution of the wind direction and the mixing ratio (and temperature, not shown). However, the sharp variations of the mixing ratio occurring at night are not captured by Méso-NH. The comparison between the simulated and measured IWV shows a very good agreement during the sea-breeze period (after 16 UTC), but reveals larger discrepancies before (up to 2 kg m-2 difference) (Fig. 2d). Two major differences are noticeable: (i) the simulated IWV continuously decreases between 03 and 15 UTC; (ii) the sea breeze induced IWV increase occurs at 12 UTC in the GPS retrieval and at 15 UTC in the simulation. The differences between Méso-NH and the GPS are discussed below.
Figure 3 shows vertical profiles of water vapor density versus time from GPS tomography and from Méso-NH simulation at Vallon d’Ol. The simulated wind (Fig. 3b) shows that the Mistral blows from the northwest until about 15 UTC. During that period, both GPS tomography and the simulation show a moist 800-m deep layer (about 8-9 g m-3 with GPS tomography and about 7-8 g m-3 with Méso-NH) below a drier layer (5-6 g m-3) which extends to about 2 km above ground level (AGL) at 00 UTC. With GPS tomography, both the moist and the drier layers tighten between 00 and 05 UTC which is consistent with the decrease of the integrated water vapor (Fig. 2d). Between 05 and 12 UTC, the depth and the water vapor density of these two layers are nearly constant. The depth of the two layers increases at 12 UTC. The lowest layer deepens again around 15 UTC. The increase of the water vapor density near the surface observed with surface observations can not be seen here due to the vertical resolution of GPS tomography. The results of Méso-NH display variations of the depth and water vapor density that are different from GPS tomography. In the morning, the variation with time of the drier layer depth is much smoother. Between 12 and 15 UTC, Méso-NH shows a decrease of the water vapor density in the lowest layer by about 1.5 g m-3 (Fig. 3b), which is consistent with the surface measurements and simulation shown in Fig. 2c, but is not seen in the integrated and vertically-resolved GPS water vapor density (Fig. 2d and 3a). During this period the layers start to deepen in the GPS measurements while the drier layer continues to thin in the model results. At 15 UTC, the low-level wind veers from the
northwest to the west/southwest indicating the sea breeze onset over Vallon d’Ol. Both GPS tomography and the simulation show a deepening and moistening of the lower levels of the troposphere. As before 15 UTC, two moist layers are visible that are easier to discriminate with GPS tomography than with the simulation. The very moist layer (about 8-9 g m-3 with GPS tomography and about 9-10 g m-3 with Méso-NH) is about 1200-m deep. Above, a drier layer (about 5-7 g m-3 with GPS tomography and about 8-9 g m-3 with Méso-NH) extends to about 2 km AGL between 15 and 24 UTC. The comparison between the water vapor field and the vertical profiles of wind speed and direction illustrates the difficulty of defining the sea breeze depth. Indeed, between 15 and 22 UTC, the low-level wind blows from the west/southwest up to about 700 m AGL. Above 700 m AGL, the wind veers to the northwest marking the presence of the Mistral. However, between 700 m and 2000 m AGL, both GPS tomography and Méso-NH show enhanced moisture marking the advection of marine air mass by the sea breeze. As suggested by Bastin (2004), the sea breeze and the Mistral are not separated by a rigid lid preventing any exchanges and mixing. Most probably, a smooth transition occurs between the sea breeze and the Mistral flow aloft, which is hardly visible on the wind direction but is much clearer with the water vapor field, especially from GPS. Bastin and Drobinski (2004) showed numerically that at the sea breeze head, mixing occurs caused by enhanced turbulence due to strong horizontal gradients of wind speed and direction and air density. At the front, air masses are lofted upward and mass can be advected from the sea breeze into the lower free troposphere. GPS tomography confirms experimentally the results of Bastin and Drobinski (2004).
Figure 4 shows the evolution of the horizontal distribution of water vapor at 750 m AGL on 22 June 2001, between 12 and 18 UTC. At 12 UTC (Fig. 4a), the Mistral blows and the horizontal distribution of water vapor is relatively homogenous (the variability is < 2 g m-3) and the humidity content is low (< 6 g m-3). At 14 UTC (Fig. 4b), a weak east-west gradient in water vapor appears, which marks the sea breeze onset as seen at Vallon d’Ol (Figs. 2c, 2d and 3a). At this time, the horizontal variability is still small (2 g m-3). Note that the small-scale patterns in Fig. 4 are most likely due to noise in the GPS tomographic retrievals, and will not be interpreted here. At 16 UTC (Fig. 4c), the east-west gradient is more pronounced (3-4 g m-3 over the domain) and, on the average, the air is moister (> 7 g m-3) as it is advected inland by the sea breeze. At 18 UTC (Fig. 4d), the east-west gradient is still well marked and
the moist air has penetrated further inland. However, this moist air remains confined to the south of 43.4°N latitude due to higher topography in the northern suburbs (reaching 600 m ASL), which prevents large inland sea breeze penetration (Bastin et al., 2004).
5. Perspectives
During the ESCOMPTE experiment, GPS tomography has provided a unique data set for the description of the 4D water vapor variability at small scale which was relevant for the analysis of a Mistral/sea breeze event in the region of Marseille, France. This data set provided a validation for the water vapor field simulated with the Méso-NH model. The combination of GPS observations and Méso-NH simulations helped in understanding the interaction between the Mistral, the sea breeze and the topography. The GPS tomographic network was used both as a profiling instrument (through vertical resolution) and as imaging instrument (through 2D horizontal resolution). Such observations are particularly valuable for the study of the diurnal cycle of water vapor in connection with the varying types of atmospheric flows (sea breeze, Mistral and combination of both). As future work, the GPS tomography will be evaluated on larger and sparser GPS networks, such as permanent regional networks or networks deployed in field campaigns such as IHOP (Weckwerth et al., 2004). The technique would be particularly usefull for the study of atmospheric processes if vertical profiles and horizontal maps of water vapor at various elevations above ground could be retrieved at a larger scale. Additionally, the demonstration of the feasability of GPS tomography also serves as a proxy for the assimilation of slant GPS delays (or slant water vapor contents) in atmospheric models (Falvey and Beavan, 2002).
Acknowledgements. We are thankful to R. Benamara and A. Walpersdorf for contributing to the analysis of the simulation and the GPS data, respectively; B. Cros and P. Durand for the coordination of the ESCOMPTE experiment; E. Doerflinger for the coordination of the GPS experiment; the funding agencies (see the list in Cros et al., 2004).
References
Arritt, R.W., 1993: Effects of the large scale flow on characteristics features of the sea breeze.
J. Appl. Meteor., 32, 116-125.
Bastin, S., 2004: Circulations thermiques en terrain complexe: application à la campagne
ESCOMPTE. PhD thesis. Université Pierre et Marie Curie, Paris, 162 pp.
Bastin, S. and P. Drobinski, 2004: Sea breeze induced mass transport over complex terrain in southeastern France. Quart. J. Roy. Meteorol. Soc., submitted.
Bastin, S., P. Drobinski, V. Guénard, J.L. Caccia, B. Campistron, A.M. Dabas, P. Delville, O. Reitebuch and C. Werner, 2004: On the interaction between the sea breeze and a summer Mistral event at the exit of the Rhône valley. Mon. Wea. Rev., submitted.
Bock, O., E. Doerflinger, F. Masson, A. Walpersdorf, J. Van-Baelen, J. Tarniewicz, M. Troller, A. Somieski, A. Geiger, B. Bürki, 2004: GPS water vapor tomography project: Description and first results of the ESCOMPTE field experiment. Phys. Chem. Earth, 29, 149-157
Champollion, C., F. Masson, M.N. Bouin, A. Walpersdorf, E. Doerflinger, O. Bock and J. Van Baelen, 2004: GPS Water vapour tomography: Preliminary results from the ESCOMPTE field experiment. Atmos. Res., in press.
Cros, B., and co-authors, 2004: The ESCOMPTE program. An overview. Atmos. Res., 69, 241-279
Falvey, M., Beavan, J., 2002: The impact of GPS precipitable water assimilation on mesoscale model retrievals of orographic rainfall during SALPEX’96. Mon. Wea. Rev., 130, 2874-2888.
Flores, A., Ruffini, G., and Rius, A., 4D Tropospheric Tomography using GPS Wet Slant Delays, Ann. Geophys., 18, 223-234, 2000.
Foster, J., Bavis, M., Chen, Y.-L., Businger, S., Zhang, Y., 2003: The Ka ‘u storm (November 2000): Imaging precipitable water using GPS. J. Geophys. Res., 108, 4585-4599.
Lafore, J.P., and co-authors, 1998: The Méso-NH atmospheric simulation system. Part I: Adiabatic formulation and control simulation. Ann. Geophys., 16, 90-109.
Weckwerth, T. M., Parsons, D. B., Koch, S. E., Moore, J. A., LeMone, M. A., Demoz, B. B., Flamant, C., Geerts, B., Wang, J. et Feltz, W. F., 2004: An overview of the International H2O Project
Figure Captions
Figure 1. Surface wind and temperature fields from meteorological surface stations (left) and Méso-NH simulations (right) on 22 June 2001 at 12 UTC (upper row) and 18 UTC (lower row). The arrows indicate the wind direction and their scale indicates the intensity. A scale arrow corresponding to the wind vectors of panel (a) and (b) [resp. (c) and (d)] is indicated on panel a [resp. (c)]. The isolines indicate the temperature, with a contour interval of 2°C. The sea breeze front location is indicated by a thick dashed line. The shaded area indicates the Mediterranean Sea. The data are plotted only where surface topography is below 500 m above mean sea level. In panel (a), the small box indicates the location of the GPS network, extending over the Marseille urban area.
Figure 2. Time series of the 10-m wind speed (a) and direction (b), 2-m water vapor mixing ratio (c) from in-situ sensors and integrated water vapor (IWV) from GPS on 22 June 2001 at Vallon d’Ol (northern suburbs of Marseille - altitude 265 m above mean sea level). The measurements are indicated with a solid line, whereas the corresponding simulated quantities (using Méso-NH) are indicated with triangles.
Figure 3. Time versus height plots of water vapor density over Vallon d’Ol as retrieved from the GPS tomography (a) and from Méso-NH simulation (b). The arrows indicate the horizontal wind vectors from the Méso-NH simulation.
Figure 4. The contour levels indicate the terrain-following (750 m AGL) horizontal distribution of water vapor density from GPS tomography on 22 June 2001 at (a) 12, (b) 14, (c) 16 and (d) 18 UTC. The black circles indicate the positions of the GPS receivers. VALL stands for Vallon d’Ol. The greyscale colormap corresponds to the number of data used. Light grey indicate a reliable result.