HAL Id: hal-01164784
https://hal-ensta-paris.archives-ouvertes.fr//hal-01164784
Submitted on 18 Jun 2015
HAL is a multi-disciplinary open access
archive for the deposit and dissemination of
sci-entific research documents, whether they are
pub-lished or not. The documents may come from
teaching and research institutions in France or
abroad, or from public or private research centers.
L’archive ouverte pluridisciplinaire HAL, est
destinée au dépôt et à la diffusion de documents
scientifiques de niveau recherche, publiés ou non,
émanant des établissements d’enseignement et de
recherche français ou étrangers, des laboratoires
publics ou privés.
High-contrast pump-probe spectroscopy with high-order
harmonics
Y Mairesse, W Boutu, P Breger, E Constant, D Descamps, N Dudovich, B
Fabre, Stefan Haessler, J Higuet, E Mével, et al.
To cite this version:
Y Mairesse, W Boutu, P Breger, E Constant, D Descamps, et al..
High-contrast pump-probe
spectroscopy with high-order harmonics.
France.
EDP Sciences, pp.107-111, 2009, UVX 2008,
�10.1051/uvx/2009017�. �hal-01164784�
2 UVX 2008
Figure 1. Experimental setup for high harmonic transient grating spectroscopy. Two crossed pump pulses create a grating of rotational excitation. A delayed probe pulse generates high harmonics in the excited medium. The emitted light is analyzed by an XUV spectrometer that images the spatial profile of each harmonic.
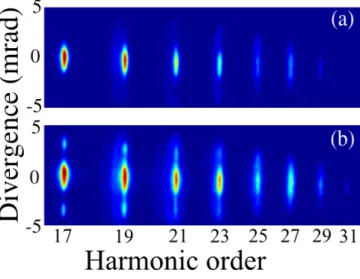
Figure 2. Spatially resolved harmonic spectrum generated in N2 at 1.5 × 10¹⁴ W/cm2, with isotropic
molecular alignment (a) and at ∆t = 4.1 ps (b).
to many pump-probe experiments. Several techniques have been developed in nonlinear optical spectroscopy. We have transposed two of them to the extremely nonlinear regime: transient grating spectroscopy [12] and polarization resolved spectroscopy [13]. As a proof of principle, we consider the case of rotational wavepackets because their dynamics is well understood. However the extension of these techniques to other excitations is straightforward.
2 Transient grating spectroscopy
Transient grating spectroscopy (TGS) is one of the most commonly used techniques to perform background free nonlinear optical spectroscopy [11]. TGS is a four-wave mixing process in which the sample is excited by two synchronized non-colinear pump pulses. The resulting beam profile consists of interference fringes with a spacing dictated by the angle between the two pumps. Thus the excitation of the sample is spatially modulated: a grating of molecular excitation is created. The probe beam is focused on the sample and is diffracted by the grating. The detected signal is the diffracted light. The geometry is chosen such that there is no light emitted in the diffraction direction if there is no grating. Thus, the detected signal is zero when there is no excitation and the measurement is background free.
The experimental setup that was used to perform high harmonic TGS is shown in Fig. 1 [12]. The geometry is similar to conventional transient grating spectroscopy [14]. Two non-colinear
N
Delay (ps)
0 2 4 6 8 10 12 14 16 18 0
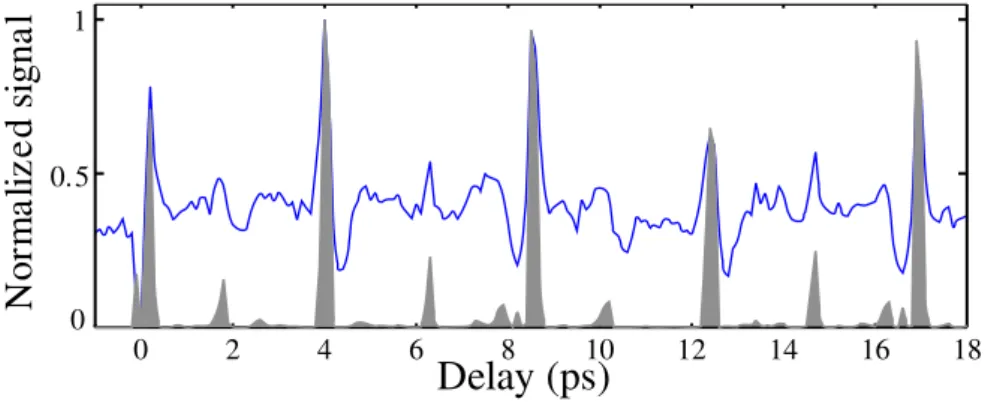
Figure 3. Evolution of the harmonic 17 total signal (line) and first order diffracted peak (gray shaded area) as a function of pump-probe delay.
pump pulses create a grating of rotational excitation in a pulsed molecular nitrogen gas jet. The fringe spacing is 13 µm. The rotational period of nitrogen molecules is 8.4 ps and the first revival of molecular alignment is thus expected to occur around 4.2 ps. The central probe pulse is delayed by ∆t and focused on the grating with a waist at focus about 100 µm. It generates high harmonics which are analyzed by an XUV grating. The grating is cylindrical, so that it images the spectrum in the horizontal dimension without focusing the beam in the vertical dimension. The spectrally resolved spatial profile is imaged onto a set of MCPs associated to a phosophor screen and a CCD camera.
Figure 2(a) shows the spectrally resolved spatial profile obtained when the pump probe delay is negative, i.e. when there is no rotational excitation of the generating molecules. The harmonics consist of a central lobe and a more divergent part. They correspond respectively to short and long electron trajectories in the generation process. Fig. 2(b) shows the picture obtained when the pump-probe delay is ∆t = 4.1 ps. First order diffraction peaks appear on the sides of the lowest harmonics. The direction of these peaks is consistent with the fringe spacing of the excitation grating. The diffraction efficiency is strong for low orders (9.5% of the energy in each diffraction peak for harmonic 17) and decreases as the harmonic order increases. The evolution of the harmonic 17 signal as a function of pump probe delay is shown in Fig. 3. The total signal follows the evolution of the degree of molecular alignment [7]: it increases when molecules are aligned and decreases when they are anti-aligned. The contrast in the detection of alignment revivals (ratio between signal from aligned and randomly aligned molecules) is less than a factor 3. The grey shaded area shows the evolution of the diffracted light. The background in this signal is considerably reduced: the contrast in the detection of alignment is here more than 300:1. Such a high contast enables us to detect subtle structures in the rotational wavepacket dynamics, which could not be seen in the total signal [12].
3 Polarization resolved spectroscopy
Polarization resolved spectroscopy is another technique that is commonly used to improve the contrast of pump-probe measurements. The prinicple of this technique, transposed to high harmonic generation, is shown in Fig. 4 [13]. When high harmonics are produced by an isotropic medium, the polarization of the harmonic electric field is parallel to that of the generating laser field. The orthogonal component Eorth of the harmonic field is zero. As soon as there is an
anisotropy in the generating medium, the polarization of the harmonics will in general be different from the laser polarization [15]. This leads to the appearence of a non-zero orthogonal component of the harmonic field. Thus, by detecting Eorthrather than the total harmonic field,
the contrast of the measurement can be increased.
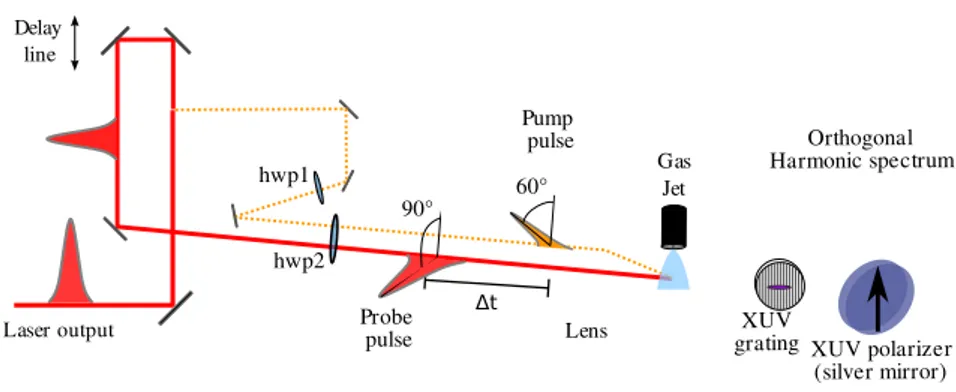
The experimental setup for polarization-resolved pump probe spectroscopy is shown in Fig. 5. The laser beam is split in two in a delay line. The polarizations of the pump and probe beams
4 UVX 2008
Figure 4. Principle of polarization resolved spectroscopy. In an isotropic medium, the harmonic po-larization is parallel to the laser field (a). In an anisotropic medium this is in general not the case and an orthogonal electric field component can be produced (b).
Δt Pump pulse
Laser output Probe pulse Lens Delay line hwp1 hwp2 Gas Jet XUV grating Orthogonal Harmonic spectrum XUV polarizer (silver mirror) 90° 60°
Figure 5. Experimental setup for polarization resolved pump probe spectroscopy. The probe beam polarization is orthogonal to the polarizer axis. The pump beam polarization is in between, so that symmetry is broken when molecules are aligned.
can be adjusted with two half waveplates. A silver miror under 45◦incidence is placed between the grating and the detector. The reflectivity of this mirror is 30 times higher for S polarized incoming radiation than for P polarization. This miror thus acts as an imperfect polarizer.
The polarization direction of the probe beam is chosen to be perpendicular to the axis of the polarizer. This configuration minimizes the detected signal when the medium is isotropic. The pump beam polarization is set to 60◦ from the axis of the polarizer. This configuration is similar to the one presented in Fig. 4(b). We used a 50/50 mixture of argon and molecular nitrogen as a generating medium. Both gases have similar ionization potentials but the signal produced in pure argon is about 3 times stronger than the one from pure nitrogen. The signal from the mixture is thus dominated by contributions from argon.
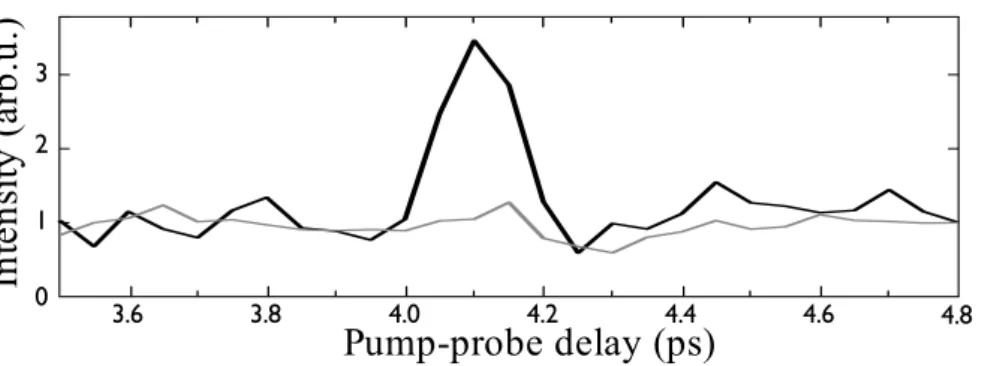
The pump probe scan obtained with a standard configuration (i.e. no polarization resolution) is shown in Fig. 6 (gray line). It does not present significant modulations around the half-revival perdiod of nitrogen. The signal obtained with polarization resolved spectroscopy is shown in black. A clear maximum is observed when molecules are aligned: polarization resolved spectroscopy enables us to extract an alignment signal from a strong background. The contrast of the maximum is 3.5 and is only limited by the extinction ratio of the polarizer. Using several silver mirors would enable us to achieve a better contrast.
4 Conclusion
We have implemented two techniques to achieve high contrast pump probe spectroscopy with high harmonics: transient grating spectroscopy and polarization resolved spectroscopy. We have demonstrated a contrast enhancement by two orders of magnitude with TGS. Polarization
Pump-probe delay (ps)
3.6 3.8 4.0 4.2 4.4 4.6 4.8 0
Figure 6. Pump-probe scan in a 50/50 mixture of nitrogen and argon. The black line was obtained with polarization resolved pump probe spectroscopy while the grey line was obtained with conventional detection.
resolved spectroscopy has enabled us to extract the dynamics of rotational wavepackets in nitrogen from a strong continuous background generated by argon atoms.
In addition to this contrast enhancement, each technique presents additional advantages. The diffracted signal in TGS results from amplitude and phase modulations of the harmonic emission in the generating medium. The diffraction pattern can thus be used to extract the phase of the harmonic as a function of molecular alignment. The experimental setup used for polarization resolved spectroscopy can be used to measure the polarization state (direction, ellipticity) of the harmonics [15]. These parameters give precious information on the generating process and medium structure. While we have focused on the case of rotational wavepackets, it is clear that the two techniques implemented here will be usefull to study other dynamics with high order harmonic generation.
References
1. J. Itatani, J. Levesque, D. Zeidler, H. Niikura, H. P´epin, J. C. Kieffer, P. B. Corkum, and D. M. Villeneuve, Nature 432, 867 (2004).
2. J.P. Marangos, S. Baker, N. Kajumba, J.S. Robinson, J.W.G Tisch, and R. Torres, Phys. Chem. Chem. Phys. 10 35 (2008)
3. P. B. Corkum, Phys. Rev. Lett. 71, 1994 (1993).
4. K.J. Schafer, B. Yang, L.F. DiMauro and K.C. Kulander, Phys. Rev. Lett. 70, 1599 (1993). 5. F. Rosca-Pruna and M. J. J. Vrakking, Phys. Rev. Lett. 87, 153902 (2001).
6. H. Stapelfeldt and T. Seideman, Rev. Mod. Phys. 75, 543 (2003).
7. P. W. Dooley, I. V. Litvinyuk, K. F. Lee, D. M. Rayner, M. Spanner, D. M. Villeneuve, and P. B. Corkum, Phys. Rev. A 68, 023406 (2003).
8. T. Kanai, S. Minemoto and H. Sakai, Nature 435, 470 (2005). 9. J. Itatani et al., Phys. Rev. Lett 94, 123902 (2005).
10. C. Vozzi et al., Phys. Rev. Lett. 95, 153902 (2005).
11. S. Mukamel, Principles of Nonlinear Optical Spectroscopy, Oxford University Press, New York, 1995
12. Y. Mairesse , D. Zeidler, N. Dudovich, M. Spanner, J. Levesque, D.M. Villeneuve and P.B. Corkum, Phys. Rev. Lett. 100 143903 (2008)
13. Y. Mairesse, S. Haessler, B. Fabre, J. Higuet, W. Boutu, P. Breger, E. Constant, D. Descamps, E. M´evel, S. Petit and P. Sali`eres, New J. Phys. 10 025028 (2008).
14. A. Rouz´ee, V. Renard, S. Gu´erin, O. Faucher and B. Lavorel, Phys. Rev. A 75 013419 (2007). 15. J. Levesque, Y. Mairesse, N. Dudovich, H. P´epin, J.-C. Kieffer, P. B. Corkum, and D. M. Villeneuve,
Phys. Rev. Lett 99, 243001 (2007).