HAL Id: cea-01686788
https://hal-cea.archives-ouvertes.fr/cea-01686788
Submitted on 18 Jan 2018HAL is a multi-disciplinary open access archive for the deposit and dissemination of sci-entific research documents, whether they are pub-lished or not. The documents may come from teaching and research institutions in France or abroad, or from public or private research centers.
L’archive ouverte pluridisciplinaire HAL, est destinée au dépôt et à la diffusion de documents scientifiques de niveau recherche, publiés ou non, émanant des établissements d’enseignement et de recherche français ou étrangers, des laboratoires publics ou privés.
High-resolution Magic-angle Spinning (HR-MAS) NMR
Spectroscopy
Alan Wong, Covadonga Lucas-Torres
To cite this version:
Alan Wong, Covadonga Lucas-Torres. High-resolution Magic-angle Spinning (HR-MAS) NMR Spec-troscopy. Hector C. Keun. NMR-based Metabolomics, Chapter 5, The Royal Society of Chemistry, pp.133-150, 2018, 978-1-84973-643-5. �10.1039/9781782627937-00133�. �cea-01686788�
133 New Developments in NMR No. 14 NMR-based Metabolomics Edited by Hector C. Keun © The Royal Society of Chemistry 2018 Published by the Royal Society of Chemistry, www.rsc.org
5.1 Introduction
Today, numerous analytical tools are available for metabolomics research;1 among them, high-resolution 1H liquid-state NMR spectroscopy offers a quantitative, non-destructive high-throughput method for rapid analysis of biospecimens. Therefore, 1H liquid-state NMR is widely used and is consid-ered a convenient screening tool to discriminate between specimens of dif-ferent biological origin.2,3 One reason for this success is that in liquid-state NMR the samples are homogeneous (e.g., biofluids), permitting the
acqui-sition of sharp signals (up to 0.001 ppm) for rich metabolic screening. Con-versely, semisolid samples like tissue biopsies, whole cells and organisms are heterogeneous in nature and give broad NMR lines that hamper any precise and detailed metabolic investigation. This broadening is caused by the variation of the magnetic susceptibility in intercellular and intracellular boundaries.4,5 However, in the early-mid 1990s an NMR technique emerged called high-resolution magic-angle spinning (HR-MAS) that extended the
CHApTeR 5
High-resolution Magic-angle
Spinning (HR-MAS) NMR
Spectroscopy
AlAN WONg* AND COVADONgA lUCAS-TORReS
NIMBe, CeA, CNRS, Université paris-Saclay, CeA Saclay, 91191 gif-sur-Yvette, France
NMR applications to heterogeneous samples. essentially, HR-MAS combines two highly successful NMR techniques: the ‘high-resolution’ for liquids and the ‘line-narrowing’ for solids. Basically, HR-MAS averages the magnetic sus-ceptibility gradient and the residual dipolar coupling inherent in heteroge-neous samples. This results in NMR spectra of semisolids with a spectral resolution on a par with liquid-state NMR spectroscopy.
The significant technological advancements in the design of HR-MAS probes have led to several commercial probes: HR-MAS by Bruker BioSpin Corporation, FgMAS by JeOl Inc., HR-MAS MAg by Doty Scientific Inc., and Nano probe by Agilent Technologies. These developments have enabled a wide spectrum of applications, ranging from materials to medical science. In particular, HR-MAS in clinical research is now entering an exciting period, where research scientists and medical doctors are working together to imple-ment a clinical HR-MAS NMR analytical platform for real-time metabolic screening of surgical human biopsies.6,7
There are numerous journal reviews, books and chapters dedicated to HR-MAS NMR spectroscopy; to list just a few, applications to cancer research,8–12 food science,13,14 cellular science,15 material science16 and to science in general17–19 are well documented. Clearly, this wide spectrum of applications highlights the great utility of HR-MAS. literature on the funda-mental principles and practical aspects of HR-MAS,20,21 and the drawbacks of HR-MAS in metabolomics analysis, is also available.22 This chapter, meant for general readers, outlines the basic principles of HR-MAS and highlights a few noteworthy MAS-based technologies and methodologies that could further advance NMR technology for metabolomics research.
5.2 HR-MAS Basic Concepts
This section briefly describes the sources of line broadening in heterogeneous samples and the line-narrowing techniques used to obtain high-quality NMR spectra for metabolomics studies. Readers can find a more comprehensive description in various books23,24 and journal articles.25,26
5.2.1 Magnetic Susceptibility Broadening
In NMR, the effective magnetic field B induced in a sample can be expressed
as:
B = µ0H0 + M, (5.1)
where H0 is the external magnetic field, µ0 is the permeability of free space (4π × 10−7 H A−1), and M is the sample magnetization (or magnetic dipole moment) per unit volume. If the magnetic susceptibility of the sample is iso-tropic, then M can be defined as χB0, where χ is a scalar component of the
susceptibility, and B0 = µ0H0 is the magnetic field induction. Thus, B can be defined as:
B = µ0H0(1 + χ) = µH0, (5.2)
where µ = µ0(1 + χ) is the permeability of the sample. From the above equa-tions, the effective field B experienced in a sample depends directly on the
susceptibility factor χ, which arises from the local dipole moment M. For
example, if a sample is immerged in a homogeneous liquid, the susceptibility of the liquid medium induces an additional homogeneous magnetic field in the sample that results in a shift of the sample NMR signals. Consider the simple case of lipids in muscle tissues, which consist of two distinct lipid compartments: one intra-mycocellular and one extra-myocellular. As a result, the related spectrum contains two distinct 1H NMR signals with a chemical shift difference of about 0.2 ppm, which is attributed to the different sus-ceptibility between the two lipid compartments.27 However, metabolites in tissues are usually immerged in complex heterogeneous media with multiple different cellular boundaries, each of which has a different susceptibility. As a result, a magnetic field gradient ΔB is induced on the metabolites, resulting
in a chemical shift gradient and thus in broad 1H NMR signals.
The magnitude of the susceptibility broadening can be estimated by deter-mining the induced dipolar magnetic field. Consider a dipolar magnetic moment m in a spherical volume (Figure 5.1a) with radius a and permeability µi = 1 + χi; and a point p located at distance R from the magnetic moment m and situated in a medium with permeability µe = 1 + χe.
Figure 5.1 (a) The magnetic dipolar field Bz at point p of a sample induced by a
magnetic moment m under the external magnetic field B0. δ is the angle between B0 and the dipolar vector DR, which depends on a distance R from m. (b) The MAS effect on the dipolar interaction, where δ becomes
a time-dependent component with magic-angle θm and β angle between the rotation axis and DR [eqn (5.4)].
At the point p, the magnetic moment m generates a dipolar magnetic field Bz. The magnitude of the induced Bz field essentially causes the shift of the
signal—in other words line broadening—and can be estimated with the fol-lowing equation:
3 2 0 3 3cos 1 3 z a B B R (5.3)where Δχ is the difference in susceptibility between two magnetic volumes
χe − χi, and δ is the angle between B0 and the dipolar vector DR. As can be seen in eqn (5.3), Bz varies with the susceptibility difference (Δχ), and the position
(distance 1/R3 and angle δ). let us consider a very simple heterogeneous sam-ple—water medium containing an air bubble. The susceptibility of water is 9 × 10⁻⁶, and near zero for the air bubble. In this case, the 1H signal of the water molecules at the boundaries of the air bubble (R = a, Figure 5.1a) is shifted by
at most 6 ppm depending on δ. Since this shift decreases with the increasing distance R (i.e., weaker dipolar field), the water molecules around the air
bub-ble give a broad signal caused by the different dipolar fields between the indi-vidual water molecule and the air bubble. The same effect, but with different magnitude, is found in the case of metabolites located near air bubbles or cellular structures such as cell membranes.
The 1H NMR spectra of brain tissues have relatively narrow signals com-pared to other tissues because the brain metabolites are characterized by fast molecular tumbling, which partially averages the susceptibility effect described above. This is why most static NMR studies – including in vivo
MRS – on semisolid biosamples have been carried out on brain tissues.28,29 To extend NMR-based metabolomics studies to other heterogeneous speci-mens like biotissues, whole cells and organisms, one has to apply a line- narrowing NMR technique called MAS. This is a commonly used technique in solid-state NMR spectroscopy.
5.2.2 Magic-angle Spinning
As described in the previous section, the susceptibility broadening is caused by the dipolar magnetic field Bz, which varies with the susceptibility Δχ, the
distance R, and angle δ between the external field B0 and the dipolar vector DR [eqn (5.3) and Figure 5.1a]. The angle contribution can be eliminated by spinning the sample at an angle 1
m cos 1 54.74
3
relative to B0. This
sample-spinning technique was introduced by Andrew30 and lowe31 in 1959, and is known as MAS.
Since the sample rotates in a MAS experiment, δ becomes a time-depen-dent component and is given by:
cos δ(t) = cos β cos θm + sin β sin θmcos(ϕ(t)) (5.4)
where β is the angle between the rotation axis and the dipolar vector (Figure 5.1b). Upon inserting the time-dependent δ(t) term into eqn (5.3), the
effec-tive dipole field inside the spinning sample is:
2 2 m 0 3 m r 2 2 m r 3cos 1 3cos 1 3sin2 sin2 cos( ) 23sin sin cos 2
z m B t R t (5.5)
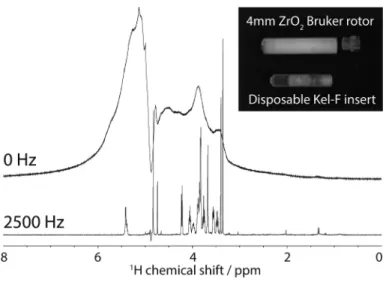
where ωr is the sample-spinning frequency and ϕ is the time-dependent azimuth angle. When θm = 54.74° (i.e., during a MAS experiment), the first term in eqn (5.5) becomes zero, leaving the second and third terms. These terms generate signals called spinning sidebands, which occur at multiple of the spinning frequency ωr and the amplitude of which depends on the line-width of the signal in non-spinning condition i.e., ωr = 0. Subsequently, MAS eliminates the susceptibility broadening and results in an isotropic signal at a chemical shift that depends on the nuclear spin chemical shift interaction. To illustrate the substantial effect that MAS can have on the resolution of a spectrum, Figure 5.2 shows the 1H NMR spectra of a tissue sample acquired with and without MAS.
Figure 5.2 1H HR-MAS spectra of 10 mg rat brain tissue. The NMR spectra were recorded with a t2-cpmg experiment at 500 MHz at 285 K under dif-ferent MAS conditions: (top) under a non-sample-spinning condi-tion at 0 Hz, and (bottom) at a sample-spinning of 2500 Hz. The tissue was packed inside a standard Bruker disposable Kel-F insert, which is used to enhance the sampling throughput and spectral repeatability.
5.3 Hardware and Practical Considerations
In HR-MAS, the sample is packed inside a spinning rotor, which in turn is placed inside a detection coil. The susceptibility variations between rotor and sample, and within the sample, are not critical since they all average to zero under MAS condition, providing the susceptibilities are isotropic. The residual line broadening in HR-MAS NMR spectra is thus caused by sources that are independent from MAS. One possible source is the magnetic field induced by the stationary (non-spinning) components of the NMR probe that are in close proximity to the sample. This field can perturb the dipolar field in the sample—even if the sample is under MAS conditions—and compro-mise the spectral quality.
Another possible source of broadening is the presence of local tempera-ture gradients inside the sample, which can originate from spinning, high radiofrequency or electric field. Since in certain cases chemical shifts are temperature-dependent, a temperature gradient in the sample can severely broaden the NMR lines. To minimize the contribution from the NMR probe and temperature gradients, carefully designed HR-MAS probes should be implemented.
5.3.1 Magnetic Susceptibility Components
When designing a HR-MAS probe, one important criterion is to minimize the magnetic dipolar field perturbations Bz in close proximity to the sample.
These field perturbations can originate from non-spinning probe compo-nents, such as the ceramic MAS stator, the chip capacitors, the wire of the detection coil, the air tubes, the optical devices and the adhesives. Hence, these stationary components must be placed apart from the sample or made of materials with a magnetic susceptibility similar to that of the sample (i.e.,
water in most cases). For instance, to eliminate the dipolar field perturbation from the detection coil, which is the closest component to the sample, cer-tain probes use coils made with zero-susceptibility wires, like CuNi or CuAl alloy wires.33
Strategically positioning the stationary chip capacitors with respect to the sample can also reduce the field perturbations, for instance in the case of magic-angle placement of capacitors.32 In a field simulation, it indicates that the dipolar field Bz vanishes at 54.74° with respect to a magnetic moment m.
Thus, by symmetrically placing the chip capacitors at near magic-angle with respect to the sample, the field perturbations induced by the capacitors are reduced and the line resolution improved.32
5.3.2
B
0Field Correction
even when a well-designed HR-MAS probe (with minimal local field pertur-bation to the sample) is inserted inside a NMR magnet, both the sample and probe perturb the B0 field, leading to a non-homogeneous B0 field across the
sample, and broadening the NMR signals. To minimize this effect, the B0 across the sample needs to be corrected—a routine practice in NMR spec-troscopy also known as B0 field shimming. This is done by a set of radio-frequency shims, a series of radioradio-frequency coils that provide different, but weak, magnetic field profiles. generally, there are two types of shim coils, the zonal shims (Bz1, Bz2, Bz3 …), which are cylindrically symmetric around the
sample axis for reducing on-axis B0 variations, and the tesseral shims (Bx, By,
Bzx, Bzy, Bxy, Bx2−y2 …), which are used for off-axis B0 variations.
The shimming of a HR-MAS probe is different than that with a liquid-state NMR probe because of the different orientation of the sample in the two probes. With HR-MAS, the field corrections are applied along the magic-angle axis;33,34 moreover, under MAS the inhomogeneity of the B
0 field in the trans-verse plan is basically averaged to zero, hence no corrections are necessary for the tesseral shims along the magic-angle axis (BxMAS, ByMAS, BzxMAS, BzyMAS,
Bx2−y2MAS, BxyMAS…). Conversely, the inhomogeneity along the magic-angle axis
can be corrected by using the zonal shims along the magic angle (BZ1MAS,
BZ2MAS, BZ3MAS). This can be done with the conventional shims by adjusting in a
linear combination. For example, if the MAS stator lies along the yz plane,
the magic-angle zonal shims are: 1MAS 1 2 , 3 z 3 y Z B B B (5.6) 2MAS 2 2 2 2 ,zy Z x y B B B (5.7) 3MAS 2 3 1 2 5 2 2 5 . 3 3 6 3 3 6 y Z z z y z x y B B B B B (5.8)
Note that there are no x-directional shims. The exact weighting of these
linear combinations is not important under MAS. Often a trial and error shimming procedure is efficient. On the other hand, shimming a MAS sam-ple under non-spinning conditions can be a challenge. In this case, the B0 inhomogeneity in the transverse plan is not averaged to zero and the magic- angle tesseral shims become significant and must be applied together with the magic-angle zonal shims. Their linear combinations are complex and can be found in ref. 33.
Since different solvents (and samples) can have different susceptibilities (e.g., 9 × 10⁻⁶ for H
2O, 8.75 × 10⁻⁶ for D2O, and 7.25 × 10⁻⁶ for ethanol), in liquid-state NMR the optimum shim setup can be different. Conversely, an ideal HR-MAS experiment, once optimized the shim setup is efficient for different samples, given that the samples are of the same type and the rotor is at the same position for all experiments. This is because the MAS spinning elimi-nates the broadening effect generated by the susceptibility gradient inside the spinning sample, whether it is cellular structures, solvents, or even air bubbles or rotors, as long as their susceptibility is isotropic.
5.3.3
B
0Field Locking
Most HR-MAS probes include a 2H field-lock system for stabilizing the B 0 in the region around the sample during the data acquisition. locking the B0 field is very critical, especially for long acquisitions like multidimensional experiments, because even a small B0 field drift (parts per billion) can affect the spectral resolution.
The 2H field-lock system monitors continuously the 2H signal using a ded-icated 2H-detection channel. Whenever there is a B
0 field drift, the 2H sig-nal shifts and the 2H field-lock system automatically adjusts the total field strength to keep the 2H frequency constant. To ensure that the B
0 field adjust-ment is within the sample region, the source of the 2H signal is either mixed within the sample or in close proximity.
5.3.4 Sample Temperature
When a sample is under fast spinning, the air bearing generates a frictional heat on the rotor surface. The frictional heat induces a local temperature gradient inside the rotor. If the 1H shift of the sample is temperature- dependent, the temperature gradient can broaden the NMR signal. For water, the chemical shift temperature dependence is 11.9 ppb °C−1,35 or 6 Hz per degree centigrade at 500 MHz. Therefore, one should avoid using the 2H-lock for monitoring the D2O signal level as an indicator of the shimming quality since the automatic shim adjustments can be compromised by the tempera-ture effect and lead to non-optimal shim setup for the metabolite signals. A good practice is to shim directly on a strong metabolite signal, such as the doublets of alanine, glucose or lactate, under a stable sample temperature environment.
It should be noted that besides the friction-induced temperature gradi-ent, radiofrequencies and electric fields can also induce temperature gra-dients in the sample; therefore, one must also be careful when using high (or lengthy) radiofrequency pulse experiments, or samples with high ionic content.
Two good practices to minimize the local temperature gradient are (i) using cold air (ideally with dry nitrogen gas) for the MAS air bearing and drive, and (ii) keeping the sample temperature constant throughout the mea-surement even at room temperature.
5.3.5 Pulse-field Gradient
Most of the pulse experiments used in HR-MAS studies of biotissues and cells are derived from liquid-state NMR experiments. This is because the resolution of HR-MAS is on a par with the liquid-state spectra in which the 1H J-coupling is readily observed. Therefore, standard J-recoupling 2D and 3D experiments, such as COSY, TOCSY and HSQC, can be readily performed under MAS. For these experiments, pulsed-field gradients (pFgs) are an
important feature because gradient pulses can significantly shorten (by up to 25%) the acquisition time. For this reason, most commercial HR-MAS probes include a ZMAS-gradient along the magic-angle axis. This ZMAS-gradient can also be used in a recently implemented ultrafast single-scan 2D experiment (<1 minute) for HR-MAS.36 Another utility of the ZMAS-gradient is that it can offer more efficient water suppression methods37 than that with the conven-tional radiofrequency pulses. Moreover, with a ZMAS-gradient it is also possi-ble to perform diffusion-related experiments, such as diffusion coefficient measurements and diffusion-edited experiments for improved metabolite identification and annotation.38
Although the ZMAS-gradient in HR-MAS offers good utilities for perform-ing HR-MAS experiments, the capacity of the gradient strength is much lower than that of a dedicated pFg system. For comparison, a conventional Bruker HR-MAS probe provides a gradient of 0.5 T m−1 (50 g cm−1) maximum, whereas 30 T m−1 (3000 g cm−1) can be reached with a pFg-dedicated system. Strong field gradients are highly desirable for the characterization of mole-cules with slow diffusion and to perform localized magnetic resonance spec-troscopy (MRS), which have found great success in in vivo research.28,29 For these reasons, Bruker has developed a commercially available pFg system— with three strong orthogonal gradients—that can accommodate a standard Bruker HR-MAS probe for extending the applications of HR-MAS to localized MRS and diffusion-based experiments.39
5.3.6 Pulse Experiments
As mentioned before, most of HR-MAS pulse experiments are adopted from liquid-state NMR—NOeSY, CpMg, TOCSY, J-resolved and diffusion. even
complex experiments like 3D HCCH-TOCSY and HCCH-COSY have been implemented for HR-MAS.40 In standard experiments such as TOCSY, COSY and NOeSY, rotor synchronization is generally not important under fast MAS conditions (faster than 2 kHz). However, a few practical aspects should be considered in the case of semisolid heterogeneous samples. For exam-ples, the short transverse relaxation T2 as compared to liquid-state must be taken into account in the pulse experiments, which can lead to residual dipolar broadening (large proteins) that cannot be averaged to zero even at high MAS frequencies. The spinning effects on the sample must also be considered.
Conversely, rotor synchronization is requisite for certain slow MAS iments (<1 kHz). For example, the spinning-sideband suppression exper-iment pASS (phase Alternated Spinning Sidebands)41 must be performed under rotor synchronization to completely suppress the spinning-sideband signals. Incidentally, because of the long rotor period (2π/ωr) used under slow MAS, the pASS experiment can also partly be considered a T2-filter (similar to a T2-edited CpMg experiment) for suppressing the resonances from large molecules that usually mask the metabolite signals and distort the baseline.
5.4 Recent (HR)-MAS Developments Towards
NMR-based Metabolomics
5.4.1
In vivo Studies
HR-MAS finds success in health and biological sciences mainly for ex vivo
systems, but only a small number of reports on in vivo studies of living
organisms. HR-MAS is known to be a non-destructive technique; clearly, with living organisms it is not always the case: can the organisms sur-vive under a spinning condition? How does the spinning affect their vital functionalities?
The first in vivo HR-MAS experiment was performed by Tzika and
cowork-ers on the fruit fly, Drosophila melanogaster.42,43 The authors investigated the metabolic profile variations of injured, aged and immune-deficient flies by 1H HR-MAS. High-quality 1H spectra were acquired at 600 MHz, on a sin-gle fly and spinning the fly at 2 kHz. The study revealed an increased level of triglycerides in the injured, immune, aged and obese flies that may be indicative of insulin resistance. Although this study has demonstrated the feasibility of HR-MAS metabolic fingerprinting of a whole organism, the obtained 1H NMR spectra correspond to the metabolic profile of the whole Drosophila. More interesting is to obtain metabolic profiles of specific
parts and organs of an organism. In this regard, very recently Sarou-Kanian
et al.44 reported a new method—1H HR-MAS Slice localized Spectroscopy and HR-MAS Chemical Shift Imaging—to obtain the spatial distribution of metabolites along the anteroposterior axis of the organism. The experi-ment was acquired on a single living Drosophila, using a 3.2 mm MAS probe
coupled with a three axes pFg system, at 750 MHz and spinning the fly at 2.6 kHz. The authors successfully obtained individual spectra for the abdo-men, thorax and head.
After the successes of Tzika and coworkers with the fruit fly,42,43 Bunescu et al.45 performed in vivo metabolic profiling of the aging freshwater cladoceran Daphnia magna, and found that the organism survival rate declines steadily
with increasing sample-spinning frequency: 84%, 75% and 37% after spin-ning 20 minutes at 0 Hz, 2 kHz and 3.6 kHz, respectively. This is ascribed to the effect of the centrifugal force on the living organisms, and should be carefully considered when planning in vivo HR-MAS experiments and
inter-preting the in vivo results. A good option is applying slow MAS experiments
to minimize the centrifugal effect.
5.4.2 Slow MAS Experiments
For heterogeneous biospecimens, sample-spinning frequencies of 2–6 kHz are generally sufficient to obtain high-resolution spectra. In fact, such MAS rates are not required for removing the susceptibility line broadening (see Section 5.2.2) but for suppressing the spinning sidebands within the metab-olite spectral region (0–10 ppm in 1H NMR). A good practice is to have the
spinning sidebands at least 5 ppm apart from the isotropic line i.e., using a
spinning frequency of 2 kHz at 400 MHz, and 3 kHz at 600 MHz. This is why, at high magnetic fields, it is generally required to spin the sample at a higher rate. However, as mentioned before, the strong centrifugal force at fast MAS rates can damage the tissue or cell morphologies, alter the metabolic pro-file,21 and eventually compromise the data interpretation. For example, cells in adipocytes were damaged after 2 hours of spinning at 3500 Hz,46 visible ruptures in Caenorhabditis elegans were observed after 4 hours at 3500 Hz,47 and distortion of human brain tumor tissues48 and cell lysis49 were observed after spinning at 4000 Hz.
The centrifugal force exerted at a given point in the sample is given by:
Fc = mωr2r (5.9)
where m is the sample mass, ωr is the spinning frequency, and r is the radial distance between the rotation axis and the point. As shown in the equation,
Fc increases with both the spinning frequency and sample diameter.
Besides the centrifugal force, sample heating is also a potential draw-back of fast MAS as the friction-induced heat reduces the spectral resolu-tion and alters the metabolic activities. Slow MAS reduces the effect of both the centrifugal force and sample heating; however, special pulse sequences are often necessary to suppress the spinning sidebands. Moreover, at slow MAS rates the overall signal intensity is distributed throughout the spin-ning sidebands, reducing the sensitivity of metabolite detection. Various works have demonstrated that applying the 2D pASS sideband suppression pulse sequence,41 it is possible to acquire MAS spectra of living bacterial cells50 and animal tissues51,52 at a spinning speed of only 40 Hz. For even lower spinning (i.e., down to 1 Hz), a more sophisticated pulse experiment
is required, the pHase cORrected Magic-Angle Turning (pHORMAT).53 The pHORMAT experiment has been demonstrated on rat liver tissues54 and proved to be superior to pASS55 at ultraslow MAS rates. Combining slow MAS experiments (pASS or pHORMAT) with the use of a small-diameter detec-tion coil—a 700 µm microcoil—Wong and coworkers56 were able to further reduce the effect of the centrifugal force [as both ωr and r contributions in eqn (5.9) are minimized].
At 1 Hz (about 6.3 rotations per second), in vivo MAS studies of live animals
become possible. Wind and coworkers successfully acquired 1H NMR spectra with modest spectral resolution of a live mouse spinning at 1.5 Hz.57 later, the same authors demonstrated the capability of in vivo localized
spectros-copy combining the localized Magic-Angle Turning (lOCMAT) pulse exper-iment with a three axes pFg system.58 These demonstrative studies opened new perspectives for in vivo NMR applications.
Recently, Caldarelli and coworkers59,60 demonstrated that high-quality 1H spectra can be acquired at spinning frequencies of a few hundred hertz without the need for complex sideband suppression pulse sequences. The idea is to reduce the sideband intensities by minimizing the susceptibility
gradient within the sample. To do this, the authors proposed a sample-pack-ing protocol that improves the sample homogeneity by, for instance, elimi-nating the air bubbles and using symmetrical sample holders (Kel-F sample insert).
For an in-depth description of slow MAS and its applications to biospeci-mens, readers can refer to ref. 61.
5.4.3 Magic-angle Field Spinning
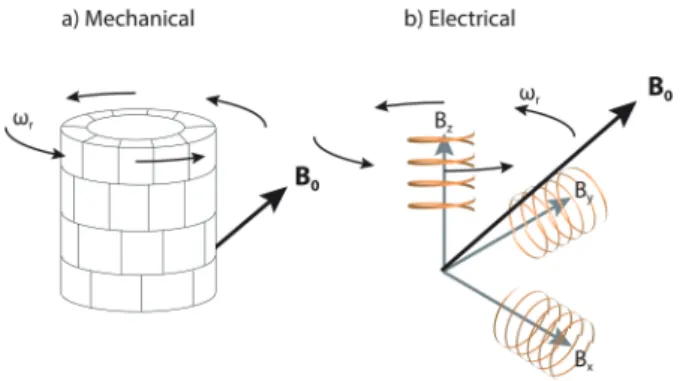
As mentioned in the previous section, the lOCMAT experiments on a live mouse under ultraslow MAS57,58 illustrated the possibility of in vivo MAS-based NMR investigations on animal models, and even human subjects. Clearly, spinning a human body at even 1 Hz is not practicable; however, spinning the magnetic field at the magic angle with respect to a living animal or human is possible. The effect of spinning the magnetic field is essentially the same as spinning the sample; it averages the magnetic susceptibility line broadening to zero. Figure 5.3 illustrates the two existing approaches for gen-erating a tilted magnetic field at the magic angle to the subject: (1) using small permanent magnets strategically positioned to set the direction of the magnetic field at the magic angle; and (2) using electromagnet or supercon-ducting magnet through a set of three pairs of orthogonal coils for generat-ing a total field at a specific angle. In both cases, the spinngenerat-ing field can be generated by mechanically rotating the entire unit. In the case of electromag-nets, the spinning field can also be obtained by generating time-dependent fields along the three coordinate directions.
In 1968, Bradbury and coworkers62 first explored the idea of NMR spec-troscopy in rotating magnetic fields but with little success. About 40 years later, pines and coworkers performed the first successful magic-angle field spinning experiment63,64 using electromagnets with three orthogonal
Figure 5.3 The two approaches for creating a titled magnetic field B0 oriented at magic-angle with respect to a stationary subject: (a) Mechanically using permanent magnets, and (b) electronically (or super-conducting) using three-pairs of orthogonal coils.
Helmholtz pairs generating a rotating field of 0.034 T (1.45 MHz for 1H). In 2010, Sakellariou and coworkers constructed a prototype of a tilted mag-netic field using small and inexpensive permanent cubic magnets.65 The design consists of two sets of magnets producing a longitudinal field (at ∼0.13 T) and a transverse field (at ∼0.18 T) components and creating a total magnetic field of about 0.22 T that is tilted at an angle of 54.6° with respect to the longitudinal axis of the magnet. In 2013, Iwasa and coworkers devel-oped the first prototype of superconducting magic-angle field magnet.66 The magnet is composed of a z-axis 0.866 T solenoid and x-axis 1.225 T
dipole operated at 4.2 K. The combined fields produce a 1.5 T field (63.83 MHz for 1H) at a magic angle with respect to the rotational z-axis. However, the magnet spinning mechanism has yet to be implemented, and there are no spectral data available.
Whether it is a permanent or superconducting magnet, both the stability and homogeneity of the B0 field are essential for high-resolution NMR spec-troscopy (as per the static commercial NMR magnets). If successfully imple-mented, high spectral quality NMR magic-angle-spinning magnets would find a wide range of new applications, including in vivo metabolic
investiga-tions with animal and human subjects.
5.4.4 Microscopic Quantity
As NMR is an inherently insensitive technique, HR-MAS studies require large sample volumes, typically 10–20 mg per NMR data. Therefore, HR-MAS can be a real challenge or even impossible when specimens are scarce, like in the case of specific cell types or living organisms, or rare diseased biopsies. Moreover, the investigation of a target cell group can be difficult.
Analyses of small samples (<1 mg) would simplify the sample preparation in case of scarce specimens, and also would make the study of specific specimens possible. One way to increase the mass sensitivity (signal-to-noise per unit mass) is miniaturizing the detection coil for maximizing the radiofrequency field per unit current (B1/i) and the filling factor (the ratio of the sample vol-ume to the coil detection volvol-ume).67 Two recent reports showcase the advance-ments in µcoil technology for liquid-state NMR spectroscopy in biological samples: (1) the design of a micro-NMR diagnostic device for the analysis of human tumor samples,68 and (2) the near complete liquid-state NMR assign-ment of a 68-residue protein using only 6 µl of a 1.4 mM protein solution.69
Metabolomics studies that use µcoil detection under MAS conditions are nearly non-existent because assembling a µcoil for sample spinning with high-resolution capability is a real challenge. The current commercial µMAS probes (0.7 mm Bruker MAS and 0.75 mm JeOl MAS) are designed for sol-ids and provide spectral resolutions of 0.01 ppm, not suitable for metabolic investigations, which require at least 0.002 ppm.
A different approach for the analysis of mass-limited biospecimens is the High-Resolution Magic-Angle Coil Spinning (HR-MACS) technique.70,71 In HR-MACS, as with the original MACS experiment,72 a secondary tuned
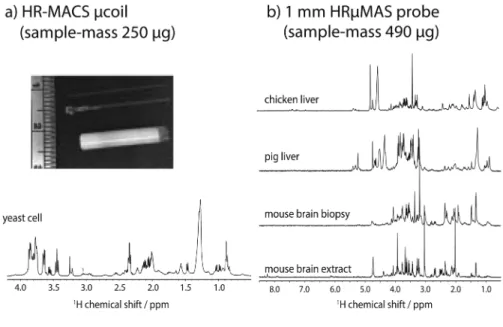
circuit and a simple and robust rotor insert are fit inside a standard MAS sample rotor to convert the MAS probe into a µMAS probe without any probe modification. Using HR-MACS, Wong and coworkers were able to perform metabolic profiling of whole small organisms (Caenorhabditis elegans)73 and intact cells (Saccharomyces cerevisiae)74 with only 250 µg of biospecimens (Figure 5.4a). Unfortunately, the effort required for fabricating and operat-ing the HR-MACS µcoil limits the application of HR-MACS to metabolomics research, especially for large-scale sampling studies.
Very recently, Wong and coworkers, together with JeOl Resonance Inc., introduced a high-resolution-capable 1 mm µMAS probe (denoted as HR-µMAS)75 specifically designed—using a susceptibility-matched MAS sta-tor and coil—for metabolomics studies of scarce specimens <500 µg. The HR-µMAS probe, similar to the standard 4 mm HR-MAS probes, integrates a 2H-locking device for high-resolution acquisition and a temperature regu-lation unit. It is also capable of stable MAS spinning and high spectral res-olution acquisition. Figure 5.4b illustrates the excellent spectra obtained
Figure 5.4 examples of 1H NMR spectra of microgram specimens acquired from (a) HR-MACS self-resonant µcoil and (b) 1 mm HR-µMAS probe. In (a), the insert photo displays a hand-wound HR-MACS µcoil with a coil- diameter of 550 µm, and a Bruker 4 mm ZrO2 rotor for size comparison. A 1H HR-MACS NMR spectrum of 250 µg of intact Saccharomyces
cerevi-siae cells is shown. The spectrum was acquired with a 550 µm HR-MACS
at 500 MHz with a MAS frequency of 300 Hz. In (b), it displays a series of high-quality 1H NMR spectra of different biospecimens (490 µg) recorded using a 1 mm HR-µMAS probe. The spectra were acquired with MAS at 2000 Hz at 600 MHz at 295 K. The total acquisition time for all spectra in (a) and (b) is between 10 and 20 minutes, and the spectral resolution is <0.002 ppm, on a par with the liquid-state NMR standard.
with HR-µMAS on different biospecimens. Seeing the first promising results, the HR-µMAS NMR probe will likely become a routine analytical tool for metabolomics.
5.5 Concluding Remarks
After two decades of development and exploration of the HR-MAS technique for NMR-based metabolomics research, the early challenge of obtaining high spectral resolution data and developing applications for metabolom-ics have been fully addressed. Subsequently, HR-MAS has now become an invaluable NMR spectroscopic technique that is routinely applied in biologi-cal and medibiologi-cal science for obtaining crucial metabolic information from
ex vivo intact specimens, and relating them to in vivo systems.
Despite the tremendous progress made in HR-MAS NMR for metabolomics, the technique has yet to become a reliable platform for in vivo systems. With
the continuous development in the HR-MAS technology, we believe that in vivo
HR-MAS will one day become a vital screening tool for metabolomics research. Hopefully, this introductory chapter will encourage scientists in all fields— engineering, physics or biology—to explore the current (or new) MAS technol-ogies and continue the advancement of HR-MAS NMR-based metabolomics.
Acknowledgements
I would like to thank the French National Research Agency (ANR-12-JSV5- 0005) and Nanosciences et Innovation pour les Matériaux, la Biomédecine et l'Énergie (NIMBe) at CeA Saclay for their support, and Dr Fabrizia poli for her valuable inputs on the chapter.
References
1. W. B. Dunn and D. I. ellis, Trends Anal. Chem., 2005, 24, 285.
2. J. C. lindon, e. Holmes and J. K. Nicholson, Anal. Chem., 2003, 75, 384A.
3. N. V. Reo, Drug Chem. Toxicol., 2002, 25, 375.
4. F. Adebodun and J. F. M. post, NMR Biomed., 1993, 6, 125.
5. p. Weybright, K. Millis, N. Campbell, D. g. Cory and S. Singer, Magn. Reson. Med., 1998, 39, 337.
6. J. K. Nicholson, e. Holmes, J. M. Kinross, A. W. Darzi, Z. Takats and J. C. lindon, Nature, 2012, 491, 384.
7. M. piotto, F. M. Moussallieh, A. Neuville, J. p. Bellocq, K. elbayed and I. J. Namer, J. Med. Case Rep., 2012, 6, 22.
8. H. Keun, Methods Enzymol., 2014, 543, 297.
9. e. M. Defeo and l. l. Cheng, Technol. Cancer Res. Treat., 2010, 9, 381.
10. e. M. Defeo and l. l. Cheng, NMR Biomed., 2014, 27, 90.
11. B. Sitter, T. F. Bathen, M. B. Tessem and I. S. gribbestad, Prog. Nucl. Magn. Reson. Spectrosc., 2009, 54, 239.
12. S. Moestue, B. Sitter, T. F. Bathen, M.-B. Tessem and I. S. gribbestad,
Curr. Top. Med. Chem., 2011, 11, 2.
13. M. Valentini, M. Ritota, C. Cafiero, S. Cozzolino, l. leita and p. Sequi,
Magn. Reson. Chem., 2011, 49, S121.
14. A. M. gil and I. F. Duarte, Modern Magn. Reson., 2006, 1765.
15. W. li, Analyst, 2006, 131, 777.
16. T. M. Alam and J. e. Jenkins, in Advanced Aspects of Spectroscopy, ed. M. A.
Farrukh, InTech, 2012, ch. 10, pp. 279–306.
17. W. p. power, Annu. Rep. NMR Spectrosc., 2003, 51, 261.
18. W. p. power, Annu. Rep. NMR Spectrosc., 2010, 72, 111.
19. J. C. lindon, O. p. Beckonert, e. Holmes and J. K. Nicholson, Prog. Nucl. Magn. Reson. Spectrosc., 2009, 55, 79.
20. O. Beckonert, M. Coen, H. C. Keun, Y. Wang, T. M. D. ebbels, e. Holmes, J. C. lindon and J. K. Nicholson, Nat. Protoc., 2010, 5, 1019.
21. J.-H. Chen and S. Singer, in The Handbook of Metabonomics and Metabo-lomics, ed. J. C. lindon, J. K. Nicholson and e. Holmes, elsevier, Oxford,
2007, ch. 4, pp. 113–147.
22. V. esteve, B. Martinez-granados and M. Martinez-Bisbal, Front. Chem.,
2014, 2, 33.
23. D. l. VanderHart, in Encyclopedia of Magnetic Resonance, ed. D. M. grant
and R. K. Harris, John Wiley & Sons, New York, 1996, pp. 2938–2946. 24. A. Abragam, The Principles of Nuclear Magnetism, Clarendon press, 1961.
25. A. N. garroway, J. Magn. Reson., 1982, 49, 168.
26. F. D. Doty, g. entzminger and Y. A. Yang, Conc. Magn. Reson., 1998, 10, 133.
27. F. Schick, B. eismann, W.-I. Jung, H. Bongers, M. Bunse and O. lutz,
Magn. Reson. Med., 1993, 29, 158.
28. M. Van der graaf, Eur. Biophys. J., 2010, 39, 527.
29. S. Ramadan, A. lin and p. Stanwell, NMR Biomed., 2013, 26, 1630.
30. e. R. Andrew and R. g. eades, Nature, 1959, 183, 1802.
31. I. J. lowe, Phys. Rev. Lett., 1959, 2, 285.
32. F. D. Doty, g. entzminger and Y. A. Yang, Concepts Magn. Reson., 1998, 10, 239.
33. A. Sodickson and D. g. Cory, J. Magn. Reson., 1997, 128, 87.
34. M. piotto, K. elbayed, J.-M. Wieruszeski and g. lippens, J. Magn. Reson.,
2005, 173, 84.
35. D. S. Wishart, C. g. Bigam, J. Yao, F. Abildgaard, H. J. Dyson, e. Oldfield, J. l. Markley and B. D. Sykes, J. Biomol. NMR, 1995, 6, 135.
36. M. Andre, M. piotto, S. Caldarelli and J.-N. Dumez, Analyst, 2015, 140,
3942.
37. M. piotto, V. Saudek and V. Sklenář, J. Biomol. NMR, 1992, 2, 661.
38. S. Viel, F. Ziarelli and S. Caldarelli, Proc. Natl. Acad. Sci. U. S. A., 2003, 100,
9696.
39. A. pampel, F. engelke, D. groβ, T. Oerther and K. Zick, Bruker SpinReport,
2006, vol. 157/158, p. 26.
41. O. N. Antzutkin, Z. Song, X. Feng and M. H. levitt, J. Chem. Phys., 1994, 100, 130.
42. V. Righi, Y. Apidianakis, D. Mintzopoulos, l. Astrakas, l. g. Rahme and A. A. Tzika, Int. J. Mol. Med., 2010, 26, 175.
43. V. Righi, Y. Apidianakis, l. g. Rahme and A. A. Tzika, J. Visualized Exp.,
2010, 38, e1710.
44. V. Sarou-Kanian, N. Joudiou, F. louat, M. Yon, F. Szeremeta, S. Même, D. Massiot, M. Decoville, F. Fayon and J.-C. Beloeil, Sci. Rep., 2015, 5,
9872.
45. A. Bunescu, J. garric, B. Vollat, e. Canet-Soulas, D. graveron-Demillyc and F. Fauvelle, Mol. BioSyst., 2010, 6, 121.
46. p. Weybright, K. Millis, N. Campbell, D. g. Cory and S. Singer, Magn. Reson. Med., 1998, 39, 337.
47. B. J. Blaise, J. giacomotto, M. N. Triba, p. Toulhoat, M. piotto, l. emsley, l. Ségalat, M. e. Dumas and B. elena, J. Proteome Res., 2009, 8, 2542.
48. M. C. Martinez-Bisbal, V. esteve, B. Martinez-granado and B. Celda,
J. Biomed. Biotech., 2011, 763684.
49. S. Aime, e. Bruno, C. Cabella, S. Sebastiano, g. Digilio and V. Mainero,
Magn. Reson. Med., 2005, 54, 1547.
50. J. Z. Hu, R. A. Wind, J. Mclean, Y. A. gorby, C. T. Resch and J. K. Fredrick-son, Spectroscopy, 2004, 19, 98.
51. H. C. Bertram, J. Z. Hu, D. N. Rommereim, R. A. Wind and H. J. Andersen,
J. Agric. Food Chem., 2004, 52, 2681.
52. H. C. Bertram, H. J. Jakobsen and O. B. Nielsen, J. Agric. Food Chem., 2005, 53, 3229.
53. J. Z. Hu, W. Wang, F. liu, M. S. Solum, D. W. Alderman, R. J. pugmire and D. M. grant, J. Magn. Reson., Ser. A, 1995, 113, 210.
54. J. Z. Hu, D. N. Rommereim and R. A. Wind, Magn. Reson. Med., 2002, 47,
829.
55. J. Z. Hu and R. A. Wind, J. Magn. Reson., 2002, 159, 92.
56. A. Wong, p. M. Aguiar and D. Sakellariou, Magn. Reson. Med., 2010, 63,
269.
57. R. A. Wind, J. Z. Hu and D. N. Rommereim, Magn. Reson. Med., 2003, 50,
1113.
58. R. A. Wind, J. Z. Hu and p. D. Majors, Magn. Reson. Med., 2006, 55, 41.
59. M. Renault, l. Shintu, M. piotto and S. Caldarelli, Sci. Rep., 2013, 3, 3349.
60. M. Andre, J.-N. Dumez, l. Rezig, l. Shintu, M. piotto and S. Caldarelli,
Anal. Chem., 2014, 86, 10749.
61. R. A. Wind and J. Z. Hu, Prog. Nucl. Magn. Reson. Spectrosc., 2006, 49, 207.
62. A. Bradbury, R. g. eades and J. g. McCarten, Phys. Lett., 1968, 26A, 405.
63. C. A. Meriles, D. Sakellariou, A. Moule, M. goldman, T. F. Budinger and A. pines, J. Magn. Reson., 2004, 169, 13.
64. D. Sakellariou, C. A. Meriles, R. W. Martin and A. pines, Magn. Reson. Imaging, 2005, 23, 295.
65. D. Sakellariou, C. Hugon, A. guiga, g. Aubert, S. Cazaux and p. Hardy,
66. J. Voccio, S. Hahn, D. K. park, J. ling, Y. Kim, J. Bascuñán and Y. Iwasa,
IEEE Trans. Appl. Supercond., 2013, 23, 4300804.
67. D. I. Hoult and R. e. Richards, J. Magn. Reson., 1976, 24, 71.
68. J. B. Haun, C. M. Castro, R. Wang, V. M. peterson, B. S. Marinelli, H. lee and R. Weissleder, Sci. Transl. Med., 2011, 3, 71ra16.
69. J. M. Aramini, p. Rossi, C. Anklin, R. Xiao and g. T. Montelione, Nat. Methods, 2007, 4, 491.
70. A. Wong, B. Jiménez, X. li, e. Holmes, J. K. Nicholson, J. C. lindon and D. Sakellariou, Anal. Chem., 2012, 84, 3843.
71. A. Wong, X. li and D. Sakellariou, Anal. Chem., 2013, 85, 2021.
72. D. Sakellariou, g. le goff and J.-F. Jacquinot, Nature, 2007, 447, 694.
73. A. Wong, X. li, l. Molin, F. Solari, B. elena-Herrmann and D. Sakellariou,
Anal. Chem., 2014, 86, 6064.
74. A. Wong, C. Boutin and p. M. Aguiar, Front. Chem., 2014, 2, 38.
75. Y. Nishiyama, Y. endo, T. Nemoto, A.-K. Bouzier-Sore and A. Wong,